Larressore Airbnb Market Analysis 2026: Short Term Rental Data & Vacation Rental Statistics in Nouvelle-Aquitaine, France
Is Airbnb profitable in Larressore in 2026? Explore comprehensive Airbnb analytics for Larressore, Nouvelle-Aquitaine, France to uncover income potential. This 2026 STR market report for Larressore, based on AirROI data from February 2025 to January 2026, reveals key trends in the niche market of 27 active listings.
Whether you're considering an Airbnb investment in Larressore, optimizing your existing vacation rental, or exploring rental arbitrage opportunities, understanding the Larressore Airbnb data is crucial. Navigating the high regulation landscape is key to maximizing your short term rental income potential. Let's dive into the specifics.
Key Larressore Airbnb Performance Metrics Overview
Monthly Airbnb Revenue Variations & Income Potential in Larressore (2026)
Understanding the monthly revenue variations for Airbnb listings in Larressore is key to maximizing your short term rental income potential. Seasonality significantly impacts earnings. Our analysis, based on data from the past 12 months, shows that the peak revenue month for STRs in Larressore is typically August, while February often presents the lowest earnings, highlighting opportunities for strategic pricing adjustments during shoulder and low seasons. Explore the typical Airbnb income in Larressore across different performance tiers:
- Best-in-class properties (Top 10%) achieve $3,745+ monthly, often utilizing dynamic pricing and superior guest experiences.
- Strong performing properties (Top 25%) earn $2,348 or more, indicating effective management and desirable locations/amenities.
- Typical properties (Median) generate around $1,660 per month, representing the average market performance.
- Entry-level properties (Bottom 25%) see earnings around $1,040, often with potential for optimization.
Average Monthly Airbnb Earnings Trend in Larressore
Larressore Airbnb Occupancy Rate Trends (2026)
Maximize your bookings by understanding the Larressore STR occupancy trends. Seasonal demand shifts significantly influence how often properties are booked. Typically, Augustsees the highest demand (peak season occupancy), while January experiences the lowest (low season). Effective strategies, like adjusting minimum stays or offering promotions, can boost occupancy during slower periods. Here's how different property tiers perform in Larressore:
- Best-in-class properties (Top 10%) achieve 80%+ occupancy, indicating high desirability and potentially optimized availability.
- Strong performing properties (Top 25%) maintain 65% or higher occupancy, suggesting good market fit and guest satisfaction.
- Typical properties (Median) have an occupancy rate around 45%.
- Entry-level properties (Bottom 25%) average 27% occupancy, potentially facing higher vacancy.
Average Monthly Occupancy Rate Trend in Larressore
Average Daily Rate (ADR) Airbnb Trends in Larressore (2026)
Effective short term rental pricing strategy in Larressore involves understanding monthly ADR fluctuations. The Average Daily Rate (ADR) for Airbnb in Larressore typically peaks in September and dips lowest during March. Leveraging Airbnb dynamic pricing tools or strategies based on this seasonality can significantly boost revenue. Here's a look at the typical nightly rates achieved:
- Best-in-class properties (Top 10%) command rates of $325+ per night, often due to premium features or locations.
- Strong performing properties (Top 25%) achieve nightly rates of $178 or more.
- Typical properties (Median) charge around $107 per night.
- Entry-level properties (Bottom 25%) earn around $82 per night.
Average Daily Rate (ADR) Trend by Month in Larressore
Get Live Larressore Market Intelligence 👇

Explore Real-time Analytics
Airbnb Seasonality Analysis & Trends in Larressore (2026)
Peak Season (August, July, September)
- Revenue averages $3,374 per month
- Occupancy rates average 67.0%
- Daily rates average $170
Shoulder Season
- Revenue averages $1,702 per month
- Occupancy maintains around 46.8%
- Daily rates hold near $157
Low Season (January, February, November)
- Revenue drops to average $907 per month
- Occupancy decreases to average 28.7%
- Daily rates adjust to average $158
Seasonality Insights for Larressore
- The Airbnb seasonality in Larressore shows highly seasonal trends requiring careful strategy. While the sections above show seasonal averages, it's also insightful to look at the extremes:
- During the high season, the absolute peak month showcases Larressore's highest earning potential, with monthly revenues capable of climbing to $4,132, occupancy reaching a high of 77.8%, and ADRs peaking at $177.
- Conversely, the slowest single month of the year, typically falling within the low season, marks the market's lowest point. In this month, revenue might dip to $698, occupancy could drop to 19.6%, and ADRs may adjust down to $146.
- Understanding both the seasonal averages and these monthly peaks and troughs in revenue, occupancy, and ADR is crucial for maximizing your Airbnb profit potential in Larressore.
Seasonal Strategies for Maximizing Profit
- Peak Season: Maximize revenue through premium pricing and potentially longer minimum stays. Ensure high availability.
- Low Season: Offer competitive pricing, special promotions (e.g., extended stay discounts), and flexible cancellation policies. Target off-season travelers like remote workers or budget-conscious guests.
- Shoulder Seasons: Implement dynamic pricing that balances peak and low rates. Target weekend travelers or specific events. Offer slightly more flexible terms than peak season.
- Regularly analyze your own performance against these Larressore seasonality benchmarks and adjust your pricing and availability strategy accordingly.
Best Areas for Airbnb Investment in Larressore (2026)
Exploring the top neighborhoods for short-term rentals in Larressore? This section highlights key areas, outlining why they are attractive for hosts and guests, along with notable local attractions. Consider these locations based on your target guest profile and investment strategy.
| Neighborhood / Area | Why Host Here? (Target Guests & Appeal) | Key Attractions & Landmarks |
|---|---|---|
| Larressore Village Center | Charming village atmosphere with local markets and shops. Perfect for visitors looking for an authentic French experience with easy access to amenities. | Église Saint-Jean-Baptiste, Village Market, Local Cafés, Artisans' Boutiques |
| Bidart Beach | Proximity to the stunning beaches of Bidart. Ideal for beach lovers and surfers, providing a relaxed coastal experience. | Plage de Bidart, Surf Schools, Coastal Walks, Restaurants with sea views |
| Saint-Jean-de-Luz | Popular coastal town known for its beautiful bay and sandy beaches. Great for families and those exploring the Basque region. | St. John the Baptist Church, Plage de Saint-Jean-de-Luz, Promenade Jacques Thibaud, Local seafood restaurants |
| Bayonne City Center | Historical city with a rich cultural heritage and vibrant food scene. Attracts tourists interested in history and gastronomy. | Bayonne Cathedral, Chocolateries, Musée Basque, Old Town with Basque architecture |
| Biarritz | Trendy seaside resort famous for its surfing spots and luxury accommodations. Attracts tourists and influencers alike. | Grande Plage, Biarritz Lighthouse, Musee de la Mer, Cafés and Bars along the coast |
| Espelette | Famous for its unique red peppers, this charming village offers a glimpse into Basque culture and cuisine. Ideal for food enthusiasts. | Espelette Peppers Market, Château d'Espelette, Local Gastronomy Tours, Festivals |
| Anglet | Known for its beautiful coastline and surf culture, Anglet offers a mix of beach relaxation and outdoor activities. | Les Cinq Cantons Beach, Chiberta Park, Cycling Trails, Surfing Schools |
| Saint-Pée-sur-Nivelle | A quaint village set by a lake, perfect for nature lovers and those seeking tranquility away from the hustle and bustle. | Lake Saint-Pée, Hiking Trails, Local Cultural Events, Scenic Views |
Understanding Airbnb License Requirements & STR Laws in Larressore (2026)
Yes, Larressore, Nouvelle-Aquitaine, France enforces high STR regulations. Obtaining a license and ensuring compliance is almost certainly required according to current 2026 STR laws. Always verify the latest short term rental regulations and Airbnb license requirements directly with local government authorities for Larressore to ensure full compliance before hosting.
(Source: AirROI data, 2026, based on 89% licensed listings)
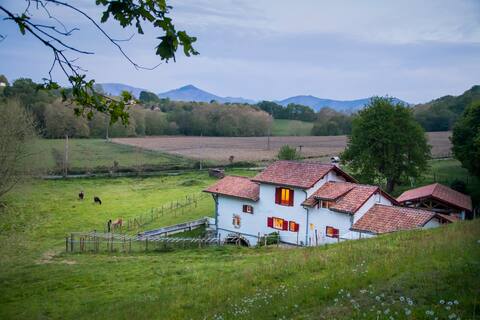
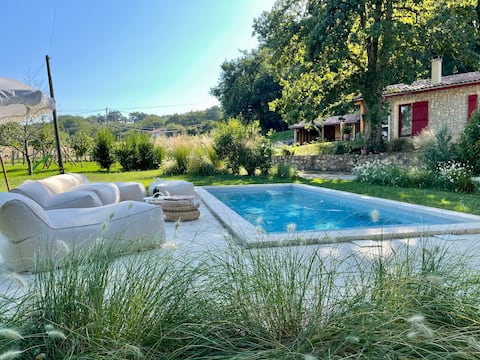
Top Performing Airbnb Properties in Larressore (2026)
Benchmark your potential! Explore examples of top-performing Airbnb properties in Larressorebased on Trailing Twelve Month (TTM) revenue. Analyze their characteristics, revenue, occupancy rate, and ADR to understand what drives success in this market.

Large sunny home with pool
Entire Place • 5 bedrooms
The 18th-century Mill
Entire Place • 4 bedrooms
The 18th century Moulin outbuilding.
Entire Place • 2 bedrooms
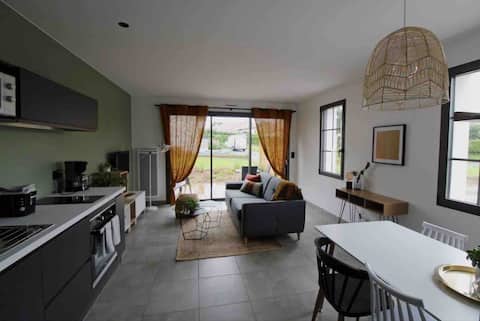
T2 Heart of Basque village, with terrace, Artzamendi
Entire Place • 1 bedroom

Two-bedroom apartment, heart of Basque village, terrace, Ezpeleta
Entire Place • 1 bedroom

beautiful apartment in the heart of the Basque country
Entire Place • 2 bedrooms
Note: Performance varies based on location, size, amenities, seasonality, and management quality. Data reflects the past 12 months.
Top Performing Airbnb Hosts in Larressore (2026)
Learn from the best! This table showcases top-performing Airbnb hosts in Larressore based on the number of properties managed and estimated total revenue over the past year. Analyze their scale and performance metrics.
| Host Name | Properties | Grossing Revenue | Stay Reviews | Avg Rating |
|---|---|---|---|---|
| Aurore | 2 | $71,992 | 13 | 5.00/5.0 |
| Julie | 2 | $55,785 | 531 | 4.70/5.0 |
| Valérie | 1 | $51,263 | 39 | 4.92/5.0 |
| Christophe | 1 | $25,792 | 109 | 4.94/5.0 |
| Eamonn | 1 | $23,905 | 17 | 5.00/5.0 |
| Nadine | 1 | $23,684 | 40 | 4.95/5.0 |
| Frederic | 1 | $21,727 | 25 | 5.00/5.0 |
| Ludovic | 1 | $21,292 | 124 | 4.84/5.0 |
| Mireille | 1 | $20,810 | 63 | 4.81/5.0 |
| Stéphane | 1 | $18,740 | 590 | 4.86/5.0 |
Analyzing the strategies of top hosts, such as their property selection, pricing, and guest communication, can offer valuable lessons for optimizing your own Airbnb operations in Larressore.
Dive Deeper: Advanced Larressore STR Market Data (2026)
Ready to unlock more insights? AirROI provides access to advanced metrics and comprehensive Airbnb data for Larressore. Explore detailed analytics beyond this report to refine your investment strategy, optimize pricing, and maximize your vacation rental profits.
Explore Advanced MetricsLarressore Short-Term Rental Market Composition (2026): Property & Room Types
Room Type Distribution
Property Type Distribution
Market Composition Insights for Larressore
- The Larressore Airbnb market composition is heavily skewed towards Entire Home/Apt listings, which make up 96.3% of the 27 active rentals. This indicates strong guest preference for privacy and space.
- Looking at the property type distribution in Larressore, Apartment/Condo properties are the most common (48.1%), reflecting the local real estate landscape.
- Houses represent a significant 44.4% portion, catering likely to families or larger groups.
Larressore Airbnb Room Capacity Analysis (2026): Bedroom Distribution
Distribution of Listings by Number of Bedrooms
Room Capacity Insights for Larressore
- The dominant room capacity in Larressore is 1 bedroom listings, making up 48.1% of the market. This suggests a strong demand for properties suitable for couples or solo travelers.
- Together, 1 bedroom and 2 bedrooms properties represent 70.3% of the active Airbnb listings in Larressore, indicating a high concentration in these sizes.
- A significant 25.9% of listings offer 3+ bedrooms, catering to larger groups and families seeking more space in Larressore.
Larressore Vacation Rental Guest Capacity Trends (2026)
Distribution of Listings by Guest Capacity
Guest Capacity Insights for Larressore
- The most common guest capacity trend in Larressore vacation rentals is listings accommodating 4 guests (37%). This suggests the primary traveler segment is likely small families or groups.
- Properties designed for 4 guests and 2 guests dominate the Larressore STR market, accounting for 66.6% of listings.
- 25.9% of properties accommodate 6+ guests, serving the market segment for larger families or group travel in Larressore.
- On average, properties in Larressore are equipped to host 4.1 guests.
Larressore Airbnb Booking Patterns (2026): Available vs. Booked Days
Available Days Distribution
Booked Days Distribution
Booking Pattern Insights for Larressore
- The most common availability pattern in Larressore falls within the 271-366 days range, representing 33.3% of listings. This suggests many properties have significant open periods on their calendars.
- Approximately 66.6% of listings show high availability (181+ days open annually), indicating potential for increased bookings or specific owner usage patterns.
- For booked days, the 91-180 days range is most frequent in Larressore (37%), reflecting common guest stay durations or potential owner blocking patterns.
- A notable 33.3% of properties secure long booking periods (181+ days booked per year), highlighting successful long-term rental strategies or significant owner usage.
Larressore Airbnb Minimum Stay Requirements Analysis
Distribution of Listings by Minimum Night Requirement
1 Night
3 listings
11.1% of total
2 Nights
4 listings
14.8% of total
3 Nights
2 listings
7.4% of total
4-6 Nights
9 listings
33.3% of total
7-29 Nights
3 listings
11.1% of total
30+ Nights
6 listings
22.2% of total
Key Insights
- The most prevalent minimum stay requirement in Larressore is 4-6 Nights, adopted by 33.3% of listings. This highlights the market's preference for longer commitments.
- A significant segment (22.2%) caters to monthly stays (30+ nights) in Larressore, pointing to opportunities in the extended-stay market.
Recommendations
- Align with the market by considering a 4-6 Nights minimum stay, as 33.3% of Larressore hosts use this setting.
- If feasible, allowing 1-night stays, especially midweek or during low season, could capture last-minute bookings, as only 11.1% currently do.
- Explore offering discounts for stays of 30+ nights to attract the 22.2% of the market seeking extended stays.
- Adjust minimum nights based on seasonality – potentially shorter during low season and longer during peak demand periods in Larressore.
Larressore Airbnb Cancellation Policy Trends Analysis (2026)
Flexible
9 listings
33.3% of total
Moderate
4 listings
14.8% of total
Firm
12 listings
44.4% of total
Strict
2 listings
7.4% of total
Cancellation Policy Insights for Larressore
- The prevailing Airbnb cancellation policy trend in Larressore is Firm, used by 44.4% of listings.
- A majority (51.8%) of hosts in Larressore utilize Firm or Strict policies, indicating a market where hosts prioritize booking security.
- Strict cancellation policies are quite rare (7.4%), potentially making listings with this policy less competitive unless justified by high demand or property type.
Recommendations for Hosts
- Consider adopting a Firm policy to align with the 44.4% market standard in Larressore.
- Using a Strict policy might deter some guests, as only 7.4% of listings use it. Evaluate if potential revenue protection outweighs possible lower booking rates.
- Regularly review your cancellation policy against competitors and market demand shifts in Larressore.
Larressore STR Booking Lead Time Analysis (2026)
Average Booking Lead Time by Month
Booking Lead Time Insights for Larressore
- The overall average booking lead time for vacation rentals in Larressore is 62 days.
- Guests book furthest in advance for stays during August (average 105 days), likely coinciding with peak travel demand or local events.
- The shortest booking windows occur for stays in January (average 16 days), indicating more last-minute travel plans during this time.
- Seasonally, Summer (93 days avg.) sees the longest lead times, while Winter (33 days avg.) has the shortest, reflecting typical travel planning cycles.
Recommendations for Hosts
- Use the overall average lead time (62 days) as a baseline for your pricing and availability strategy in Larressore.
- For August stays, consider implementing length-of-stay discounts or slightly higher rates for bookings made less than 105 days out to capitalize on advance planning.
- Target marketing efforts for the Summer season well in advance (at least 93 days) to capture early planners.
- Monitor your own booking lead times against these Larressore averages to identify opportunities for dynamic pricing adjustments.
Popular & Essential Airbnb Amenities in Larressore (2026)
Amenity Prevalence
Amenity Insights for Larressore
- Essential amenities in Larressore that guests expect include: TV, Free parking on premises, Kitchen. Lacking these (any) could significantly impact bookings.
- Popular amenities like Refrigerator, Hot water, Cooking basics are common but not universal. Offering these can provide a competitive edge.
Recommendations for Hosts
- Ensure your listing includes all essential amenities for Larressore: TV, Free parking on premises, Kitchen.
- Prioritize adding missing essentials: Free parking on premises, Kitchen.
- Consider adding popular differentiators like Refrigerator or Hot water to increase appeal.
- Highlight unique or less common amenities you offer (e.g., hot tub, dedicated workspace, EV charger) in your listing description and photos.
- Regularly check competitor amenities in Larressore to stay competitive.
Larressore Airbnb Guest Demographics & Profile Analysis (2026)
Guest Profile Summary for Larressore
- The typical guest profile for Airbnb in Larressore consists of primarily domestic travelers (80%), often arriving from nearby Paris, typically belonging to the Post-2000s (Gen Z/Alpha) group (50%), primarily speaking French or English.
- Domestic travelers account for 79.6% of guests.
- Key international markets include France (79.6%) and Spain (6.2%).
- Top languages spoken are French (40.3%) followed by English (31.8%).
- A significant demographic segment is the Post-2000s (Gen Z/Alpha) group, representing 50% of guests.
Recommendations for Hosts
- Target domestic marketing efforts towards travelers from Paris and Bordeaux.
- Tailor amenities and listing descriptions to appeal to the dominant Post-2000s (Gen Z/Alpha) demographic (e.g., highlight fast WiFi, smart home features, local guides).
- Highlight unique local experiences or amenities relevant to the primary guest profile.
- Consider seasonal promotions aligned with peak travel times for key origin markets.
Nearby Short-Term Rental Market Comparison
How does the Larressore Airbnb market stack up against its neighbors? Compare key performance metrics like average monthly revenue, ADR, and occupancy rates in surrounding areas to understand the broader regional STR landscape.
| Market | Active Properties | Monthly Revenue | Daily Rate | Avg. Occupancy |
|---|---|---|---|---|
| San Sebastián | 1,382 | $3,844 | $287.28 | 49% |
| Dima | 11 | $3,301 | $331.95 | 52% |
| Carignan-de-Bordeaux | 34 | $3,140 | $316.66 | 42% |
| Néac | 11 | $3,047 | $441.32 | 38% |
| Lasarte-Oria | 19 | $2,656 | $197.35 | 43% |
| Gautegiz Arteaga | 15 | $2,600 | $312.72 | 35% |
| Gatika | 10 | $2,596 | $437.05 | 33% |
| Cénac | 17 | $2,542 | $307.76 | 44% |
| Larraun | 17 | $2,530 | $246.29 | 38% |
| Saint-Laurent-de-Gosse | 17 | $2,519 | $345.09 | 35% |