Marval Airbnb Market Analysis 2026: Short Term Rental Data & Vacation Rental Statistics in Nouvelle-Aquitaine, France
Is Airbnb profitable in Marval in 2026? Explore comprehensive Airbnb analytics for Marval, Nouvelle-Aquitaine, France to uncover income potential. This 2026 STR market report for Marval, based on AirROI data from February 2025 to January 2026, reveals key trends in the niche market of 18 active listings.
Whether you're considering an Airbnb investment in Marval, optimizing your existing vacation rental, or exploring rental arbitrage opportunities, understanding the Marval Airbnb data is crucial. Navigating the high regulation landscape is key to maximizing your short term rental income potential. Let's dive into the specifics.
Key Marval Airbnb Performance Metrics Overview
Monthly Airbnb Revenue Variations & Income Potential in Marval (2026)
Understanding the monthly revenue variations for Airbnb listings in Marval is key to maximizing your short term rental income potential. Seasonality significantly impacts earnings. Our analysis, based on data from the past 12 months, shows that the peak revenue month for STRs in Marval is typically August, while November often presents the lowest earnings, highlighting opportunities for strategic pricing adjustments during shoulder and low seasons. Explore the typical Airbnb income in Marval across different performance tiers:
- Best-in-class properties (Top 10%) achieve $2,175+ monthly, often utilizing dynamic pricing and superior guest experiences.
- Strong performing properties (Top 25%) earn $1,571 or more, indicating effective management and desirable locations/amenities.
- Typical properties (Median) generate around $931 per month, representing the average market performance.
- Entry-level properties (Bottom 25%) see earnings around $615, often with potential for optimization.
Average Monthly Airbnb Earnings Trend in Marval
Marval Airbnb Occupancy Rate Trends (2026)
Maximize your bookings by understanding the Marval STR occupancy trends. Seasonal demand shifts significantly influence how often properties are booked. Typically, Augustsees the highest demand (peak season occupancy), while November experiences the lowest (low season). Effective strategies, like adjusting minimum stays or offering promotions, can boost occupancy during slower periods. Here's how different property tiers perform in Marval:
- Best-in-class properties (Top 10%) achieve 54%+ occupancy, indicating high desirability and potentially optimized availability.
- Strong performing properties (Top 25%) maintain 42% or higher occupancy, suggesting good market fit and guest satisfaction.
- Typical properties (Median) have an occupancy rate around 31%.
- Entry-level properties (Bottom 25%) average 20% occupancy, potentially facing higher vacancy.
Average Monthly Occupancy Rate Trend in Marval
Average Daily Rate (ADR) Airbnb Trends in Marval (2026)
Effective short term rental pricing strategy in Marval involves understanding monthly ADR fluctuations. The Average Daily Rate (ADR) for Airbnb in Marval typically peaks in October and dips lowest during March. Leveraging Airbnb dynamic pricing tools or strategies based on this seasonality can significantly boost revenue. Here's a look at the typical nightly rates achieved:
- Best-in-class properties (Top 10%) command rates of $146+ per night, often due to premium features or locations.
- Strong performing properties (Top 25%) achieve nightly rates of $120 or more.
- Typical properties (Median) charge around $93 per night.
- Entry-level properties (Bottom 25%) earn around $88 per night.
Average Daily Rate (ADR) Trend by Month in Marval
Get Live Marval Market Intelligence 👇
Explore Real-time Analytics
Airbnb Seasonality Analysis & Trends in Marval (2026)
Peak Season (August, July, September)
- Revenue averages $2,136 per month
- Occupancy rates average 58.4%
- Daily rates average $112
Shoulder Season
- Revenue averages $974 per month
- Occupancy maintains around 27.8%
- Daily rates hold near $105
Low Season (January, February, November)
- Revenue drops to average $476 per month
- Occupancy decreases to average 16.7%
- Daily rates adjust to average $106
Seasonality Insights for Marval
- The Airbnb seasonality in Marval shows highly seasonal trends requiring careful strategy. While the sections above show seasonal averages, it's also insightful to look at the extremes:
- During the high season, the absolute peak month showcases Marval's highest earning potential, with monthly revenues capable of climbing to $2,871, occupancy reaching a high of 77.2%, and ADRs peaking at $115.
- Conversely, the slowest single month of the year, typically falling within the low season, marks the market's lowest point. In this month, revenue might dip to $288, occupancy could drop to 10.0%, and ADRs may adjust down to $94.
- Understanding both the seasonal averages and these monthly peaks and troughs in revenue, occupancy, and ADR is crucial for maximizing your Airbnb profit potential in Marval.
Seasonal Strategies for Maximizing Profit
- Peak Season: Maximize revenue through premium pricing and potentially longer minimum stays. Ensure high availability.
- Low Season: Offer competitive pricing, special promotions (e.g., extended stay discounts), and flexible cancellation policies. Target off-season travelers like remote workers or budget-conscious guests.
- Shoulder Seasons: Implement dynamic pricing that balances peak and low rates. Target weekend travelers or specific events. Offer slightly more flexible terms than peak season.
- Regularly analyze your own performance against these Marval seasonality benchmarks and adjust your pricing and availability strategy accordingly.
Best Areas for Airbnb Investment in Marval (2026)
Exploring the top neighborhoods for short-term rentals in Marval? This section highlights key areas, outlining why they are attractive for hosts and guests, along with notable local attractions. Consider these locations based on your target guest profile and investment strategy.
| Neighborhood / Area | Why Host Here? (Target Guests & Appeal) | Key Attractions & Landmarks |
|---|---|---|
| Bordeaux | As the capital of the Nouvelle-Aquitaine region, Bordeaux is famous for its wine, history, and architecture. A UNESCO World Heritage Site, it attracts tourists with its vibrant cultural scene and proximity to vineyards. | Place de la Bourse, La Cité du Vin, Bordeaux's Historic Center, Garonne River, Jardin Public |
| Arcachon | Known for its beautiful beaches and the iconic Dune du Pilat, Arcachon is a popular seaside destination for families and tourists looking for a relaxing beach getaway. | Dune du Pilat, Arcachon Bay, Ares Beach, Winter Town, Parc Mauresque |
| Cognac | Famous for its brandy production, Cognac draws visitors interested in distilleries and tasting experiences. A charming town with history and culture, ideal for foodies. | Cognac vineyards, Hennessy Distillery, Cognac City Centre, Pineau des Charentes tasting, The Crocodile Park |
| La Rochelle | A vibrant port city with a rich maritime history, La Rochelle is known for its picturesque harbor, historic architecture, and seafood gastronomy. It's a popular tourist destination during summer. | Vieux Port, Towers of La Rochelle, Aquarium La Rochelle, Historic Centre, Plage de la Concurrence |
| Saint-Émilion | This medieval village is renowned for its wine and beautiful landscapes. It attracts wine lovers and those interested in history and architecture. | Saint-Émilion Monolithic Church, Vineyard tours, Wine estates, Les Cordeliers, Historic Monuments |
| Périgueux | Périgueux is known for its Roman heritage and medieval architecture. It offers a charming atmosphere that appeals to history enthusiasts and travelers seeking authenticity. | Périgueux Cathedral, Vesunna Gallo-Roman Museum, Historic Town Centre, Isle Valley, Jardin des Arenes |
| Angoulême | This city is famous for its comic art and hosts the International Comic Festival. With a lively cultural scene, it's attractive to young tourists and families. | Cité Internationale de la BD, Angoulême Cathedral, Historic Fortifications, Comic Art Museum, Charente River |
| Bayonne | Bayonne is known for its Basque culture, cuisine, and architecture. The city’s festive spirit and rich cultural heritage make it a great location for hosting tourists. | Bayonne Cathedral, Basque Cuisine, The Basque Museum, Old Town, Chocolaterie Bonnat |
Understanding Airbnb License Requirements & STR Laws in Marval (2026)
Yes, Marval, Nouvelle-Aquitaine, France enforces high STR regulations. Obtaining a license and ensuring compliance is almost certainly required according to current 2026 STR laws. Always verify the latest short term rental regulations and Airbnb license requirements directly with local government authorities for Marval to ensure full compliance before hosting.
(Source: AirROI data, 2026, based on 33% licensed listings)
Top Performing Airbnb Properties in Marval (2026)
Benchmark your potential! Explore examples of top-performing Airbnb properties in Marvalbased on Trailing Twelve Month (TTM) revenue. Analyze their characteristics, revenue, occupancy rate, and ADR to understand what drives success in this market.

Renovated barn with private pool in Marval
Entire Place • 4 bedrooms

Les Hirondelles
Entire Place • 4 bedrooms

Warm cottage + pool - 4 people
Entire Place • 2 bedrooms

Guest house in the heart of Périgord Vert
Entire Place • 4 bedrooms
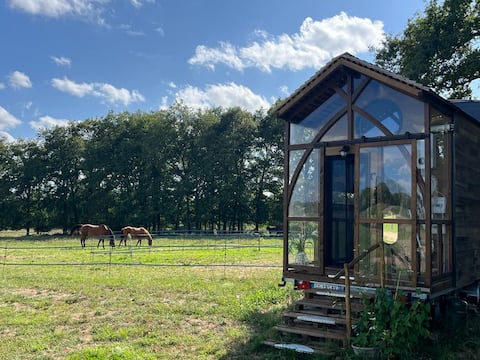
Tiny House en Périgord Vert
Entire Place • 1 bedroom

The Farm
Entire Place • 1 bedroom
Note: Performance varies based on location, size, amenities, seasonality, and management quality. Data reflects the past 12 months.
Top Performing Airbnb Hosts in Marval (2026)
Learn from the best! This table showcases top-performing Airbnb hosts in Marval based on the number of properties managed and estimated total revenue over the past year. Analyze their scale and performance metrics.
| Host Name | Properties | Grossing Revenue | Stay Reviews | Avg Rating |
|---|---|---|---|---|
| Diana | 5 | $55,705 | 608 | 4.84/5.0 |
| Pascale | 2 | $26,420 | 36 | 4.78/5.0 |
| Neill & Karen | 1 | $26,383 | 2 | Not Rated |
| Jackie | 4 | $19,836 | 207 | 4.84/5.0 |
| Joseph | 1 | $17,731 | 4 | 4.75/5.0 |
| Charlène | 1 | $8,715 | 17 | 4.76/5.0 |
| Rosemarie | 1 | $7,479 | 8 | 4.88/5.0 |
| Gîte De La Petite Lisonne | 1 | $7,410 | 24 | 5.00/5.0 |
| Jean-Jacques | 1 | $2,553 | 27 | 4.89/5.0 |
| Christine | 1 | $829 | 7 | 4.57/5.0 |
Analyzing the strategies of top hosts, such as their property selection, pricing, and guest communication, can offer valuable lessons for optimizing your own Airbnb operations in Marval.
Dive Deeper: Advanced Marval STR Market Data (2026)
Ready to unlock more insights? AirROI provides access to advanced metrics and comprehensive Airbnb data for Marval. Explore detailed analytics beyond this report to refine your investment strategy, optimize pricing, and maximize your vacation rental profits.
Explore Advanced MetricsMarval Short-Term Rental Market Composition (2026): Property & Room Types
Room Type Distribution
Property Type Distribution
Market Composition Insights for Marval
- The Marval Airbnb market composition is heavily skewed towards Entire Home/Apt listings, which make up 100% of the 18 active rentals. This indicates strong guest preference for privacy and space.
- Looking at the property type distribution in Marval, House properties are the most common (77.8%), reflecting the local real estate landscape.
- Houses represent a significant 77.8% portion, catering likely to families or larger groups.
- The presence of 11.1% Hotel/Boutique listings indicates integration with traditional hospitality.
Marval Airbnb Room Capacity Analysis (2026): Bedroom Distribution
Distribution of Listings by Number of Bedrooms
Room Capacity Insights for Marval
- The dominant room capacity in Marval is 2 bedrooms listings, making up 44.4% of the market. This suggests a strong demand for properties suitable for couples or solo travelers.
- Together, 2 bedrooms and 4 bedrooms properties represent 72.2% of the active Airbnb listings in Marval, indicating a high concentration in these sizes.
- A significant 33.4% of listings offer 3+ bedrooms, catering to larger groups and families seeking more space in Marval.
Marval Vacation Rental Guest Capacity Trends (2026)
Distribution of Listings by Guest Capacity
Guest Capacity Insights for Marval
- The most common guest capacity trend in Marval vacation rentals is listings accommodating 4 guests (27.8%). This suggests the primary traveler segment is likely small families or groups.
- Properties designed for 4 guests and 8+ guests dominate the Marval STR market, accounting for 50.0% of listings.
- 33.4% of properties accommodate 6+ guests, serving the market segment for larger families or group travel in Marval.
- On average, properties in Marval are equipped to host 5.0 guests.
Marval Airbnb Booking Patterns (2026): Available vs. Booked Days
Available Days Distribution
Booked Days Distribution
Booking Pattern Insights for Marval
- The most common availability pattern in Marval falls within the 271-366 days range, representing 55.6% of listings. This suggests many properties have significant open periods on their calendars.
- Approximately 100.0% of listings show high availability (181+ days open annually), indicating potential for increased bookings or specific owner usage patterns.
- For booked days, the 91-180 days range is most frequent in Marval (50%), reflecting common guest stay durations or potential owner blocking patterns.
Marval Airbnb Minimum Stay Requirements Analysis
Distribution of Listings by Minimum Night Requirement
1 Night
2 listings
11.1% of total
2 Nights
2 listings
11.1% of total
3 Nights
5 listings
27.8% of total
4-6 Nights
1 listings
5.6% of total
30+ Nights
8 listings
44.4% of total
Key Insights
- The most prevalent minimum stay requirement in Marval is 30+ Nights, adopted by 44.4% of listings. This highlights the market's preference for longer commitments.
- A significant segment (44.4%) caters to monthly stays (30+ nights) in Marval, pointing to opportunities in the extended-stay market.
Recommendations
- Align with the market by considering a 30+ Nights minimum stay, as 44.4% of Marval hosts use this setting.
- If feasible, allowing 1-night stays, especially midweek or during low season, could capture last-minute bookings, as only 11.1% currently do.
- Explore offering discounts for stays of 30+ nights to attract the 44.4% of the market seeking extended stays.
- Adjust minimum nights based on seasonality – potentially shorter during low season and longer during peak demand periods in Marval.
Marval Airbnb Cancellation Policy Trends Analysis (2026)
Flexible
8 listings
44.4% of total
Moderate
7 listings
38.9% of total
Firm
1 listings
5.6% of total
Strict
2 listings
11.1% of total
Cancellation Policy Insights for Marval
- The prevailing Airbnb cancellation policy trend in Marval is Flexible, used by 44.4% of listings.
- The market strongly favors guest-friendly terms, with 83.3% of listings offering Flexible or Moderate policies. This suggests guests in Marval may expect booking flexibility.
Recommendations for Hosts
- Consider adopting a Flexible policy to align with the 44.4% market standard in Marval.
- Using a Strict policy might deter some guests, as only 11.1% of listings use it. Evaluate if potential revenue protection outweighs possible lower booking rates.
- Regularly review your cancellation policy against competitors and market demand shifts in Marval.
Marval STR Booking Lead Time Analysis (2026)
Average Booking Lead Time by Month
Booking Lead Time Insights for Marval
- The overall average booking lead time for vacation rentals in Marval is 69 days.
- Guests book furthest in advance for stays during August (average 120 days), likely coinciding with peak travel demand or local events.
- The shortest booking windows occur for stays in January (average 12 days), indicating more last-minute travel plans during this time.
- Seasonally, Summer (91 days avg.) sees the longest lead times, while Winter (21 days avg.) has the shortest, reflecting typical travel planning cycles.
Recommendations for Hosts
- Use the overall average lead time (69 days) as a baseline for your pricing and availability strategy in Marval.
- For August stays, consider implementing length-of-stay discounts or slightly higher rates for bookings made less than 120 days out to capitalize on advance planning.
- During January, focus on last-minute booking availability and promotions, as guests book with very short notice (12 days avg.).
- Target marketing efforts for the Summer season well in advance (at least 91 days) to capture early planners.
- Monitor your own booking lead times against these Marval averages to identify opportunities for dynamic pricing adjustments.
Popular & Essential Airbnb Amenities in Marval (2026)
Amenity Prevalence
Amenity Insights for Marval
- Essential amenities in Marval that guests expect include: Free parking on premises. Lacking these (this) could significantly impact bookings.
- Popular amenities like Kitchen, Hot water, Refrigerator are common but not universal. Offering these can provide a competitive edge.
Recommendations for Hosts
- Ensure your listing includes all essential amenities for Marval: Free parking on premises.
- Consider adding popular differentiators like Kitchen or Hot water to increase appeal.
- Highlight unique or less common amenities you offer (e.g., hot tub, dedicated workspace, EV charger) in your listing description and photos.
- Regularly check competitor amenities in Marval to stay competitive.
Marval Airbnb Guest Demographics & Profile Analysis (2026)
Guest Profile Summary for Marval
- The typical guest profile for Airbnb in Marval consists of a mix of domestic (63%) and international guests, often arriving from nearby Paris, typically belonging to the Post-2000s (Gen Z/Alpha) group (50%), primarily speaking English or French.
- Domestic travelers account for 62.9% of guests.
- Key international markets include France (62.9%) and Netherlands (11.2%).
- Top languages spoken are English (36.7%) followed by French (25.3%).
- A significant demographic segment is the Post-2000s (Gen Z/Alpha) group, representing 50% of guests.
Recommendations for Hosts
- Target domestic marketing efforts towards travelers from Paris and Bordeaux.
- Tailor amenities and listing descriptions to appeal to the dominant Post-2000s (Gen Z/Alpha) demographic (e.g., highlight fast WiFi, smart home features, local guides).
- Highlight unique local experiences or amenities relevant to the primary guest profile.
- Consider seasonal promotions aligned with peak travel times for key origin markets.
Nearby Short-Term Rental Market Comparison
How does the Marval Airbnb market stack up against its neighbors? Compare key performance metrics like average monthly revenue, ADR, and occupancy rates in surrounding areas to understand the broader regional STR landscape.
| Market | Active Properties | Monthly Revenue | Daily Rate | Avg. Occupancy |
|---|---|---|---|---|
| Carignan-de-Bordeaux | 34 | $3,140 | $316.66 | 42% |
| Néac | 11 | $3,047 | $441.32 | 38% |
| Bourrou | 10 | $2,788 | $294.83 | 35% |
| Bourneau | 11 | $2,771 | $407.54 | 30% |
| Eynesse | 13 | $2,664 | $331.30 | 37% |
| Vouhé | 10 | $2,634 | $316.94 | 34% |
| Cénac | 17 | $2,542 | $307.76 | 44% |
| Saint-Seurin-de-Cadourne | 12 | $2,529 | $378.76 | 33% |
| Chaunay | 10 | $2,409 | $178.56 | 41% |
| La Dornac | 10 | $2,407 | $288.14 | 32% |