Nages Airbnb Market Analysis 2026: Short Term Rental Data & Vacation Rental Statistics in Occitania, France
Is Airbnb profitable in Nages in 2026? Explore comprehensive Airbnb analytics for Nages, Occitania, France to uncover income potential. This 2026 STR market report for Nages, based on AirROI data from September 2024 to August 2025, reveals key trends in the niche market of 18 active listings.
Whether you're considering an Airbnb investment in Nages, optimizing your existing vacation rental, or exploring rental arbitrage opportunities, understanding the Nages Airbnb data is crucial. Leveraging the low regulation environment is key to maximizing your short term rental income potential. Let's dive into the specifics.
Key Nages Airbnb Performance Metrics Overview
Monthly Airbnb Revenue Variations & Income Potential in Nages (2026)
Understanding the monthly revenue variations for Airbnb listings in Nages is key to maximizing your short term rental income potential. Seasonality significantly impacts earnings. Our analysis, based on data from the past 12 months, shows that the peak revenue month for STRs in Nages is typically August, while April often presents the lowest earnings, highlighting opportunities for strategic pricing adjustments during shoulder and low seasons. Explore the typical Airbnb income in Nages across different performance tiers:
- Best-in-class properties (Top 10%) achieve $2,186+ monthly, often utilizing dynamic pricing and superior guest experiences.
- Strong performing properties (Top 25%) earn $1,480 or more, indicating effective management and desirable locations/amenities.
- Typical properties (Median) generate around $743 per month, representing the average market performance.
- Entry-level properties (Bottom 25%) see earnings around $384, often with potential for optimization.
Average Monthly Airbnb Earnings Trend in Nages
Nages Airbnb Occupancy Rate Trends (2026)
Maximize your bookings by understanding the Nages STR occupancy trends. Seasonal demand shifts significantly influence how often properties are booked. Typically, Augustsees the highest demand (peak season occupancy), while June experiences the lowest (low season). Effective strategies, like adjusting minimum stays or offering promotions, can boost occupancy during slower periods. Here's how different property tiers perform in Nages:
- Best-in-class properties (Top 10%) achieve 71%+ occupancy, indicating high desirability and potentially optimized availability.
- Strong performing properties (Top 25%) maintain 43% or higher occupancy, suggesting good market fit and guest satisfaction.
- Typical properties (Median) have an occupancy rate around 22%.
- Entry-level properties (Bottom 25%) average 14% occupancy, potentially facing higher vacancy.
Average Monthly Occupancy Rate Trend in Nages
Average Daily Rate (ADR) Airbnb Trends in Nages (2026)
Effective short term rental pricing strategy in Nages involves understanding monthly ADR fluctuations. The Average Daily Rate (ADR) for Airbnb in Nages typically peaks in August and dips lowest during March. Leveraging Airbnb dynamic pricing tools or strategies based on this seasonality can significantly boost revenue. Here's a look at the typical nightly rates achieved:
- Best-in-class properties (Top 10%) command rates of $148+ per night, often due to premium features or locations.
- Strong performing properties (Top 25%) achieve nightly rates of $131 or more.
- Typical properties (Median) charge around $97 per night.
- Entry-level properties (Bottom 25%) earn around $76 per night.
Average Daily Rate (ADR) Trend by Month in Nages
Get Live Nages Market Intelligence 👇

Explore Real-time Analytics
Airbnb Seasonality Analysis & Trends in Nages (2025)
Peak Season (August, September, December)
- Revenue averages $1,589 per month
- Occupancy rates average 43.9%
- Daily rates average $119
Shoulder Season
- Revenue averages $996 per month
- Occupancy maintains around 30.7%
- Daily rates hold near $117
Low Season (February, April, June)
- Revenue drops to average $624 per month
- Occupancy decreases to average 19.6%
- Daily rates adjust to average $121
Seasonality Insights for Nages
- The Airbnb seasonality in Nages shows highly seasonal trends requiring careful strategy. While the sections above show seasonal averages, it's also insightful to look at the extremes:
- During the high season, the absolute peak month showcases Nages's highest earning potential, with monthly revenues capable of climbing to $1,744, occupancy reaching a high of 47.0%, and ADRs peaking at $139.
- Conversely, the slowest single month of the year, typically falling within the low season, marks the market's lowest point. In this month, revenue might dip to $586, occupancy could drop to 16.7%, and ADRs may adjust down to $107.
- Understanding both the seasonal averages and these monthly peaks and troughs in revenue, occupancy, and ADR is crucial for maximizing your Airbnb profit potential in Nages.
Seasonal Strategies for Maximizing Profit
- Peak Season: Maximize revenue through premium pricing and potentially longer minimum stays. Ensure high availability.
- Low Season: Offer competitive pricing, special promotions (e.g., extended stay discounts), and flexible cancellation policies. Target off-season travelers like remote workers or budget-conscious guests.
- Shoulder Seasons: Implement dynamic pricing that balances peak and low rates. Target weekend travelers or specific events. Offer slightly more flexible terms than peak season.
- Regularly analyze your own performance against these Nages seasonality benchmarks and adjust your pricing and availability strategy accordingly.
Best Areas for Airbnb Investment in Nages (2026)
Exploring the top neighborhoods for short-term rentals in Nages? This section highlights key areas, outlining why they are attractive for hosts and guests, along with notable local attractions. Consider these locations based on your target guest profile and investment strategy.
| Neighborhood / Area | Why Host Here? (Target Guests & Appeal) | Key Attractions & Landmarks |
|---|---|---|
| Toulouse City Center | The vibrant heart of Toulouse, packed with cafes, historical sites, and a lively atmosphere. Perfect for tourists wanting to experience the culture and charm of the city. | Place du Capitole, Basilique Saint-Sernin, Cité de l'Espace, Capitole de Toulouse, Garonne River Walk |
| Cap d'Agde | A well-known seaside resort with beautiful beaches and a variety of recreational activities. Great choice for families and beach lovers. | Cap d'Agde Beach, Aqualand Cap d'Agde, Fort de Brescou, Port de Cap d'Agde, Golf International |
| Carcassonne | Famous for its medieval fortress, Carcassonne attracts history enthusiasts and tourists seeking a unique cultural experience in a UNESCO World Heritage site. | Cité de Carcassonne, Château Comtal, Pont Vieux, Basilique Saint-Nazaire, Carcassonne Festival |
| Albi | Known for its stunning red-brick architecture and the Albi Cathedral, this town draws visitors interested in art and history. | Cathedral of Albi, Palais de la Berbie, Toulouse-Lautrec Museum, St. Cécile Cathedral, Pont Vieux |
| Montpellier City Center | A lively university city with a young population, Montpellier offers rich culture, shopping, and dining. Attracts both students and tourists. | Place de la Comédie, Montpellier Zoo, Musée Fabre, Promenade du Peyrou, Historical center |
| Larzac | A stunning natural region offering beautiful landscapes and outdoor activities, ideal for nature lovers looking for a peaceful getaway. | Larzac Plateau, Vineyards, Hiking Trails, Prairie de l'Aubrac, Historical Sites |
| Sète | Known for its canals, Sète is a picturesque town that attracts visitors looking for a seaside retreat with a local seafood cuisine. | Canal de Sète, Mont Saint-Clair, Théâtre de la Mer, Les Halles, Beaches |
| Cévennes National Park | An ideal destination for those loving nature and adventure, providing hiking, camping, and stunning vistas. | Cévennes National Park, Mont Lozère, River Canoeing, Villages |
Understanding Airbnb License Requirements & STR Laws in Nages (2026)
While Nages, Occitania, France currently shows low STR regulations, specific Airbnb license requirements might still exist or change. Always verify the latest short term rental regulations and Airbnb license requirements directly with local government authorities for Nages to ensure full compliance before hosting.
(Source: AirROI data, 2026, finding no licensed listings among those analyzed)
Top Performing Airbnb Properties in Nages (2026)
Benchmark your potential! Explore examples of top-performing Airbnb properties in Nagesbased on Trailing Twelve Month (TTM) revenue. Analyze their characteristics, revenue, occupancy rate, and ADR to understand what drives success in this market.

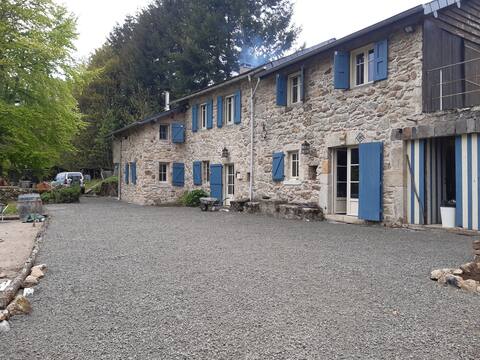
Maison de Rouayras
Entire Place • 5 bedrooms

Authentic and modern Martinoles cottages
Entire Place • 3 bedrooms
FORMER SHEEPFOLD NESTLED ON A PENINSULA.
Entire Place • 4 bedrooms

the lake house
Entire Place • 3 bedrooms

cozy house between lake and forest
Entire Place • 3 bedrooms

House 6 people
Entire Place • 3 bedrooms
Note: Performance varies based on location, size, amenities, seasonality, and management quality. Data reflects the past 12 months.
Top Performing Airbnb Hosts in Nages (2026)
Learn from the best! This table showcases top-performing Airbnb hosts in Nages based on the number of properties managed and estimated total revenue over the past year. Analyze their scale and performance metrics.
| Host Name | Properties | Grossing Revenue | Stay Reviews | Avg Rating |
|---|---|---|---|---|
| Jean Luc | 2 | $22,320 | 73 | 4.64/5.0 |
| Jessica | 1 | $19,146 | 83 | 4.98/5.0 |
| Richard | 1 | $16,391 | 11 | 5.00/5.0 |
| Julian | 1 | $14,482 | 7 | 5.00/5.0 |
| Magali | 1 | $8,496 | 16 | 4.81/5.0 |
| Fabienne | 1 | $8,305 | 23 | 4.74/5.0 |
| Steve | 2 | $6,891 | 93 | 4.81/5.0 |
| LaCanal | 3 | $5,989 | 12 | 4.50/5.0 |
| Céline | 1 | $5,635 | 38 | 4.53/5.0 |
| Rachel | 1 | $3,998 | 8 | 4.50/5.0 |
Analyzing the strategies of top hosts, such as their property selection, pricing, and guest communication, can offer valuable lessons for optimizing your own Airbnb operations in Nages.
Dive Deeper: Advanced Nages STR Market Data (2026)
Ready to unlock more insights? AirROI provides access to advanced metrics and comprehensive Airbnb data for Nages. Explore detailed analytics beyond this report to refine your investment strategy, optimize pricing, and maximize your vacation rental profits.
Explore Advanced MetricsNages Short-Term Rental Market Composition (2026): Property & Room Types
Room Type Distribution
Property Type Distribution
Market Composition Insights for Nages
- The Nages Airbnb market composition is heavily skewed towards Entire Home/Apt listings, which make up 94.4% of the 18 active rentals. This indicates strong guest preference for privacy and space.
- Looking at the property type distribution in Nages, House properties are the most common (66.7%), reflecting the local real estate landscape.
- Houses represent a significant 66.7% portion, catering likely to families or larger groups.
Nages Airbnb Room Capacity Analysis (2026): Bedroom Distribution
Distribution of Listings by Number of Bedrooms
Room Capacity Insights for Nages
- The dominant room capacity in Nages is 3 bedrooms listings, making up 38.9% of the market. This suggests a strong demand for properties suitable for families or small groups.
- Together, 3 bedrooms and 2 bedrooms properties represent 77.8% of the active Airbnb listings in Nages, indicating a high concentration in these sizes.
- A significant 55.6% of listings offer 3+ bedrooms, catering to larger groups and families seeking more space in Nages.
Nages Vacation Rental Guest Capacity Trends (2026)
Distribution of Listings by Guest Capacity
Guest Capacity Insights for Nages
- The most common guest capacity trend in Nages vacation rentals is listings accommodating 6 guests (33.3%). This suggests the primary traveler segment is likely larger groups.
- Properties designed for 6 guests and 5 guests dominate the Nages STR market, accounting for 61.1% of listings.
- 55.5% of properties accommodate 6+ guests, serving the market segment for larger families or group travel in Nages.
- On average, properties in Nages are equipped to host 5.5 guests.
Nages Airbnb Booking Patterns (2026): Available vs. Booked Days
Available Days Distribution
Booked Days Distribution
Booking Pattern Insights for Nages
- The most common availability pattern in Nages falls within the 271-366 days range, representing 72.2% of listings. This suggests many properties have significant open periods on their calendars.
- Approximately 100.0% of listings show high availability (181+ days open annually), indicating potential for increased bookings or specific owner usage patterns.
- For booked days, the 1-30 days range is most frequent in Nages (38.9%), reflecting common guest stay durations or potential owner blocking patterns.
Nages Airbnb Minimum Stay Requirements Analysis
Distribution of Listings by Minimum Night Requirement
1 Night
3 listings
17.6% of total
2 Nights
1 listings
5.9% of total
3 Nights
1 listings
5.9% of total
4-6 Nights
1 listings
5.9% of total
7-29 Nights
2 listings
11.8% of total
30+ Nights
9 listings
52.9% of total
Key Insights
- The most prevalent minimum stay requirement in Nages is 30+ Nights, adopted by 52.9% of listings. This highlights the market's preference for longer commitments.
- A significant segment (52.9%) caters to monthly stays (30+ nights) in Nages, pointing to opportunities in the extended-stay market.
Recommendations
- Align with the market by considering a 30+ Nights minimum stay, as 52.9% of Nages hosts use this setting.
- If feasible, allowing 1-night stays, especially midweek or during low season, could capture last-minute bookings, as only 17.6% currently do.
- Explore offering discounts for stays of 30+ nights to attract the 52.9% of the market seeking extended stays.
- Adjust minimum nights based on seasonality – potentially shorter during low season and longer during peak demand periods in Nages.
Nages Airbnb Cancellation Policy Trends Analysis (2026)
Flexible
3 listings
17.6% of total
Moderate
5 listings
29.4% of total
Firm
3 listings
17.6% of total
Strict
6 listings
35.3% of total
Cancellation Policy Insights for Nages
- The prevailing Airbnb cancellation policy trend in Nages is Strict, used by 35.3% of listings.
- A majority (52.9%) of hosts in Nages utilize Firm or Strict policies, indicating a market where hosts prioritize booking security.
Recommendations for Hosts
- Consider adopting a Strict policy to align with the 35.3% market standard in Nages.
- With 35.3% using Strict terms, this is a viable option in Nages, particularly for high-value properties or during peak demand periods.
- Regularly review your cancellation policy against competitors and market demand shifts in Nages.
Nages STR Booking Lead Time Analysis (2026)
Average Booking Lead Time by Month
Booking Lead Time Insights for Nages
- The overall average booking lead time for vacation rentals in Nages is 49 days.
- Guests book furthest in advance for stays during July (average 130 days), likely coinciding with peak travel demand or local events.
- The shortest booking windows occur for stays in September (average 27 days), indicating more last-minute travel plans during this time.
- Seasonally, Summer (92 days avg.) sees the longest lead times, while Fall (30 days avg.) has the shortest, reflecting typical travel planning cycles.
Recommendations for Hosts
- Use the overall average lead time (49 days) as a baseline for your pricing and availability strategy in Nages.
- For July stays, consider implementing length-of-stay discounts or slightly higher rates for bookings made less than 130 days out to capitalize on advance planning.
- Target marketing efforts for the Summer season well in advance (at least 92 days) to capture early planners.
- Monitor your own booking lead times against these Nages averages to identify opportunities for dynamic pricing adjustments.
Popular & Essential Airbnb Amenities in Nages (2026)
Amenity Prevalence
Amenity Insights for Nages
- Essential amenities in Nages that guests expect include: Free parking on premises, Kitchen. Lacking these (any) could significantly impact bookings.
- Popular amenities like Dishes and silverware, Washer, Heating are common but not universal. Offering these can provide a competitive edge.
Recommendations for Hosts
- Ensure your listing includes all essential amenities for Nages: Free parking on premises, Kitchen.
- Consider adding popular differentiators like Dishes and silverware or Washer to increase appeal.
- Highlight unique or less common amenities you offer (e.g., hot tub, dedicated workspace, EV charger) in your listing description and photos.
- Regularly check competitor amenities in Nages to stay competitive.
Nages Airbnb Guest Demographics & Profile Analysis (2026)
Guest Profile Summary for Nages
- The typical guest profile for Airbnb in Nages consists of primarily domestic travelers (86%), often arriving from nearby Montpellier, typically belonging to the Post-2000s (Gen Z/Alpha) group (50%), primarily speaking French or English.
- Domestic travelers account for 86.4% of guests.
- Key international markets include France (86.4%) and Spain (4.5%).
- Top languages spoken are French (41.5%) followed by English (34.1%).
- A significant demographic segment is the Post-2000s (Gen Z/Alpha) group, representing 50% of guests.
Recommendations for Hosts
- Target domestic marketing efforts towards travelers from Montpellier and Sète.
- Tailor amenities and listing descriptions to appeal to the dominant Post-2000s (Gen Z/Alpha) demographic (e.g., highlight fast WiFi, smart home features, local guides).
- Highlight unique local experiences or amenities relevant to the primary guest profile.
- Consider seasonal promotions aligned with peak travel times for key origin markets.
Nearby Short-Term Rental Market Comparison
How does the Nages Airbnb market stack up against its neighbors? Compare key performance metrics like average monthly revenue, ADR, and occupancy rates in surrounding areas to understand the broader regional STR landscape.
| Market | Active Properties | Monthly Revenue | Daily Rate | Avg. Occupancy |
|---|---|---|---|---|
| Cornellà del Terri | 17 | $4,835 | $510.51 | 35% |
| Amer | 11 | $4,780 | $474.73 | 35% |
| Villeneuvette | 13 | $4,456 | $361.99 | 46% |
| la Baronia de Rialb | 16 | $4,310 | $419.89 | 43% |
| Porqueres | 14 | $3,896 | $478.96 | 29% |
| Vilanant | 12 | $3,648 | $385.62 | 29% |
| Vilademuls | 20 | $3,307 | $357.79 | 37% |
| Rupià | 10 | $3,295 | $289.37 | 42% |
| Sant Ferriol | 18 | $3,126 | $309.35 | 43% |
| Bàscara | 13 | $3,108 | $539.75 | 36% |