Nîmes Airbnb Market Analysis 2026: Short Term Rental Data & Vacation Rental Statistics in Occitanie, France
Is Airbnb profitable in Nîmes in 2026? Explore comprehensive Airbnb analytics for Nîmes, Occitanie, France to uncover income potential. This 2026 STR market report for Nîmes, based on AirROI data from February 2025 to January 2026, reveals key trends in the niche market of 166 active listings.
Whether you're considering an Airbnb investment in Nîmes, optimizing your existing vacation rental, or exploring rental arbitrage opportunities, understanding the Nîmes Airbnb data is crucial. Navigating the high regulation landscape is key to maximizing your short term rental income potential. Let's dive into the specifics.
Key Nîmes Airbnb Performance Metrics Overview
Monthly Airbnb Revenue Variations & Income Potential in Nîmes (2026)
Understanding the monthly revenue variations for Airbnb listings in Nîmes is key to maximizing your short term rental income potential. Seasonality significantly impacts earnings. Our analysis, based on data from the past 12 months, shows that the peak revenue month for STRs in Nîmes is typically August, while May often presents the lowest earnings, highlighting opportunities for strategic pricing adjustments during shoulder and low seasons. Explore the typical Airbnb income in Nîmes across different performance tiers:
- Best-in-class properties (Top 10%) achieve $2,963+ monthly, often utilizing dynamic pricing and superior guest experiences.
- Strong performing properties (Top 25%) earn $1,711 or more, indicating effective management and desirable locations/amenities.
- Typical properties (Median) generate around $996 per month, representing the average market performance.
- Entry-level properties (Bottom 25%) see earnings around $534, often with potential for optimization.
Average Monthly Airbnb Earnings Trend in Nîmes
Nîmes Airbnb Occupancy Rate Trends (2026)
Maximize your bookings by understanding the Nîmes STR occupancy trends. Seasonal demand shifts significantly influence how often properties are booked. Typically, Augustsees the highest demand (peak season occupancy), while May experiences the lowest (low season). Effective strategies, like adjusting minimum stays or offering promotions, can boost occupancy during slower periods. Here's how different property tiers perform in Nîmes:
- Best-in-class properties (Top 10%) achieve 70%+ occupancy, indicating high desirability and potentially optimized availability.
- Strong performing properties (Top 25%) maintain 54% or higher occupancy, suggesting good market fit and guest satisfaction.
- Typical properties (Median) have an occupancy rate around 34%.
- Entry-level properties (Bottom 25%) average 19% occupancy, potentially facing higher vacancy.
Average Monthly Occupancy Rate Trend in Nîmes
Average Daily Rate (ADR) Airbnb Trends in Nîmes (2026)
Effective short term rental pricing strategy in Nîmes involves understanding monthly ADR fluctuations. The Average Daily Rate (ADR) for Airbnb in Nîmes typically peaks in September and dips lowest during January. Leveraging Airbnb dynamic pricing tools or strategies based on this seasonality can significantly boost revenue. Here's a look at the typical nightly rates achieved:
- Best-in-class properties (Top 10%) command rates of $252+ per night, often due to premium features or locations.
- Strong performing properties (Top 25%) achieve nightly rates of $143 or more.
- Typical properties (Median) charge around $90 per night.
- Entry-level properties (Bottom 25%) earn around $65 per night.
Average Daily Rate (ADR) Trend by Month in Nîmes
Get Live Nîmes Market Intelligence 👇
Explore Real-time Analytics
Airbnb Seasonality Analysis & Trends in Nîmes (2026)
Peak Season (August, June, July)
- Revenue averages $1,909 per month
- Occupancy rates average 45.7%
- Daily rates average $129
Shoulder Season
- Revenue averages $1,128 per month
- Occupancy maintains around 32.9%
- Daily rates hold near $128
Low Season (February, March, April)
- Revenue drops to average $0 per month
- Occupancy decreases to average 0.0%
- Daily rates adjust to average $131
Seasonality Insights for Nîmes
- The Airbnb seasonality in Nîmes shows highly seasonal trends requiring careful strategy. While the sections above show seasonal averages, it's also insightful to look at the extremes:
- During the high season, the absolute peak month showcases Nîmes's highest earning potential, with monthly revenues capable of climbing to $2,078, occupancy reaching a high of 49.7%, and ADRs peaking at $142.
- Conversely, the slowest single month of the year, typically falling within the low season, marks the market's lowest point. In this month, revenue might dip to $0, occupancy could drop to 0.0%, and ADRs may adjust down to $120.
- Understanding both the seasonal averages and these monthly peaks and troughs in revenue, occupancy, and ADR is crucial for maximizing your Airbnb profit potential in Nîmes.
Seasonal Strategies for Maximizing Profit
- Peak Season: Maximize revenue through premium pricing and potentially longer minimum stays. Ensure high availability.
- Low Season: Offer competitive pricing, special promotions (e.g., extended stay discounts), and flexible cancellation policies. Target off-season travelers like remote workers or budget-conscious guests.
- Shoulder Seasons: Implement dynamic pricing that balances peak and low rates. Target weekend travelers or specific events. Offer slightly more flexible terms than peak season.
- Regularly analyze your own performance against these Nîmes seasonality benchmarks and adjust your pricing and availability strategy accordingly.
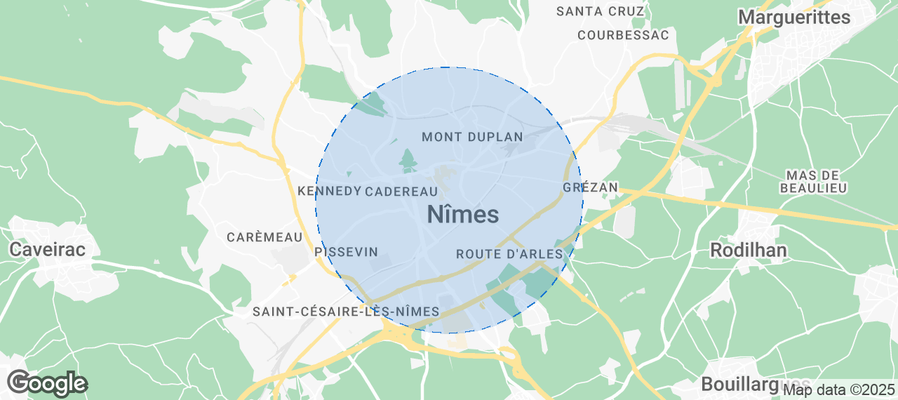
Best Areas for Airbnb Investment in Nîmes (2026)
Exploring the top neighborhoods for short-term rentals in Nîmes? This section highlights key areas, outlining why they are attractive for hosts and guests, along with notable local attractions. Consider these locations based on your target guest profile and investment strategy.
| Neighborhood / Area | Why Host Here? (Target Guests & Appeal) | Key Attractions & Landmarks |
|---|---|---|
| Old Town Nîmes | Historic center with stunning Roman architecture and vibrant atmosphere. A hotspot for tourists exploring the rich history and culture of Nîmes, close to major attractions. | Roman Amphitheater, Maison Carrée, Jardins de la Fontaine, Temple de Diane, Carré d'Art, Les Halles |
| La Placette | Charming neighborhood known for its local markets and cafés. Offers a more authentic experience of Nîmes, popular among visitors who prefer a quieter, local vibe. | Local markets, Cafés and bistros, Street art, Nearby parks, Cultural events |
| Les Jardins | Beautiful neighborhood with parks and green spaces, ideal for families and travelers looking for a serene environment while still close to city attractions. | Jardins de la Fontaine, Parc de la Calade, Outdoor markets, Walking paths, Playgrounds |
| Costières | A residential area known for its proximity to the Nîmes stadium and sports facilities. Perfect for sports fans and visitors during major events. | Stade des Costières, Local sports events, Wine-tasting tours, Proximity to major roads |
| Pont du Gard | Famous for the Roman aqueduct bridge, a UNESCO World Heritage site attracting many tourists. Ideal for those looking to combine history and nature. | Pont du Gard, Hiking trails, Picnic areas, Guided tours, Nearby vineyards |
| Carré d'Art | Modern area known for its contemporary art museum and architecture. Appeals to art lovers and those interested in modern culture. | Carré d'Art Museum, Contemporary art exhibits, Cultural events, Cafés, Riverside walks |
| Nîmes East | Developing area with new amenities and good access to public transport. Merging modern living with easy city access for visitors. | Shopping centers, Public parks, Local restaurants, Cultural venues |
| Mas de Ville | Residential area with a community vibe, offering peace and quick access to major attractions. Suitable for families and longer-term stays. | Family-friendly parks, Local shops, Quiet streets, Cultural festivals |
Understanding Airbnb License Requirements & STR Laws in Nîmes (2026)
Yes, Nîmes, Occitanie, France enforces high STR regulations. Obtaining a license and ensuring compliance is almost certainly required according to current 2026 STR laws. Always verify the latest short term rental regulations and Airbnb license requirements directly with local government authorities for Nîmes to ensure full compliance before hosting.
(Source: AirROI data, 2026, based on 82% licensed listings)
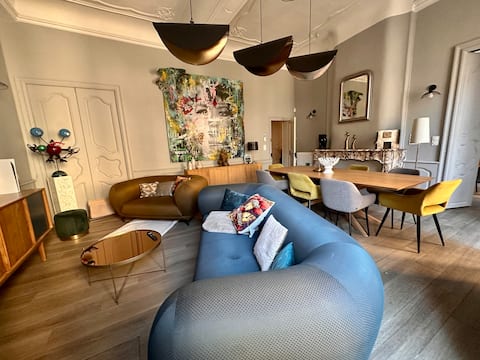
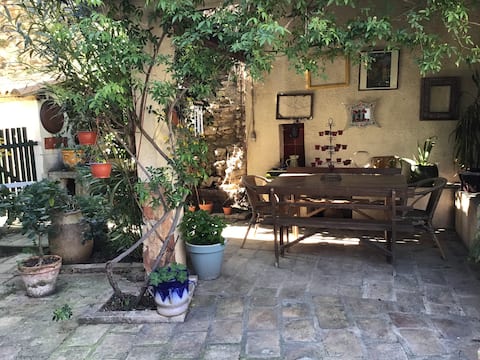
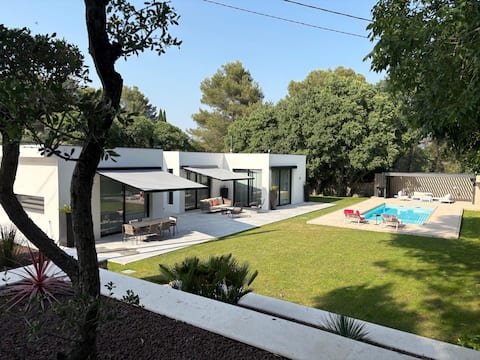
Top Performing Airbnb Properties in Nîmes (2026)
Benchmark your potential! Explore examples of top-performing Airbnb properties in Nîmesbased on Trailing Twelve Month (TTM) revenue. Analyze their characteristics, revenue, occupancy rate, and ADR to understand what drives success in this market.

Fables from the Jardin de la Fontaine
Entire Place • 2 bedrooms
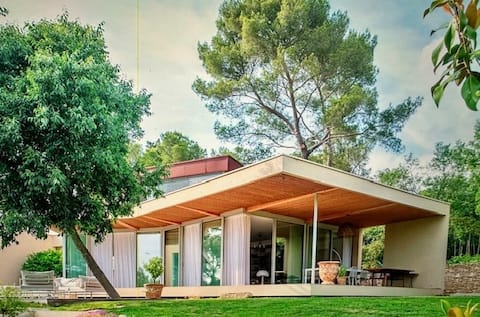
Beautiful Architect-Designed Villa
Entire Place • 4 bedrooms
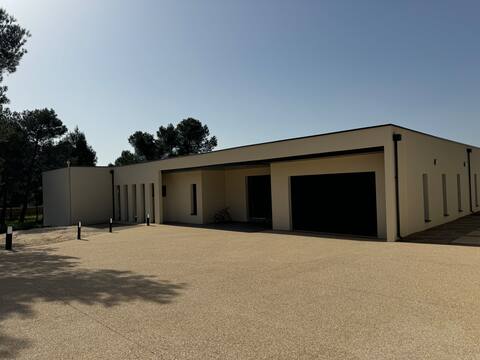
Villa, spacious
Entire Place • 4 bedrooms
Premium Location – Air Conditioned & Free Parking
Entire Place • 3 bedrooms
Houses, pool, private parking, large family
Entire Place • 2 bedrooms
Beautiful architect-designed villa
Entire Place • 5 bedrooms
Note: Performance varies based on location, size, amenities, seasonality, and management quality. Data reflects the past 12 months.
Top Performing Airbnb Hosts in Nîmes (2026)
Learn from the best! This table showcases top-performing Airbnb hosts in Nîmes based on the number of properties managed and estimated total revenue over the past year. Analyze their scale and performance metrics.
| Host Name | Properties | Grossing Revenue | Stay Reviews | Avg Rating |
|---|---|---|---|---|
| WelcomeHost | 9 | $86,062 | 171 | 4.71/5.0 |
| Ad | 8 | $63,600 | 150 | 4.29/5.0 |
| Charlotte | 5 | $52,176 | 128 | 4.84/5.0 |
| Victor | 1 | $41,964 | 25 | 4.32/5.0 |
| Emmanuel | 1 | $32,222 | 1 | Not Rated |
| Yohan | 2 | $30,451 | 195 | 4.97/5.0 |
| Larbi | 1 | $29,400 | 4 | 4.00/5.0 |
| Coralie | 1 | $28,195 | 33 | 4.88/5.0 |
| Sue | 1 | $27,250 | 1 | Not Rated |
| Stephane | 1 | $26,135 | 1 | Not Rated |
Analyzing the strategies of top hosts, such as their property selection, pricing, and guest communication, can offer valuable lessons for optimizing your own Airbnb operations in Nîmes.
Dive Deeper: Advanced Nîmes STR Market Data (2026)
Ready to unlock more insights? AirROI provides access to advanced metrics and comprehensive Airbnb data for Nîmes. Explore detailed analytics beyond this report to refine your investment strategy, optimize pricing, and maximize your vacation rental profits.
Explore Advanced MetricsNîmes Short-Term Rental Market Composition (2026): Property & Room Types
Room Type Distribution
Property Type Distribution
Market Composition Insights for Nîmes
- The Nîmes Airbnb market composition is heavily skewed towards Entire Home/Apt listings, which make up 96.4% of the 166 active rentals. This indicates strong guest preference for privacy and space.
- Looking at the property type distribution in Nîmes, Apartment/Condo properties are the most common (74.7%), reflecting the local real estate landscape.
- Houses represent a significant 21.7% portion, catering likely to families or larger groups.
- Smaller segments like outdoor/unique, hotel/boutique, others (combined 3.6%) offer potential for unique stay experiences.
Nîmes Airbnb Room Capacity Analysis (2026): Bedroom Distribution
Distribution of Listings by Number of Bedrooms
Room Capacity Insights for Nîmes
- The dominant room capacity in Nîmes is 1 bedroom listings, making up 44% of the market. This suggests a strong demand for properties suitable for couples or solo travelers.
- Together, 1 bedroom and 2 bedrooms properties represent 68.1% of the active Airbnb listings in Nîmes, indicating a high concentration in these sizes.
Nîmes Vacation Rental Guest Capacity Trends (2026)
Distribution of Listings by Guest Capacity
Guest Capacity Insights for Nîmes
- The most common guest capacity trend in Nîmes vacation rentals is listings accommodating 2 guests (39.2%). This suggests the primary traveler segment is likely couples or solo travelers.
- Properties designed for 2 guests and 4 guests dominate the Nîmes STR market, accounting for 62.7% of listings.
- 20.4% of properties accommodate 6+ guests, serving the market segment for larger families or group travel in Nîmes.
- On average, properties in Nîmes are equipped to host 3.7 guests.
Nîmes Airbnb Booking Patterns (2026): Available vs. Booked Days
Available Days Distribution
Booked Days Distribution
Booking Pattern Insights for Nîmes
- The most common availability pattern in Nîmes falls within the 271-366 days range, representing 74.1% of listings. This suggests many properties have significant open periods on their calendars.
- Approximately 98.2% of listings show high availability (181+ days open annually), indicating potential for increased bookings or specific owner usage patterns.
- For booked days, the 31-90 days range is most frequent in Nîmes (54.8%), reflecting common guest stay durations or potential owner blocking patterns.
- A notable 1.8% of properties secure long booking periods (181+ days booked per year), highlighting successful long-term rental strategies or significant owner usage.
Nîmes Airbnb Minimum Stay Requirements Analysis
Distribution of Listings by Minimum Night Requirement
1 Night
62 listings
37.3% of total
2 Nights
29 listings
17.5% of total
3 Nights
2 listings
1.2% of total
4-6 Nights
9 listings
5.4% of total
7-29 Nights
7 listings
4.2% of total
30+ Nights
57 listings
34.3% of total
Key Insights
- The most prevalent minimum stay requirement in Nîmes is 1 Night, adopted by 37.3% of listings. This highlights the market's preference for shorter, flexible bookings.
- A significant segment (34.3%) caters to monthly stays (30+ nights) in Nîmes, pointing to opportunities in the extended-stay market.
Recommendations
- Align with the market by considering a 1 Night minimum stay, as 37.3% of Nîmes hosts use this setting.
- Explore offering discounts for stays of 30+ nights to attract the 34.3% of the market seeking extended stays.
- Adjust minimum nights based on seasonality – potentially shorter during low season and longer during peak demand periods in Nîmes.
Nîmes Airbnb Cancellation Policy Trends Analysis (2026)
Limited
4 listings
2.4% of total
Flexible
56 listings
33.7% of total
Moderate
54 listings
32.5% of total
Firm
41 listings
24.7% of total
Strict
11 listings
6.6% of total
Cancellation Policy Insights for Nîmes
- The prevailing Airbnb cancellation policy trend in Nîmes is Flexible, used by 33.7% of listings.
- There's a relatively balanced mix between guest-friendly (66.2%) and stricter (31.3%) policies, offering choices for different guest needs.
- Strict cancellation policies are quite rare (6.6%), potentially making listings with this policy less competitive unless justified by high demand or property type.
Recommendations for Hosts
- Consider adopting a Flexible policy to align with the 33.7% market standard in Nîmes.
- Using a Strict policy might deter some guests, as only 6.6% of listings use it. Evaluate if potential revenue protection outweighs possible lower booking rates.
- Regularly review your cancellation policy against competitors and market demand shifts in Nîmes.
Nîmes STR Booking Lead Time Analysis (2026)
Average Booking Lead Time by Month
Booking Lead Time Insights for Nîmes
- The overall average booking lead time for vacation rentals in Nîmes is 20 days.
- Guests book furthest in advance for stays during September (average 34 days), likely coinciding with peak travel demand or local events.
- The shortest booking windows occur for stays in April (average 0 days), indicating more last-minute travel plans during this time.
- Seasonally, Fall (26 days avg.) sees the longest lead times, while Spring (1 days avg.) has the shortest, reflecting typical travel planning cycles.
Recommendations for Hosts
- Use the overall average lead time (20 days) as a baseline for your pricing and availability strategy in Nîmes.
- For September stays, consider implementing length-of-stay discounts or slightly higher rates for bookings made less than 34 days out to capitalize on advance planning.
- During April, focus on last-minute booking availability and promotions, as guests book with very short notice (0 days avg.).
- Target marketing efforts for the Fall season well in advance (at least 26 days) to capture early planners.
- Monitor your own booking lead times against these Nîmes averages to identify opportunities for dynamic pricing adjustments.
Popular & Essential Airbnb Amenities in Nîmes (2026)
Amenity Prevalence
Amenity Insights for Nîmes
- Popular amenities like Kitchen, Wifi, TV are common but not universal. Offering these can provide a competitive edge.
- Warning: Wifi is not universally provided but is considered essential globally. Ensure reliable Wifi is offered.
Recommendations for Hosts
- Consider adding popular differentiators like Kitchen or Wifi to increase appeal.
- Highlight unique or less common amenities you offer (e.g., hot tub, dedicated workspace, EV charger) in your listing description and photos.
- Regularly check competitor amenities in Nîmes to stay competitive.
Nîmes Airbnb Guest Demographics & Profile Analysis (2026)
Guest Profile Summary for Nîmes
- The typical guest profile for Airbnb in Nîmes consists of primarily domestic travelers (74%), often arriving from nearby Paris, typically belonging to the Post-2000s (Gen Z/Alpha) group (50%), primarily speaking French or English.
- Domestic travelers account for 74.2% of guests.
- Key international markets include France (74.2%) and United Kingdom (3.7%).
- Top languages spoken are French (37.4%) followed by English (33.7%).
- A significant demographic segment is the Post-2000s (Gen Z/Alpha) group, representing 50% of guests.
Recommendations for Hosts
- Target domestic marketing efforts towards travelers from Paris and Lyon.
- Tailor amenities and listing descriptions to appeal to the dominant Post-2000s (Gen Z/Alpha) demographic (e.g., highlight fast WiFi, smart home features, local guides).
- Highlight unique local experiences or amenities relevant to the primary guest profile.
- Consider seasonal promotions aligned with peak travel times for key origin markets.
Nearby Short-Term Rental Market Comparison
How does the Nîmes Airbnb market stack up against its neighbors? Compare key performance metrics like average monthly revenue, ADR, and occupancy rates in surrounding areas to understand the broader regional STR landscape.
| Market | Active Properties | Monthly Revenue | Daily Rate | Avg. Occupancy |
|---|---|---|---|---|
| Cavillargues | 12 | $3,274 | $342.99 | 43% |
| Eygalières | 82 | $3,206 | $417.97 | 39% |
| Puget | 30 | $3,152 | $362.65 | 41% |
| Gordes | 251 | $3,129 | $406.17 | 41% |
| Rupià | 11 | $3,098 | $292.42 | 48% |
| Divajeu | 20 | $3,061 | $421.97 | 32% |
| Goult | 88 | $2,994 | $342.26 | 44% |
| Suzette | 12 | $2,973 | $415.98 | 37% |
| Ménerbes | 93 | $2,930 | $381.35 | 45% |
| Joucas | 28 | $2,903 | $343.01 | 47% |