Vix Airbnb Market Analysis 2025: Short Term Rental Data & Vacation Rental Statistics in Pays de la Loire, France
Is Airbnb profitable in Vix in 2025? Explore comprehensive Airbnb analytics for Vix, Pays de la Loire, France to uncover income potential. This 2025 STR market report for Vix, based on AirROI data from September 2024 to August 2025, reveals key trends in the niche market of 18 active listings.
Whether you're considering an Airbnb investment in Vix, optimizing your existing vacation rental, or exploring rental arbitrage opportunities, understanding the Vix Airbnb data is crucial. Leveraging the low regulation environment is key to maximizing your short term rental income potential. Let's dive into the specifics.
Key Vix Airbnb Performance Metrics Overview
Monthly Airbnb Revenue Variations & Income Potential in Vix (2025)
Understanding the monthly revenue variations for Airbnb listings in Vix is key to maximizing your short term rental income potential. Seasonality significantly impacts earnings. Our analysis, based on data from the past 12 months, shows that the peak revenue month for STRs in Vix is typically August, while February often presents the lowest earnings, highlighting opportunities for strategic pricing adjustments during shoulder and low seasons. Explore the typical Airbnb income in Vix across different performance tiers:
- Best-in-class properties (Top 10%) achieve $3,033+ monthly, often utilizing dynamic pricing and superior guest experiences.
- Strong performing properties (Top 25%) earn $2,258 or more, indicating effective management and desirable locations/amenities.
- Typical properties (Median) generate around $1,042 per month, representing the average market performance.
- Entry-level properties (Bottom 25%) see earnings around $491, often with potential for optimization.
Average Monthly Airbnb Earnings Trend in Vix
Vix Airbnb Occupancy Rate Trends (2025)
Maximize your bookings by understanding the Vix STR occupancy trends. Seasonal demand shifts significantly influence how often properties are booked. Typically, Augustsees the highest demand (peak season occupancy), while January experiences the lowest (low season). Effective strategies, like adjusting minimum stays or offering promotions, can boost occupancy during slower periods. Here's how different property tiers perform in Vix:
- Best-in-class properties (Top 10%) achieve 62%+ occupancy, indicating high desirability and potentially optimized availability.
- Strong performing properties (Top 25%) maintain 48% or higher occupancy, suggesting good market fit and guest satisfaction.
- Typical properties (Median) have an occupancy rate around 30%.
- Entry-level properties (Bottom 25%) average 15% occupancy, potentially facing higher vacancy.
Average Monthly Occupancy Rate Trend in Vix
Average Daily Rate (ADR) Airbnb Trends in Vix (2025)
Effective short term rental pricing strategy in Vix involves understanding monthly ADR fluctuations. The Average Daily Rate (ADR) for Airbnb in Vix typically peaks in July and dips lowest during March. Leveraging Airbnb dynamic pricing tools or strategies based on this seasonality can significantly boost revenue. Here's a look at the typical nightly rates achieved:
- Best-in-class properties (Top 10%) command rates of $203+ per night, often due to premium features or locations.
- Strong performing properties (Top 25%) achieve nightly rates of $144 or more.
- Typical properties (Median) charge around $105 per night.
- Entry-level properties (Bottom 25%) earn around $90 per night.
Average Daily Rate (ADR) Trend by Month in Vix
Get Live Vix Market Intelligence 👇

Explore Real-time Analytics
Airbnb Seasonality Analysis & Trends in Vix (2025)
Peak Season (August, July, September)
- Revenue averages $2,619 per month
- Occupancy rates average 52.5%
- Daily rates average $139
Shoulder Season
- Revenue averages $1,410 per month
- Occupancy maintains around 34.7%
- Daily rates hold near $124
Low Season (January, February, March)
- Revenue drops to average $473 per month
- Occupancy decreases to average 15.4%
- Daily rates adjust to average $114
Seasonality Insights for Vix
- The Airbnb seasonality in Vix shows highly seasonal trends requiring careful strategy. While the sections above show seasonal averages, it's also insightful to look at the extremes:
- During the high season, the absolute peak month showcases Vix's highest earning potential, with monthly revenues capable of climbing to $3,161, occupancy reaching a high of 58.6%, and ADRs peaking at $151.
- Conversely, the slowest single month of the year, typically falling within the low season, marks the market's lowest point. In this month, revenue might dip to $222, occupancy could drop to 9.9%, and ADRs may adjust down to $112.
- Understanding both the seasonal averages and these monthly peaks and troughs in revenue, occupancy, and ADR is crucial for maximizing your Airbnb profit potential in Vix.
Seasonal Strategies for Maximizing Profit
- Peak Season: Maximize revenue through premium pricing and potentially longer minimum stays. Ensure high availability.
- Low Season: Offer competitive pricing, special promotions (e.g., extended stay discounts), and flexible cancellation policies. Target off-season travelers like remote workers or budget-conscious guests.
- Shoulder Seasons: Implement dynamic pricing that balances peak and low rates. Target weekend travelers or specific events. Offer slightly more flexible terms than peak season.
- Regularly analyze your own performance against these Vix seasonality benchmarks and adjust your pricing and availability strategy accordingly.
Best Areas for Airbnb Investment in Vix (2025)
Exploring the top neighborhoods for short-term rentals in Vix? This section highlights key areas, outlining why they are attractive for hosts and guests, along with notable local attractions. Consider these locations based on your target guest profile and investment strategy.
| Neighborhood / Area | Why Host Here? (Target Guests & Appeal) | Key Attractions & Landmarks |
|---|---|---|
| La Rochelle | A popular coastal city known for its historic harbor and beautiful architecture. Attracts tourists for its beaches, seafood, and maritime activities. | Vieux Port, La Rochelle Aquarium, Towers of La Rochelle, La Rochelle Old Town, Île de Ré |
| Nantes | A vibrant city known for its rich history, culture, and the famous Machines of the Isle of Nantes. Great for urban tourism and cultural experiences. | Machines of the Isle of Nantes, Château des Ducs de Bretagne, Les Machines de l'île, Île de Nantes, Jardin des Plantes |
| Angers | Known for its medieval history and beautiful châteaux, Angers is a charming city that attracts visitors year-round seeking culture and history. | Château d'Angers, Angers Cathedral, Terra Botanica, Cointreau distillery, Musée des Beaux-Arts d'Angers |
| La Baule-Escoublac | A famous seaside resort recognized for its stunning beach, luxury hotels, and vibrant seaside ambiance. Perfect for beachgoers and families. | La Baule Beach, Escoublac Beach, La Baule Casino, Pine forest of La Baule, The Port of La Baule |
| Saint-Nazaire | An important port city with rich maritime history, known for its shipbuilding and the Atlantic Wall. Offers unique industrial tourism. | U-Boat Pens, Escal'Atlantic, Saint-Nazaire submarine base, The Equestrian Center, Les Chantiers de l'Atlantique |
| Cholet | A historic town known for its textiles and beautiful countryside. Attractive for those looking to explore the Loire Valley. | Museum of textiles, Cholet Castle, Parc de Moine, The Royal Abbey of Bellevaux, La Vallée de la Moine |
| Saumur | Famed for its wine and historic château, Saumur is a charming town in the Loire Valley attracting wine enthusiasts and history lovers. | Château de Saumur, Saumur wine cellars, Cadre Noir, The Loire River, Cooperative Agriline |
| Fontenay-le-Comte | A picturesque town with a rich medieval heritage and beautiful architecture, offering a serene experience distinct from larger cities. | Historic center, Fontenay-le-Comte Castle, The Moulins de Puyravault, Church of Saint-Jean, Parc de la Vallée |
Understanding Airbnb License Requirements & STR Laws in Vix (2025)
While Vix, Pays de la Loire, France currently shows low STR regulations, specific Airbnb license requirements might still exist or change. Always verify the latest short term rental regulations and Airbnb license requirements directly with local government authorities for Vix to ensure full compliance before hosting.
(Source: AirROI data, 2025, finding no licensed listings among those analyzed)
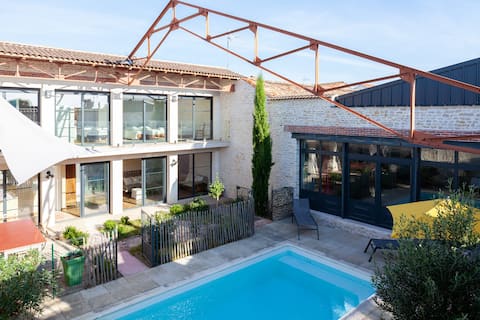
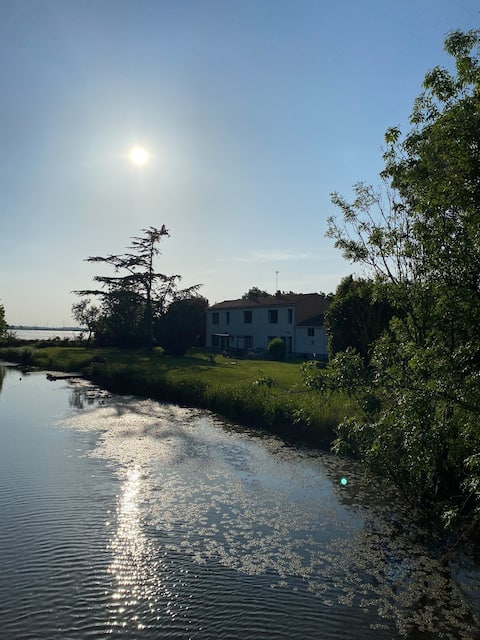
Top Performing Airbnb Properties in Vix (2025)
Benchmark your potential! Explore examples of top-performing Airbnb properties in Vixbased on Trailing Twelve Month (TTM) revenue. Analyze their characteristics, revenue, occupancy rate, and ADR to understand what drives success in this market.
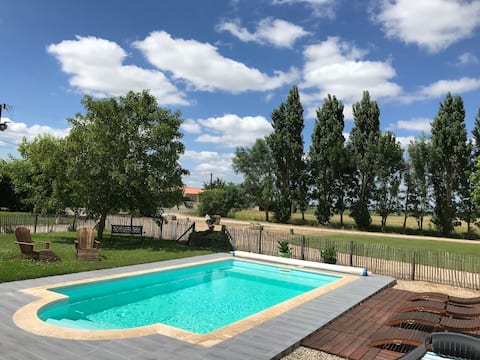
Charming cottage-Pool-jacuzzi-Marais
Entire Place • 3 bedrooms

Hupup'a Exceptional Gite Pool Marais Poitevin
Entire Place • 3 bedrooms

Loft with Private Pool and Garden in Le Marais
Entire Place • 2 bedrooms
Cottage with Private Pool Patio.
Entire Place • 4 bedrooms

double gîte with 3 or 6 bedrooms Marais Poitevin
Entire Place • 5 bedrooms
Gîte Marais Poitevins Le Grand-Sablon Ouest
Entire Place • 2 bedrooms
Note: Performance varies based on location, size, amenities, seasonality, and management quality. Data reflects the past 12 months.
Top Performing Airbnb Hosts in Vix (2025)
Learn from the best! This table showcases top-performing Airbnb hosts in Vix based on the number of properties managed and estimated total revenue over the past year. Analyze their scale and performance metrics.
| Host Name | Properties | Grossing Revenue | Stay Reviews | Avg Rating |
|---|---|---|---|---|
| Lionel | 2 | $40,978 | 77 | 4.79/5.0 |
| Virginie | 1 | $37,121 | 87 | 4.90/5.0 |
| Le Jardin Gourmand | 3 | $31,778 | 161 | 4.57/5.0 |
| Fanny | 2 | $24,622 | 48 | 4.90/5.0 |
| Cal | 1 | $22,334 | 43 | 4.93/5.0 |
| Miguel | 1 | $19,514 | 9 | 4.89/5.0 |
| Jeremy | 1 | $15,909 | 37 | 4.97/5.0 |
| Le Temps D'Une Escale | 2 | $12,355 | 12 | 4.82/5.0 |
| Christine | 2 | $7,788 | 30 | 4.91/5.0 |
| Emmanuel | 1 | $6,813 | 68 | 4.87/5.0 |
Analyzing the strategies of top hosts, such as their property selection, pricing, and guest communication, can offer valuable lessons for optimizing your own Airbnb operations in Vix.
Dive Deeper: Advanced Vix STR Market Data (2025)
Ready to unlock more insights? AirROI provides access to advanced metrics and comprehensive Airbnb data for Vix. Explore detailed analytics beyond this report to refine your investment strategy, optimize pricing, and maximize your vacation rental profits.
Explore Advanced MetricsVix Short-Term Rental Market Composition (2025): Property & Room Types
Room Type Distribution
Property Type Distribution
Market Composition Insights for Vix
- The Vix Airbnb market composition is heavily skewed towards Entire Home/Apt listings, which make up 83.3% of the 18 active rentals. This indicates strong guest preference for privacy and space.
- Looking at the property type distribution in Vix, House properties are the most common (88.9%), reflecting the local real estate landscape.
- Houses represent a significant 88.9% portion, catering likely to families or larger groups.
Vix Airbnb Room Capacity Analysis (2025): Bedroom Distribution
Distribution of Listings by Number of Bedrooms
Room Capacity Insights for Vix
- The dominant room capacity in Vix is 2 bedrooms listings, making up 44.4% of the market. This suggests a strong demand for properties suitable for couples or solo travelers.
- Together, 2 bedrooms and 1 bedroom properties represent 61.1% of the active Airbnb listings in Vix, indicating a high concentration in these sizes.
- A significant 33.4% of listings offer 3+ bedrooms, catering to larger groups and families seeking more space in Vix.
Vix Vacation Rental Guest Capacity Trends (2025)
Distribution of Listings by Guest Capacity
Guest Capacity Insights for Vix
- The most common guest capacity trend in Vix vacation rentals is listings accommodating 8+ guests (27.8%). This suggests the primary traveler segment is likely larger groups.
- Properties designed for 8+ guests and 4 guests dominate the Vix STR market, accounting for 50.0% of listings.
- 50.1% of properties accommodate 6+ guests, serving the market segment for larger families or group travel in Vix.
- On average, properties in Vix are equipped to host 5.0 guests.
Vix Airbnb Booking Patterns (2025): Available vs. Booked Days
Available Days Distribution
Booked Days Distribution
Booking Pattern Insights for Vix
- The most common availability pattern in Vix falls within the 271-366 days range, representing 55.6% of listings. This suggests many properties have significant open periods on their calendars.
- Approximately 94.5% of listings show high availability (181+ days open annually), indicating potential for increased bookings or specific owner usage patterns.
- For booked days, the 91-180 days range is most frequent in Vix (44.4%), reflecting common guest stay durations or potential owner blocking patterns.
- A notable 5.6% of properties secure long booking periods (181+ days booked per year), highlighting successful long-term rental strategies or significant owner usage.
Vix Airbnb Minimum Stay Requirements Analysis
Distribution of Listings by Minimum Night Requirement
1 Night
4 listings
22.2% of total
2 Nights
6 listings
33.3% of total
4-6 Nights
2 listings
11.1% of total
7-29 Nights
3 listings
16.7% of total
30+ Nights
3 listings
16.7% of total
Key Insights
- The most prevalent minimum stay requirement in Vix is 2 Nights, adopted by 33.3% of listings. This highlights the market's preference for shorter, flexible bookings.
- A significant segment (16.7%) caters to monthly stays (30+ nights) in Vix, pointing to opportunities in the extended-stay market.
Recommendations
- Align with the market by considering a 2 Nights minimum stay, as 33.3% of Vix hosts use this setting.
- If feasible, allowing 1-night stays, especially midweek or during low season, could capture last-minute bookings, as only 22.2% currently do.
- Explore offering discounts for stays of 30+ nights to attract the 16.7% of the market seeking extended stays.
- Adjust minimum nights based on seasonality – potentially shorter during low season and longer during peak demand periods in Vix.
Vix Airbnb Cancellation Policy Trends Analysis (2025)
Flexible
9 listings
50% of total
Moderate
4 listings
22.2% of total
Firm
2 listings
11.1% of total
Strict
3 listings
16.7% of total
Cancellation Policy Insights for Vix
- The prevailing Airbnb cancellation policy trend in Vix is Flexible, used by 50% of listings.
- The market strongly favors guest-friendly terms, with 72.2% of listings offering Flexible or Moderate policies. This suggests guests in Vix may expect booking flexibility.
Recommendations for Hosts
- Consider adopting a Flexible policy to align with the 50% market standard in Vix.
- Regularly review your cancellation policy against competitors and market demand shifts in Vix.
Vix STR Booking Lead Time Analysis (2025)
Average Booking Lead Time by Month
Booking Lead Time Insights for Vix
- The overall average booking lead time for vacation rentals in Vix is 55 days.
- Guests book furthest in advance for stays during August (average 103 days), likely coinciding with peak travel demand or local events.
- The shortest booking windows occur for stays in January (average 14 days), indicating more last-minute travel plans during this time.
- Seasonally, Summer (92 days avg.) sees the longest lead times, while Winter (16 days avg.) has the shortest, reflecting typical travel planning cycles.
Recommendations for Hosts
- Use the overall average lead time (55 days) as a baseline for your pricing and availability strategy in Vix.
- For August stays, consider implementing length-of-stay discounts or slightly higher rates for bookings made less than 103 days out to capitalize on advance planning.
- During January, focus on last-minute booking availability and promotions, as guests book with very short notice (14 days avg.).
- Target marketing efforts for the Summer season well in advance (at least 92 days) to capture early planners.
- Monitor your own booking lead times against these Vix averages to identify opportunities for dynamic pricing adjustments.
Popular & Essential Airbnb Amenities in Vix (2025)
Amenity Prevalence
Amenity Insights for Vix
- Essential amenities in Vix that guests expect include: Smoke alarm, Free parking on premises, Wifi. Lacking these (any) could significantly impact bookings.
- Popular amenities like Heating, Hair dryer, Hot water are common but not universal. Offering these can provide a competitive edge.
Recommendations for Hosts
- Ensure your listing includes all essential amenities for Vix: Smoke alarm, Free parking on premises, Wifi.
- Consider adding popular differentiators like Heating or Hair dryer to increase appeal.
- Highlight unique or less common amenities you offer (e.g., hot tub, dedicated workspace, EV charger) in your listing description and photos.
- Regularly check competitor amenities in Vix to stay competitive.
Vix Airbnb Guest Demographics & Profile Analysis (2025)
Guest Profile Summary for Vix
- The typical guest profile for Airbnb in Vix consists of primarily domestic travelers (86%), often arriving from nearby Nantes, typically belonging to the Post-2000s (Gen Z/Alpha) group (50%), primarily speaking French or English.
- Domestic travelers account for 86.4% of guests.
- Key international markets include France (86.4%) and United Kingdom (9.1%).
- Top languages spoken are French (47.5%) followed by English (33.9%).
- A significant demographic segment is the Post-2000s (Gen Z/Alpha) group, representing 50% of guests.
Recommendations for Hosts
- Target domestic marketing efforts towards travelers from Nantes and Paris.
- Tailor amenities and listing descriptions to appeal to the dominant Post-2000s (Gen Z/Alpha) demographic (e.g., highlight fast WiFi, smart home features, local guides).
- Highlight unique local experiences or amenities relevant to the primary guest profile.
- Consider seasonal promotions aligned with peak travel times for key origin markets.
Nearby Short-Term Rental Market Comparison
How does the Vix Airbnb market stack up against its neighbors? Compare key performance metrics like average monthly revenue, ADR, and occupancy rates in surrounding areas to understand the broader regional STR landscape.
| Market | Active Properties | Monthly Revenue | Daily Rate | Avg. Occupancy |
|---|---|---|---|---|
| Thilouze | 10 | $3,630 | $313.21 | 56% |
| Artannes-sur-Indre | 23 | $2,866 | $332.16 | 38% |
| Saint-Hippolyte | 10 | $2,807 | $225.44 | 34% |
| Bourneau | 11 | $2,676 | $439.86 | 29% |
| Sainte-Florence | 10 | $2,469 | $172.30 | 54% |
| Varrains | 13 | $2,419 | $198.68 | 40% |
| Antonne-et-Trigonant | 10 | $2,404 | $265.18 | 34% |
| Croix-Chapeau | 11 | $2,388 | $211.70 | 38% |
| Coteaux-sur-Loire | 22 | $2,377 | $259.26 | 38% |
| Villiers-sur-Loir | 13 | $2,354 | $204.52 | 37% |