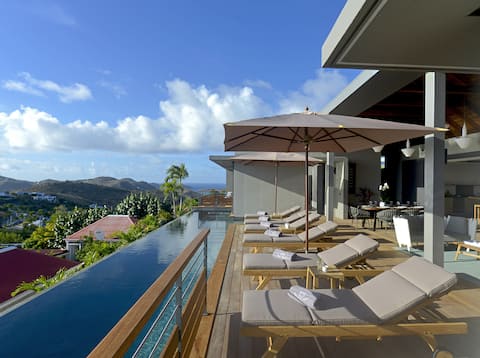
Saint Barthélemy Airbnb Market Analysis 2026: Short Term Rental Data & Vacation Rental Statistics in Saint Barthélemy, France
Is Airbnb profitable in Saint Barthélemy in 2026? Explore comprehensive Airbnb analytics for Saint Barthélemy, Saint Barthélemy, France to uncover income potential. This 2026 STR market report for Saint Barthélemy, based on AirROI data from February 2025 to January 2026, reveals key trends in the market of 554 active listings.
Whether you're considering an Airbnb investment in Saint Barthélemy, optimizing your existing vacation rental, or exploring rental arbitrage opportunities, understanding the Saint Barthélemy Airbnb data is crucial. Navigating the high regulation landscape is key to maximizing your short term rental income potential. Let's dive into the specifics.
Key Saint Barthélemy Airbnb Performance Metrics Overview
Monthly Airbnb Revenue Variations & Income Potential in Saint Barthélemy (2026)
Understanding the monthly revenue variations for Airbnb listings in Saint Barthélemy is key to maximizing your short term rental income potential. Seasonality significantly impacts earnings. Our analysis, based on data from the past 12 months, shows that the peak revenue month for STRs in Saint Barthélemy is typically March, while September often presents the lowest earnings, highlighting opportunities for strategic pricing adjustments during shoulder and low seasons. Explore the typical Airbnb income in Saint Barthélemy across different performance tiers:
- Best-in-class properties (Top 10%) achieve $22,019+ monthly, often utilizing dynamic pricing and superior guest experiences.
- Strong performing properties (Top 25%) earn $12,571 or more, indicating effective management and desirable locations/amenities.
- Typical properties (Median) generate around $6,496 per month, representing the average market performance.
- Entry-level properties (Bottom 25%) see earnings around $3,388, often with potential for optimization.
Average Monthly Airbnb Earnings Trend in Saint Barthélemy
Saint Barthélemy Airbnb Occupancy Rate Trends (2026)
Maximize your bookings by understanding the Saint Barthélemy STR occupancy trends. Seasonal demand shifts significantly influence how often properties are booked. Typically, Februarysees the highest demand (peak season occupancy), while June experiences the lowest (low season). Effective strategies, like adjusting minimum stays or offering promotions, can boost occupancy during slower periods. Here's how different property tiers perform in Saint Barthélemy:
- Best-in-class properties (Top 10%) achieve 79%+ occupancy, indicating high desirability and potentially optimized availability.
- Strong performing properties (Top 25%) maintain 60% or higher occupancy, suggesting good market fit and guest satisfaction.
- Typical properties (Median) have an occupancy rate around 36%.
- Entry-level properties (Bottom 25%) average 18% occupancy, potentially facing higher vacancy.
Average Monthly Occupancy Rate Trend in Saint Barthélemy
Average Daily Rate (ADR) Airbnb Trends in Saint Barthélemy (2026)
Effective short term rental pricing strategy in Saint Barthélemy involves understanding monthly ADR fluctuations. The Average Daily Rate (ADR) for Airbnb in Saint Barthélemy typically peaks in December and dips lowest during August. Leveraging Airbnb dynamic pricing tools or strategies based on this seasonality can significantly boost revenue. Here's a look at the typical nightly rates achieved:
- Best-in-class properties (Top 10%) command rates of $2,240+ per night, often due to premium features or locations.
- Strong performing properties (Top 25%) achieve nightly rates of $1,386 or more.
- Typical properties (Median) charge around $792 per night.
- Entry-level properties (Bottom 25%) earn around $432 per night.
Average Daily Rate (ADR) Trend by Month in Saint Barthélemy
Get Live Saint Barthélemy Market Intelligence 👇
Explore Real-time Analytics
Airbnb Seasonality Analysis & Trends in Saint Barthélemy (2026)
Peak Season (March, February, December)
- Revenue averages $14,664 per month
- Occupancy rates average 52.4%
- Daily rates average $1,177
Shoulder Season
- Revenue averages $9,333 per month
- Occupancy maintains around 39.2%
- Daily rates hold near $1,034
Low Season (June, September, October)
- Revenue drops to average $6,266 per month
- Occupancy decreases to average 31.1%
- Daily rates adjust to average $983
Seasonality Insights for Saint Barthélemy
- The Airbnb seasonality in Saint Barthélemy shows highly seasonal trends requiring careful strategy. While the sections above show seasonal averages, it's also insightful to look at the extremes:
- During the high season, the absolute peak month showcases Saint Barthélemy's highest earning potential, with monthly revenues capable of climbing to $15,795, occupancy reaching a high of 59.8%, and ADRs peaking at $1,373.
- Conversely, the slowest single month of the year, typically falling within the low season, marks the market's lowest point. In this month, revenue might dip to $5,879, occupancy could drop to 27.1%, and ADRs may adjust down to $932.
- Understanding both the seasonal averages and these monthly peaks and troughs in revenue, occupancy, and ADR is crucial for maximizing your Airbnb profit potential in Saint Barthélemy.
Seasonal Strategies for Maximizing Profit
- Peak Season: Maximize revenue through premium pricing and potentially longer minimum stays. Ensure high availability.
- Low Season: Offer competitive pricing, special promotions (e.g., extended stay discounts), and flexible cancellation policies. Target off-season travelers like remote workers or budget-conscious guests.
- Shoulder Seasons: Implement dynamic pricing that balances peak and low rates. Target weekend travelers or specific events. Offer slightly more flexible terms than peak season.
- Regularly analyze your own performance against these Saint Barthélemy seasonality benchmarks and adjust your pricing and availability strategy accordingly.
Best Areas for Airbnb Investment in Saint Barthélemy (2026)
Exploring the top neighborhoods for short-term rentals in Saint Barthélemy? This section highlights key areas, outlining why they are attractive for hosts and guests, along with notable local attractions. Consider these locations based on your target guest profile and investment strategy.
| Neighborhood / Area | Why Host Here? (Target Guests & Appeal) | Key Attractions & Landmarks |
|---|---|---|
| Gustavia | The capital and main port of Saint Barthélemy, known for its luxury shops, fine dining, and vibrant nightlife. A hotspot for tourists arriving via yacht or plane, and offers stunning views of the harbor. | Gustavia Harbor, Shell Beach, Wall House Restaurant, St. Barths Historical Museum, Luxury Boutiques |
| St. Jean | A picturesque area famous for its beautiful beaches and upscale resorts. St. Jean is known for its relaxed atmosphere and is popular with tourists seeking beach access and water sports. | St. Jean Beach, Nikki Beach, Éden Rock, Corossol Beach, Water sports activities |
| Corossol | A charming fishing village that offers visitors a glimpse of local life and a quieter atmosphere. Close to Gustavia but offers a different vibe and unique beaches. | Corossol Beach, Local Artisan Shops, Anse de Grand Cul-de-Sac, Quiet Coastal Walks, Nearby Restaurants |
| Saline Beach | A secluded beach known for its natural beauty and tranquility, perfect for those looking to escape the crowds. Popular among couples and nature lovers. | Saline Beach, Wild Surroundings, Beach Picnicking, Nature Trails, Sunbathing Spots |
| Colombier | A remote area known for its hiking trails and pristine beaches. It offers a more off-the-beaten-path experience popular with nature lovers and adventurers. | Colombier Beach, Hiking Trails, Natural Reserves, Secluded Cove Experiences, Wildlife Viewing |
| Lorient | Known for its laid-back vibe and family-friendly atmosphere, Lorient features a famous surf spot and chill beaches, making it popular for both relaxation and water activities. | Lorient Beach, Surfing Spots, Local Dining, Cultural Events, Seaside Walks |
| Toiny | A lesser-known gem that offers an exclusive atmosphere with beautiful landscapes. It's popular among those searching for a tranquil getaway and enjoys great surf during the right season. | Toiny Beach, Surfing Hotspots, Luxury Villas, Nature Walks, Tranquil Escape |
| Grand Cul-de-Sac | This area is ideal for water sports enthusiasts with its clear waters, making it perfect for snorkeling and kayaking. It has a relaxed atmosphere with beautiful sea views. | Grand Cul-de-Sac Beach, Water Sports Rentals, Snorkeling Tours, Beachfront Restaurants, Local Markets |
Understanding Airbnb License Requirements & STR Laws in Saint Barthélemy (2026)
Yes, Saint Barthélemy, Saint Barthélemy, France enforces high STR regulations. Obtaining a license and ensuring compliance is almost certainly required according to current 2026 STR laws. Always verify the latest short term rental regulations and Airbnb license requirements directly with local government authorities for Saint Barthélemy to ensure full compliance before hosting.
(Source: AirROI data, 2026, based on 92% licensed listings)
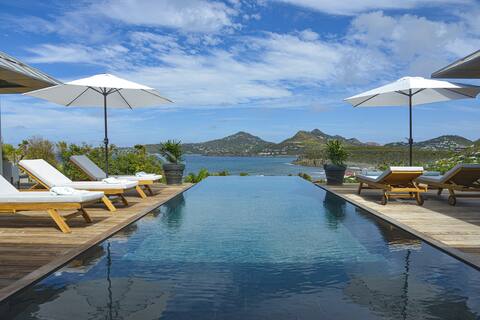
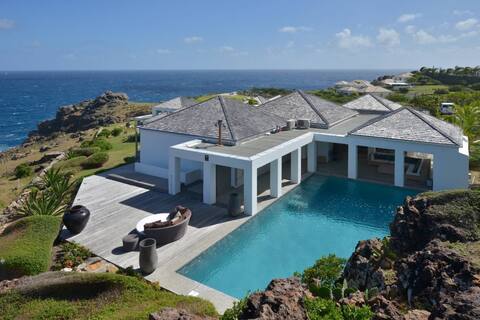
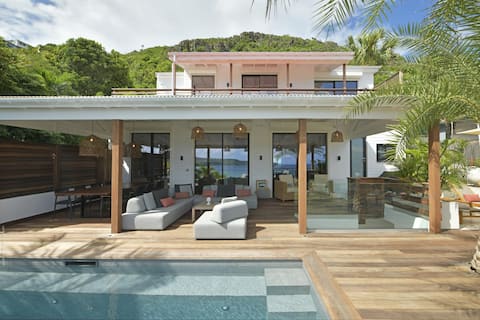
Top Performing Airbnb Properties in Saint Barthélemy (2026)
Benchmark your potential! Explore examples of top-performing Airbnb properties in Saint Barthélemybased on Trailing Twelve Month (TTM) revenue. Analyze their characteristics, revenue, occupancy rate, and ADR to understand what drives success in this market.
Villa Marcel, 4 to 6 bedrooms, 1 pool
Entire Place • 6 bedrooms
CASA DEL MAR (BEACH HOUSE) - SAINT BARTH
Entire Place • 6 bedrooms
Villa Nagabaaja
Entire Place • 4 bedrooms

xmas DiSCOUNT Beach Villa close 2 St Jean &Flamans
Entire Place • 3 bedrooms
Villa Edunia, 3 or 4 bedrooms and 1 pool
Entire Place • 4 bedrooms

VILLA PELICAN
Entire Place • 4 bedrooms
Note: Performance varies based on location, size, amenities, seasonality, and management quality. Data reflects the past 12 months.
Top Performing Airbnb Hosts in Saint Barthélemy (2026)
Learn from the best! This table showcases top-performing Airbnb hosts in Saint Barthélemy based on the number of properties managed and estimated total revenue over the past year. Analyze their scale and performance metrics.
| Host Name | Properties | Grossing Revenue | Stay Reviews | Avg Rating |
|---|---|---|---|---|
| Monique / Didier | 11 | $2,130,019 | 120 | 4.89/5.0 |
| Sibarth | 19 | $1,763,141 | 46 | 4.88/5.0 |
| Sophie | 33 | $1,172,715 | 40 | 4.95/5.0 |
| Luxvillastbarth | 25 | $1,118,890 | 62 | 4.95/5.0 |
| Susanne | 3 | $877,831 | 83 | 4.98/5.0 |
| Unique Villas | 11 | $861,934 | 64 | 4.95/5.0 |
| Sigolène | 10 | $828,262 | 137 | 4.98/5.0 |
| Corcoran | 31 | $804,417 | 65 | 4.93/5.0 |
| Monique Turbé | 16 | $686,596 | 22 | 4.83/5.0 |
| Peggy | 4 | $615,597 | 13 | 5.00/5.0 |
Analyzing the strategies of top hosts, such as their property selection, pricing, and guest communication, can offer valuable lessons for optimizing your own Airbnb operations in Saint Barthélemy.
Dive Deeper: Advanced Saint Barthélemy STR Market Data (2026)
Ready to unlock more insights? AirROI provides access to advanced metrics and comprehensive Airbnb data for Saint Barthélemy. Explore detailed analytics beyond this report to refine your investment strategy, optimize pricing, and maximize your vacation rental profits.
Explore Advanced MetricsSaint Barthélemy Short-Term Rental Market Composition (2026): Property & Room Types
Room Type Distribution
Property Type Distribution
Market Composition Insights for Saint Barthélemy
- The Saint Barthélemy Airbnb market composition is heavily skewed towards Entire Home/Apt listings, which make up 94.4% of the 554 active rentals. This indicates strong guest preference for privacy and space.
- Looking at the property type distribution in Saint Barthélemy, House properties are the most common (74.9%), reflecting the local real estate landscape.
- Houses represent a significant 74.9% portion, catering likely to families or larger groups.
- Smaller segments like hotel/boutique, others, outdoor/unique, unique stays (combined 4.1%) offer potential for unique stay experiences.
Saint Barthélemy Airbnb Room Capacity Analysis (2026): Bedroom Distribution
Distribution of Listings by Number of Bedrooms
Room Capacity Insights for Saint Barthélemy
- The dominant room capacity in Saint Barthélemy is 1 bedroom listings, making up 32.3% of the market. This suggests a strong demand for properties suitable for couples or solo travelers.
- Together, 1 bedroom and 2 bedrooms properties represent 60.8% of the active Airbnb listings in Saint Barthélemy, indicating a high concentration in these sizes.
- A significant 35.4% of listings offer 3+ bedrooms, catering to larger groups and families seeking more space in Saint Barthélemy.
Saint Barthélemy Vacation Rental Guest Capacity Trends (2026)
Distribution of Listings by Guest Capacity
Guest Capacity Insights for Saint Barthélemy
- The most common guest capacity trend in Saint Barthélemy vacation rentals is listings accommodating 2 guests (30.3%). This suggests the primary traveler segment is likely couples or solo travelers.
- Properties designed for 2 guests and 4 guests dominate the Saint Barthélemy STR market, accounting for 59.5% of listings.
- 33.3% of properties accommodate 6+ guests, serving the market segment for larger families or group travel in Saint Barthélemy.
- On average, properties in Saint Barthélemy are equipped to host 4.3 guests.
Saint Barthélemy Airbnb Booking Patterns (2026): Available vs. Booked Days
Available Days Distribution
Booked Days Distribution
Booking Pattern Insights for Saint Barthélemy
- The most common availability pattern in Saint Barthélemy falls within the 271-366 days range, representing 62.6% of listings. This suggests many properties have significant open periods on their calendars.
- Approximately 85.9% of listings show high availability (181+ days open annually), indicating potential for increased bookings or specific owner usage patterns.
- For booked days, the 31-90 days range is most frequent in Saint Barthélemy (31.6%), reflecting common guest stay durations or potential owner blocking patterns.
- A notable 14.8% of properties secure long booking periods (181+ days booked per year), highlighting successful long-term rental strategies or significant owner usage.
Saint Barthélemy Airbnb Minimum Stay Requirements Analysis
Distribution of Listings by Minimum Night Requirement
1 Night
15 listings
2.7% of total
2 Nights
13 listings
2.3% of total
3 Nights
40 listings
7.2% of total
4-6 Nights
219 listings
39.5% of total
7-29 Nights
75 listings
13.5% of total
30+ Nights
192 listings
34.7% of total
Key Insights
- The most prevalent minimum stay requirement in Saint Barthélemy is 4-6 Nights, adopted by 39.5% of listings. This highlights the market's preference for longer commitments.
- Very short stays (1-2 nights) are less common (5.0%), suggesting hosts prefer slightly longer bookings to optimize turnover.
- A significant segment (34.7%) caters to monthly stays (30+ nights) in Saint Barthélemy, pointing to opportunities in the extended-stay market.
Recommendations
- Align with the market by considering a 4-6 Nights minimum stay, as 39.5% of Saint Barthélemy hosts use this setting.
- If feasible, allowing 1-night stays, especially midweek or during low season, could capture last-minute bookings, as only 2.7% currently do.
- Explore offering discounts for stays of 30+ nights to attract the 34.7% of the market seeking extended stays.
- Adjust minimum nights based on seasonality – potentially shorter during low season and longer during peak demand periods in Saint Barthélemy.
Saint Barthélemy Airbnb Cancellation Policy Trends Analysis (2026)
Super Strict 60 Days
80 listings
14.4% of total
Limited
10 listings
1.8% of total
Super Strict 30 Days
44 listings
7.9% of total
Flexible
18 listings
3.2% of total
Moderate
20 listings
3.6% of total
Firm
235 listings
42.4% of total
Strict
147 listings
26.5% of total
Cancellation Policy Insights for Saint Barthélemy
- The prevailing Airbnb cancellation policy trend in Saint Barthélemy is Firm, used by 42.4% of listings.
- A majority (68.9%) of hosts in Saint Barthélemy utilize Firm or Strict policies, indicating a market where hosts prioritize booking security.
Recommendations for Hosts
- Consider adopting a Firm policy to align with the 42.4% market standard in Saint Barthélemy.
- Regularly review your cancellation policy against competitors and market demand shifts in Saint Barthélemy.
Saint Barthélemy STR Booking Lead Time Analysis (2026)
Average Booking Lead Time by Month
Booking Lead Time Insights for Saint Barthélemy
- The overall average booking lead time for vacation rentals in Saint Barthélemy is 86 days.
- Guests book furthest in advance for stays during December (average 112 days), likely coinciding with peak travel demand or local events.
- The shortest booking windows occur for stays in June (average 40 days), indicating more last-minute travel plans during this time.
- Seasonally, Winter (107 days avg.) sees the longest lead times, while Summer (51 days avg.) has the shortest, reflecting typical travel planning cycles.
Recommendations for Hosts
- Use the overall average lead time (86 days) as a baseline for your pricing and availability strategy in Saint Barthélemy.
- For December stays, consider implementing length-of-stay discounts or slightly higher rates for bookings made less than 112 days out to capitalize on advance planning.
- Target marketing efforts for the Winter season well in advance (at least 107 days) to capture early planners.
- Monitor your own booking lead times against these Saint Barthélemy averages to identify opportunities for dynamic pricing adjustments.
Popular & Essential Airbnb Amenities in Saint Barthélemy (2026)
Amenity Prevalence
Amenity Insights for Saint Barthélemy
- Essential amenities in Saint Barthélemy that guests expect include: Wifi, Air conditioning. Lacking these (any) could significantly impact bookings.
- Popular amenities like Kitchen, TV, Free parking on premises are common but not universal. Offering these can provide a competitive edge.
Recommendations for Hosts
- Ensure your listing includes all essential amenities for Saint Barthélemy: Wifi, Air conditioning.
- Prioritize adding missing essentials: Wifi, Air conditioning.
- Consider adding popular differentiators like Kitchen or TV to increase appeal.
- Highlight unique or less common amenities you offer (e.g., hot tub, dedicated workspace, EV charger) in your listing description and photos.
- Regularly check competitor amenities in Saint Barthélemy to stay competitive.
Saint Barthélemy Airbnb Guest Demographics & Profile Analysis (2026)
Guest Profile Summary for Saint Barthélemy
- The typical guest profile for Airbnb in Saint Barthélemy consists of predominantly international visitors (85%), with top international origins including France, typically belonging to the Post-2000s (Gen Z/Alpha) group (50%), primarily speaking English or French.
- Domestic travelers account for 15.2% of guests.
- Key international markets include United States (60.8%) and France (15.2%).
- Top languages spoken are English (47.9%) followed by French (19.1%).
- A significant demographic segment is the Post-2000s (Gen Z/Alpha) group, representing 50% of guests.
Recommendations for Hosts
- Focus marketing internationally, particularly towards travelers from France.
- Tailor amenities and listing descriptions to appeal to the dominant Post-2000s (Gen Z/Alpha) demographic (e.g., highlight fast WiFi, smart home features, local guides).
- Highlight unique local experiences or amenities relevant to the primary guest profile.
- Consider seasonal promotions aligned with peak travel times for key origin markets.
Nearby Short-Term Rental Market Comparison
How does the Saint Barthélemy Airbnb market stack up against its neighbors? Compare key performance metrics like average monthly revenue, ADR, and occupancy rates in surrounding areas to understand the broader regional STR landscape.
| Market | Active Properties | Monthly Revenue | Daily Rate | Avg. Occupancy |
|---|---|---|---|---|
| Long Bay Village | 26 | $5,969 | $1098.49 | 32% |
| Fleming Estate | 15 | $5,884 | $572.58 | 46% |
| West End Village | 21 | $4,844 | $1011.24 | 33% |
| Simpson Bay | 71 | $4,362 | $469.96 | 41% |
| Sandy Ground | 15 | $4,036 | $442.05 | 40% |
| Cul-de-Sac | 285 | $3,911 | $368.99 | 41% |
| Bolans | 81 | $3,659 | $526.19 | 36% |
| Dawn Beach | 65 | $3,368 | $419.79 | 38% |
| Crosbies | 17 | $3,348 | $520.95 | 40% |
| Simpson Bay | 208 | $3,299 | $342.37 | 44% |