North Legon Airbnb Market Analysis 2026: Short Term Rental Data & Vacation Rental Statistics in Greater Accra Region, Ghana
Is Airbnb profitable in North Legon in 2026? Explore comprehensive Airbnb analytics for North Legon, Greater Accra Region, Ghana to uncover income potential. This 2026 STR market report for North Legon, based on AirROI data from May 2024 to April 2025, reveals key trends in the niche market of 25 active listings.
Whether you're considering an Airbnb investment in North Legon, optimizing your existing vacation rental, or exploring rental arbitrage opportunities, understanding the North Legon Airbnb data is crucial. Leveraging the low regulation environment is key to maximizing your short term rental income potential. Let's dive into the specifics.
Key North Legon Airbnb Performance Metrics Overview
Monthly Airbnb Revenue Variations & Income Potential in North Legon (2026)
Understanding the monthly revenue variations for Airbnb listings in North Legon is key to maximizing your short term rental income potential. Seasonality significantly impacts earnings. Our analysis, based on data from the past 12 months, shows that the peak revenue month for STRs in North Legon is typically May, while April often presents the lowest earnings, highlighting opportunities for strategic pricing adjustments during shoulder and low seasons. Explore the typical Airbnb income in North Legon across different performance tiers:
- Best-in-class properties (Top 10%) achieve $2,359+ monthly, often utilizing dynamic pricing and superior guest experiences.
- Strong performing properties (Top 25%) earn $1,774 or more, indicating effective management and desirable locations/amenities.
- Typical properties (Median) generate around $1,175 per month, representing the average market performance.
- Entry-level properties (Bottom 25%) see earnings around $667, often with potential for optimization.
Average Monthly Airbnb Earnings Trend in North Legon
North Legon Airbnb Occupancy Rate Trends (2026)
Maximize your bookings by understanding the North Legon STR occupancy trends. Seasonal demand shifts significantly influence how often properties are booked. Typically, Maysees the highest demand (peak season occupancy), while March experiences the lowest (low season). Effective strategies, like adjusting minimum stays or offering promotions, can boost occupancy during slower periods. Here's how different property tiers perform in North Legon:
- Best-in-class properties (Top 10%) achieve 68%+ occupancy, indicating high desirability and potentially optimized availability.
- Strong performing properties (Top 25%) maintain 54% or higher occupancy, suggesting good market fit and guest satisfaction.
- Typical properties (Median) have an occupancy rate around 33%.
- Entry-level properties (Bottom 25%) average 17% occupancy, potentially facing higher vacancy.
Average Monthly Occupancy Rate Trend in North Legon
Average Daily Rate (ADR) Airbnb Trends in North Legon (2026)
Effective short term rental pricing strategy in North Legon involves understanding monthly ADR fluctuations. The Average Daily Rate (ADR) for Airbnb in North Legon typically peaks in July and dips lowest during March. Leveraging Airbnb dynamic pricing tools or strategies based on this seasonality can significantly boost revenue. Here's a look at the typical nightly rates achieved:
- Best-in-class properties (Top 10%) command rates of $130+ per night, often due to premium features or locations.
- Strong performing properties (Top 25%) achieve nightly rates of $81 or more.
- Typical properties (Median) charge around $67 per night.
- Entry-level properties (Bottom 25%) earn around $44 per night.
Average Daily Rate (ADR) Trend by Month in North Legon
Get Live North Legon Market Intelligence 👇
Explore Real-time Analytics
Airbnb Seasonality Analysis & Trends in North Legon (2025)
Peak Season (May, June, September)
- Revenue averages $1,936 per month
- Occupancy rates average 47.3%
- Daily rates average $75
Shoulder Season
- Revenue averages $1,140 per month
- Occupancy maintains around 33.8%
- Daily rates hold near $73
Low Season (January, April, December)
- Revenue drops to average $921 per month
- Occupancy decreases to average 31.2%
- Daily rates adjust to average $69
Seasonality Insights for North Legon
- The Airbnb seasonality in North Legon shows highly seasonal trends requiring careful strategy. While the sections above show seasonal averages, it's also insightful to look at the extremes:
- During the high season, the absolute peak month showcases North Legon's highest earning potential, with monthly revenues capable of climbing to $2,277, occupancy reaching a high of 62.4%, and ADRs peaking at $76.
- Conversely, the slowest single month of the year, typically falling within the low season, marks the market's lowest point. In this month, revenue might dip to $889, occupancy could drop to 22.6%, and ADRs may adjust down to $67.
- Understanding both the seasonal averages and these monthly peaks and troughs in revenue, occupancy, and ADR is crucial for maximizing your Airbnb profit potential in North Legon.
Seasonal Strategies for Maximizing Profit
- Peak Season: Maximize revenue through premium pricing and potentially longer minimum stays. Ensure high availability.
- Low Season: Offer competitive pricing, special promotions (e.g., extended stay discounts), and flexible cancellation policies. Target off-season travelers like remote workers or budget-conscious guests.
- Shoulder Seasons: Implement dynamic pricing that balances peak and low rates. Target weekend travelers or specific events. Offer slightly more flexible terms than peak season.
- Regularly analyze your own performance against these North Legon seasonality benchmarks and adjust your pricing and availability strategy accordingly.
Best Areas for Airbnb Investment in North Legon (2026)
Exploring the top neighborhoods for short-term rentals in North Legon? This section highlights key areas, outlining why they are attractive for hosts and guests, along with notable local attractions. Consider these locations based on your target guest profile and investment strategy.
| Neighborhood / Area | Why Host Here? (Target Guests & Appeal) | Key Attractions & Landmarks |
|---|---|---|
| North Legon | A rapidly developing neighborhood in Accra attracting young professionals and families. Close to educational institutions and amenities, making it ideal for short-term rentals. | Legon Botanical Gardens, University of Ghana, Ajiringano Market, International Central Gospel Church, Ghana National Museum |
| Abokobi | Quiet suburb with a mix of residential and commercial spaces. Great for travelers looking for a peaceful retreat while still being close to the city center. | Abokobi School Park, Green Park, local eateries, Kokrobite Beach, Ghana International School |
| Haatso | Residential area with a vibrant community feel. Accessible and close to shops and amenities, appealing to families and local tourists. | Haatso Market, local shopping centers, community parks, restaurants, Nima Beach |
| East Legon | Known for its upscale neighborhoods and vibrant nightlife, ideal for both business and leisure travelers. | Bistro 22, Legon Park, local cafes, art galleries, nightclubs |
| Madina | Centrally located with busy markets and transport links. Popular for budget travelers looking for a cultural experience. | Madina Market, local transportation hubs, cultural festivals, traditional restaurants, Shopping at Madina |
| Dzorwulu | A growing area with a mix of modern and traditional characteristics, attracting both local and international visitors. | Dzorwulu Park, food markets, local craftsmanship, nightlife spots, business districts |
| Tema | Port city with business opportunities and attractive to international visitors and maritime workers. | Tema Port, local beaches, community centers, business hubs, Shopping malls |
| Anumle | A quieter neighborhood known for its residential appeal, suitable for families and extended stays. | community parks, local shops, Ghana International School, nearby nature trails, family-friendly restaurants |
Understanding Airbnb License Requirements & STR Laws in North Legon (2026)
While North Legon, Greater Accra Region, Ghana currently shows low STR regulations, specific Airbnb license requirements might still exist or change. Always verify the latest short term rental regulations and Airbnb license requirements directly with local government authorities for North Legon to ensure full compliance before hosting.
(Source: AirROI data, 2026, finding no licensed listings among those analyzed)
Top Performing Airbnb Properties in North Legon (2026)
Benchmark your potential! Explore examples of top-performing Airbnb properties in North Legonbased on Trailing Twelve Month (TTM) revenue. Analyze their characteristics, revenue, occupancy rate, and ADR to understand what drives success in this market.
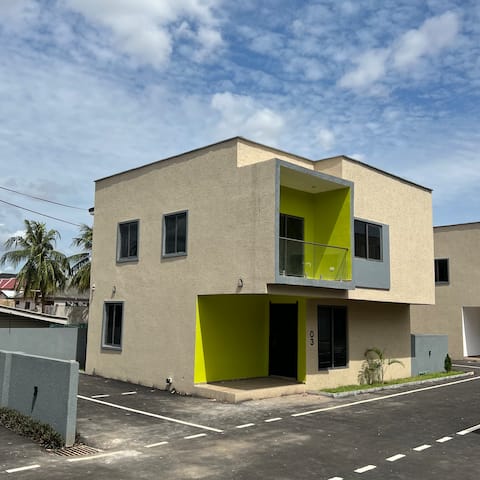
3 bedroom modern town home
Entire Place • 3 bedrooms
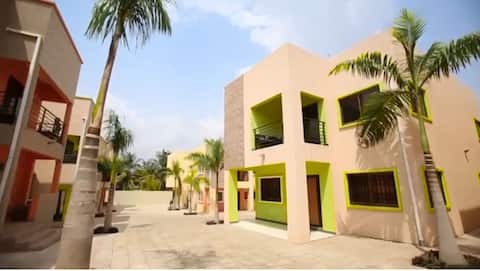
Luxurious four bedroom townhouse to let
Entire Place • 4 bedrooms
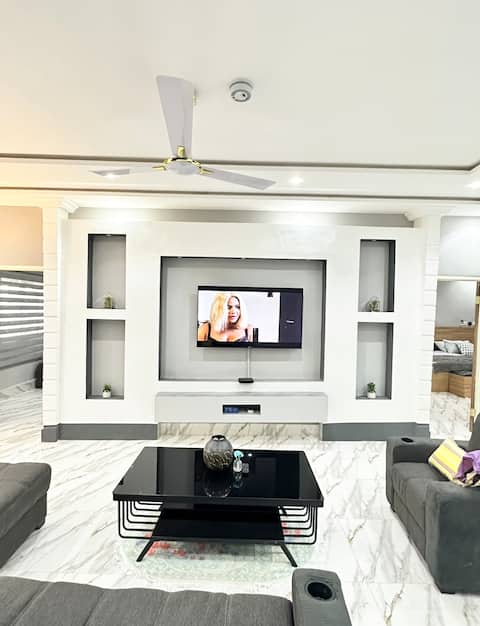
Luxury 2-bedroom ensuite in North Legon
Entire Place • 2 bedrooms
Deluxe 3-Bedroom Executive Suites
Entire Place • 3 bedrooms
Aion Suite 201 - Wi-Fi | Safe | Peaceful | Yard
Entire Place • 3 bedrooms
Bess Apartments
Entire Place • 3 bedrooms
Note: Performance varies based on location, size, amenities, seasonality, and management quality. Data reflects the past 12 months.
Top Performing Airbnb Hosts in North Legon (2026)
Learn from the best! This table showcases top-performing Airbnb hosts in North Legon based on the number of properties managed and estimated total revenue over the past year. Analyze their scale and performance metrics.
| Host Name | Properties | Grossing Revenue | Stay Reviews | Avg Rating |
|---|---|---|---|---|
| Kofi | 4 | $23,236 | 48 | 2.44/5.0 |
| Host #484921756 | 2 | $19,642 | 0 | 0.00/5.0 |
| Host #491634833 | 2 | $19,013 | 0 | 0.00/5.0 |
| Host #394423999 | 2 | $16,738 | 1 | 0.00/5.0 |
| Host #129368329 | 1 | $14,874 | 0 | 0.00/5.0 |
| Huzaif | 1 | $12,982 | 17 | 4.71/5.0 |
| Host #209272032 | 1 | $12,869 | 0 | 0.00/5.0 |
| Host #273841510 | 1 | $9,960 | 0 | 0.00/5.0 |
| Host #440294739 | 1 | $7,877 | 0 | 0.00/5.0 |
| Host #241660642 | 1 | $7,153 | 0 | 0.00/5.0 |
Analyzing the strategies of top hosts, such as their property selection, pricing, and guest communication, can offer valuable lessons for optimizing your own Airbnb operations in North Legon.
Dive Deeper: Advanced North Legon STR Market Data (2026)
Ready to unlock more insights? AirROI provides access to advanced metrics and comprehensive Airbnb data for North Legon. Explore detailed analytics beyond this report to refine your investment strategy, optimize pricing, and maximize your vacation rental profits.
Explore Advanced MetricsNorth Legon Short-Term Rental Market Composition (2026): Property & Room Types
Room Type Distribution
Property Type Distribution
Market Composition Insights for North Legon
- The North Legon Airbnb market composition is heavily skewed towards Entire Home/Apt listings, which make up 88% of the 25 active rentals. This indicates strong guest preference for privacy and space.
- Looking at the property type distribution in North Legon, Apartment/Condo properties are the most common (68%), reflecting the local real estate landscape.
- Houses represent a significant 28% portion, catering likely to families or larger groups.
- Smaller segments like hotel/boutique (combined 4.0%) offer potential for unique stay experiences.
North Legon Airbnb Room Capacity Analysis (2026): Bedroom Distribution
Distribution of Listings by Number of Bedrooms
Room Capacity Insights for North Legon
- The dominant room capacity in North Legon is 1 bedroom listings, making up 32% of the market. This suggests a strong demand for properties suitable for couples or solo travelers.
- Together, 1 bedroom and 3 bedrooms properties represent 64.0% of the active Airbnb listings in North Legon, indicating a high concentration in these sizes.
- A significant 40.0% of listings offer 3+ bedrooms, catering to larger groups and families seeking more space in North Legon.
North Legon Vacation Rental Guest Capacity Trends (2026)
Distribution of Listings by Guest Capacity
Guest Capacity Insights for North Legon
- The most common guest capacity trend in North Legon vacation rentals is listings accommodating 4 guests (32%). This suggests the primary traveler segment is likely small families or groups.
- Properties designed for 4 guests and 2 guests dominate the North Legon STR market, accounting for 64.0% of listings.
- 28.0% of properties accommodate 6+ guests, serving the market segment for larger families or group travel in North Legon.
- On average, properties in North Legon are equipped to host 4.0 guests.
North Legon Airbnb Booking Patterns (2026): Available vs. Booked Days
Available Days Distribution
Booked Days Distribution
Booking Pattern Insights for North Legon
- The most common availability pattern in North Legon falls within the 271-366 days range, representing 60% of listings. This suggests many properties have significant open periods on their calendars.
- Approximately 92.0% of listings show high availability (181+ days open annually), indicating potential for increased bookings or specific owner usage patterns.
- For booked days, the 31-90 days range is most frequent in North Legon (56%), reflecting common guest stay durations or potential owner blocking patterns.
- A notable 8.0% of properties secure long booking periods (181+ days booked per year), highlighting successful long-term rental strategies or significant owner usage.
North Legon Airbnb Minimum Stay Requirements Analysis
Distribution of Listings by Minimum Night Requirement
1 Night
12 listings
48% of total
2 Nights
2 listings
8% of total
3 Nights
5 listings
20% of total
4-6 Nights
1 listings
4% of total
30+ Nights
5 listings
20% of total
Key Insights
- The most prevalent minimum stay requirement in North Legon is 1 Night, adopted by 48% of listings. This highlights the market's preference for shorter, flexible bookings.
- A significant segment (20%) caters to monthly stays (30+ nights) in North Legon, pointing to opportunities in the extended-stay market.
Recommendations
- Align with the market by considering a 1 Night minimum stay, as 48% of North Legon hosts use this setting.
- Explore offering discounts for stays of 30+ nights to attract the 20% of the market seeking extended stays.
- Adjust minimum nights based on seasonality – potentially shorter during low season and longer during peak demand periods in North Legon.
North Legon Airbnb Cancellation Policy Trends Analysis (2026)
Flexible
7 listings
100% of total
Cancellation Policy Insights for North Legon
- The prevailing Airbnb cancellation policy trend in North Legon is Flexible, used by 100% of listings.
- The market strongly favors guest-friendly terms, with 100.0% of listings offering Flexible or Moderate policies. This suggests guests in North Legon may expect booking flexibility.
Recommendations for Hosts
- Consider adopting a Flexible policy to align with the 100% market standard in North Legon.
- Given the high prevalence of Flexible policies (100%), offering this can enhance booking appeal, especially during shoulder seasons.
- Regularly review your cancellation policy against competitors and market demand shifts in North Legon.
North Legon STR Booking Lead Time Analysis (2026)
Average Booking Lead Time by Month
Booking Lead Time Insights for North Legon
- The overall average booking lead time for vacation rentals in North Legon is 34 days.
- Guests book furthest in advance for stays during December (average 95 days), likely coinciding with peak travel demand or local events.
- The shortest booking windows occur for stays in September (average 5 days), indicating more last-minute travel plans during this time.
- Seasonally, Winter (73 days avg.) sees the longest lead times, while Spring (12 days avg.) has the shortest, reflecting typical travel planning cycles.
Recommendations for Hosts
- Use the overall average lead time (34 days) as a baseline for your pricing and availability strategy in North Legon.
- For December stays, consider implementing length-of-stay discounts or slightly higher rates for bookings made less than 95 days out to capitalize on advance planning.
- During September, focus on last-minute booking availability and promotions, as guests book with very short notice (5 days avg.).
- Target marketing efforts for the Winter season well in advance (at least 73 days) to capture early planners.
- Monitor your own booking lead times against these North Legon averages to identify opportunities for dynamic pricing adjustments.
Popular & Essential Airbnb Amenities in North Legon (2026)
Amenity Prevalence
Amenity Insights for North Legon
- Essential amenities in North Legon that guests expect include: Air conditioning, Wifi, TV, Kitchen, Free parking on premises. Lacking these (any) could significantly impact bookings.
- Popular amenities like Washer, Hot water, Essentials are common but not universal. Offering these can provide a competitive edge.
Recommendations for Hosts
- Ensure your listing includes all essential amenities for North Legon: Air conditioning, Wifi, TV, Kitchen, Free parking on premises.
- Prioritize adding missing essentials: Free parking on premises.
- Consider adding popular differentiators like Washer or Hot water to increase appeal.
- Highlight unique or less common amenities you offer (e.g., hot tub, dedicated workspace, EV charger) in your listing description and photos.
- Regularly check competitor amenities in North Legon to stay competitive.
North Legon Airbnb Guest Demographics & Profile Analysis (2026)
Guest Profile Summary for North Legon
- The typical guest profile for Airbnb in North Legon consists of predominantly international visitors (70%), with top international origins including Ghana, typically belonging to the Post-2000s (Gen Z/Alpha) group (50%), primarily speaking English or French.
- Domestic travelers account for 30.4% of guests.
- Key international markets include United States (34.8%) and Ghana (30.4%).
- Top languages spoken are English (75%) followed by French (10.7%).
- A significant demographic segment is the Post-2000s (Gen Z/Alpha) group, representing 50% of guests.
Recommendations for Hosts
- Focus marketing internationally, particularly towards travelers from Ghana.
- Tailor amenities and listing descriptions to appeal to the dominant Post-2000s (Gen Z/Alpha) demographic (e.g., highlight fast WiFi, smart home features, local guides).
- Highlight unique local experiences or amenities relevant to the primary guest profile.
- Consider seasonal promotions aligned with peak travel times for key origin markets.
Nearby Short-Term Rental Market Comparison
How does the North Legon Airbnb market stack up against its neighbors? Compare key performance metrics like average monthly revenue, ADR, and occupancy rates in surrounding areas to understand the broader regional STR landscape.
| Market | Active Properties | Monthly Revenue | Daily Rate | Avg. Occupancy |
|---|---|---|---|---|
| East Legon Hills | 19 | $1,305 | $185.32 | 28% |
| Agbogba | 55 | $997 | $174.45 | 27% |
| Greater Accra Region | 29 | $909 | $156.07 | 25% |
| Haatso | 48 | $799 | $105.78 | 25% |
| Adenta Municipal | 76 | $797 | $121.45 | 28% |
| Accra | 3,099 | $759 | $109.95 | 29% |
| Prampram | 19 | $749 | $174.29 | 20% |
| Kokrobite | 47 | $725 | $119.74 | 20% |
| Takoradi | 16 | $617 | $82.44 | 20% |
| Elmina | 13 | $602 | $106.08 | 23% |