Adamantas Airbnb Market Analysis 2026: Short Term Rental Data & Vacation Rental Statistics in Aegean, Greece
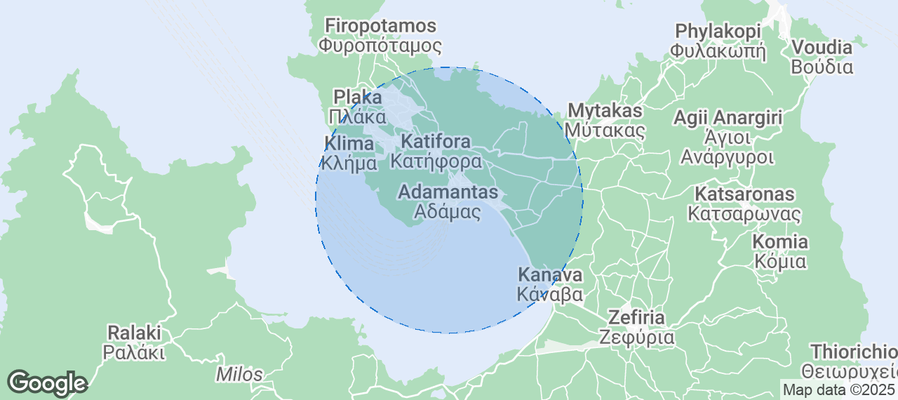
Is Airbnb profitable in Adamantas in 2026? Explore comprehensive Airbnb analytics for Adamantas, Aegean, Greece to uncover income potential. This 2026 STR market report for Adamantas, based on AirROI data from February 2025 to January 2026, reveals key trends in the market of 429 active listings.
Whether you're considering an Airbnb investment in Adamantas, optimizing your existing vacation rental, or exploring rental arbitrage opportunities, understanding the Adamantas Airbnb data is crucial. Navigating the high regulation landscape is key to maximizing your short term rental income potential. Let's dive into the specifics.
Key Adamantas Airbnb Performance Metrics Overview
Monthly Airbnb Revenue Variations & Income Potential in Adamantas (2026)
Understanding the monthly revenue variations for Airbnb listings in Adamantas is key to maximizing your short term rental income potential. Seasonality significantly impacts earnings. Our analysis, based on data from the past 12 months, shows that the peak revenue month for STRs in Adamantas is typically August, while December often presents the lowest earnings, highlighting opportunities for strategic pricing adjustments during shoulder and low seasons. Explore the typical Airbnb income in Adamantas across different performance tiers:
- Best-in-class properties (Top 10%) achieve $5,765+ monthly, often utilizing dynamic pricing and superior guest experiences.
- Strong performing properties (Top 25%) earn $3,714 or more, indicating effective management and desirable locations/amenities.
- Typical properties (Median) generate around $2,354 per month, representing the average market performance.
- Entry-level properties (Bottom 25%) see earnings around $1,477, often with potential for optimization.
Average Monthly Airbnb Earnings Trend in Adamantas
Adamantas Airbnb Occupancy Rate Trends (2026)
Maximize your bookings by understanding the Adamantas STR occupancy trends. Seasonal demand shifts significantly influence how often properties are booked. Typically, Augustsees the highest demand (peak season occupancy), while December experiences the lowest (low season). Effective strategies, like adjusting minimum stays or offering promotions, can boost occupancy during slower periods. Here's how different property tiers perform in Adamantas:
- Best-in-class properties (Top 10%) achieve 80%+ occupancy, indicating high desirability and potentially optimized availability.
- Strong performing properties (Top 25%) maintain 65% or higher occupancy, suggesting good market fit and guest satisfaction.
- Typical properties (Median) have an occupancy rate around 46%.
- Entry-level properties (Bottom 25%) average 28% occupancy, potentially facing higher vacancy.
Average Monthly Occupancy Rate Trend in Adamantas
Average Daily Rate (ADR) Airbnb Trends in Adamantas (2026)
Effective short term rental pricing strategy in Adamantas involves understanding monthly ADR fluctuations. The Average Daily Rate (ADR) for Airbnb in Adamantas typically peaks in August and dips lowest during April. Leveraging Airbnb dynamic pricing tools or strategies based on this seasonality can significantly boost revenue. Here's a look at the typical nightly rates achieved:
- Best-in-class properties (Top 10%) command rates of $375+ per night, often due to premium features or locations.
- Strong performing properties (Top 25%) achieve nightly rates of $255 or more.
- Typical properties (Median) charge around $168 per night.
- Entry-level properties (Bottom 25%) earn around $116 per night.
Average Daily Rate (ADR) Trend by Month in Adamantas
Get Live Adamantas Market Intelligence 👇
Explore Real-time Analytics
Airbnb Seasonality Analysis & Trends in Adamantas (2026)
Peak Season (August, July, September)
- Revenue averages $6,109 per month
- Occupancy rates average 71.1%
- Daily rates average $277
Shoulder Season
- Revenue averages $2,402 per month
- Occupancy maintains around 42.1%
- Daily rates hold near $196
Low Season (February, November, December)
- Revenue drops to average $1,139 per month
- Occupancy decreases to average 29.2%
- Daily rates adjust to average $190
Seasonality Insights for Adamantas
- The Airbnb seasonality in Adamantas shows highly seasonal trends requiring careful strategy. While the sections above show seasonal averages, it's also insightful to look at the extremes:
- During the high season, the absolute peak month showcases Adamantas's highest earning potential, with monthly revenues capable of climbing to $7,109, occupancy reaching a high of 75.4%, and ADRs peaking at $297.
- Conversely, the slowest single month of the year, typically falling within the low season, marks the market's lowest point. In this month, revenue might dip to $771, occupancy could drop to 22.7%, and ADRs may adjust down to $176.
- Understanding both the seasonal averages and these monthly peaks and troughs in revenue, occupancy, and ADR is crucial for maximizing your Airbnb profit potential in Adamantas.
Seasonal Strategies for Maximizing Profit
- Peak Season: Maximize revenue through premium pricing and potentially longer minimum stays. Ensure high availability.
- Low Season: Offer competitive pricing, special promotions (e.g., extended stay discounts), and flexible cancellation policies. Target off-season travelers like remote workers or budget-conscious guests.
- Shoulder Seasons: Implement dynamic pricing that balances peak and low rates. Target weekend travelers or specific events. Offer slightly more flexible terms than peak season.
- Regularly analyze your own performance against these Adamantas seasonality benchmarks and adjust your pricing and availability strategy accordingly.
Best Areas for Airbnb Investment in Adamantas (2026)
Exploring the top neighborhoods for short-term rentals in Adamantas? This section highlights key areas, outlining why they are attractive for hosts and guests, along with notable local attractions. Consider these locations based on your target guest profile and investment strategy.
| Neighborhood / Area | Why Host Here? (Target Guests & Appeal) | Key Attractions & Landmarks |
|---|---|---|
| Adamantas Harbor | The main hub of Milos, Adamantas Harbor is where most tourists arrive. It features a vibrant atmosphere with shops, restaurants, and easy access to boat tours and beaches. Ideal for attracting visitors who want convenience and accessibility to activities. | Milos Mining Museum, Boat Trips to Kleftiko, Beaches like Papikinos Beach, Restaurants along the waterfront |
| Plaka | The picturesque capital of Milos, Plaka offers stunning sunsets, traditional Cycladic architecture, and charming narrow streets. It's a must-visit for tourists, making it great for Airbnb hosting. | Plaka Castle, The Archaeological Museum of Milos, Catacombs of Milos, Windmills of Plaka |
| Pollonia | A charming fishing village with a relaxed vibe and beautiful beaches. Pollonia is popular for its amazing seafood and proximity to the island of Kimolos, making it attractive for visitors seeking tranquility. | Pollonia Beach, Restaurants like Alevropoulos, Boat trips to Kimolos |
| Sarakiniko | Famous for its unique lunar landscape and white volcanic rocks, Sarakiniko is a top tourist attraction. Visitors come here for the stunning beach and photography opportunities, making it perfect for hosting. | Sarakiniko Beach, Volcanic rock formations, Sunbathing spots, Swimming areas |
| Firopotamos | A quiet beach area that features traditional architecture and a serene environment, appealing to couples and families looking for relaxation away from the busier spots. | Firopotamos Beach, Secluded swimming areas, Local tavernas |
| Tsigrado | Known for its beautiful beach surrounded by steep cliffs, Tsigrado appeals to adventurous travelers. It requires a bit of a hike to reach, making it popular for those seeking a unique experience. | Tsigrado Beach, Hiking trails, Scenic views |
| Kleftiko | Accessible mainly by boat, Kleftiko is famous for its dramatic rock formations and clear waters. It's a popular day-trip destination from Adamantas, making it essential for Airbnb hosts to provide information about visiting. | Kleftiko Beach, Boat tours, Snorkeling spots |
| Gerakas | A lesser-known beach area that offers stunning views and a peaceful atmosphere. It's ideal for travelers looking for a hidden gem on the island, thus attracting a niche market for Airbnb. | Gerakas Beach, Scenic hiking trails, Local wildlife |
Understanding Airbnb License Requirements & STR Laws in Adamantas (2026)
Yes, Adamantas, Aegean, Greece enforces high STR regulations. Obtaining a license and ensuring compliance is almost certainly required according to current 2026 STR laws. Always verify the latest short term rental regulations and Airbnb license requirements directly with local government authorities for Adamantas to ensure full compliance before hosting.
(Source: AirROI data, 2026, based on 95% licensed listings)
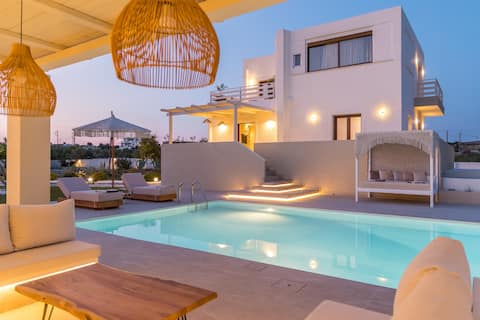
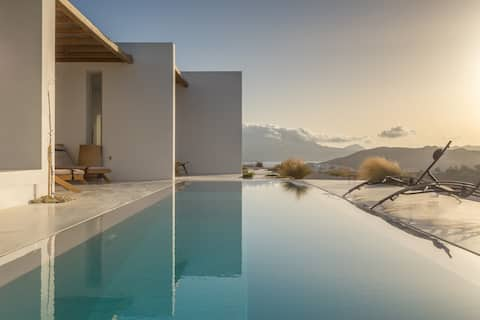
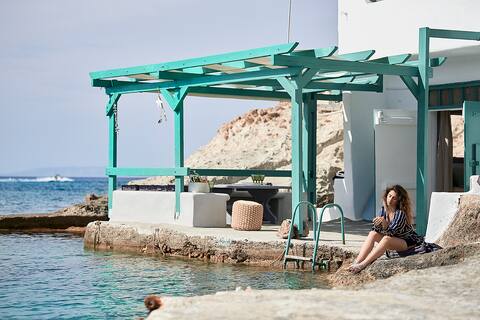
Top Performing Airbnb Properties in Adamantas (2026)
Benchmark your potential! Explore examples of top-performing Airbnb properties in Adamantasbased on Trailing Twelve Month (TTM) revenue. Analyze their characteristics, revenue, occupancy rate, and ADR to understand what drives success in this market.
Villa Eva By Milos Concierge
Entire Place • 4 bedrooms

White Villa Milos
Entire Place • 3 bedrooms
THEIA VILLA
Entire Place • 3 bedrooms
Terra Mare Milos-Suite with Sea View-Ground Floor
Entire Place • 1 bedroom
Beautiful Villa Amazing Sea View!
Entire Place • 3 bedrooms

Scylla Concept Suites with Private Swimming Pool 1
Entire Place • 1 bedroom
Note: Performance varies based on location, size, amenities, seasonality, and management quality. Data reflects the past 12 months.
Top Performing Airbnb Hosts in Adamantas (2026)
Learn from the best! This table showcases top-performing Airbnb hosts in Adamantas based on the number of properties managed and estimated total revenue over the past year. Analyze their scale and performance metrics.
| Host Name | Properties | Grossing Revenue | Stay Reviews | Avg Rating |
|---|---|---|---|---|
| Nikos | 30 | $753,914 | 1026 | 4.81/5.0 |
| Konstantinos | 5 | $293,496 | 34 | 5.00/5.0 |
| Andreas Ballas, Milos Concierg | 2 | $280,175 | 75 | 4.94/5.0 |
| Thomas | 3 | $262,801 | 45 | 4.94/5.0 |
| Filio | 4 | $216,506 | 249 | 4.98/5.0 |
| Faye | 5 | $214,014 | 267 | 4.94/5.0 |
| Dionisis | 10 | $204,094 | 372 | 4.80/5.0 |
| MilosGreece | 15 | $200,035 | 101 | 4.33/5.0 |
| Maria | 9 | $179,974 | 764 | 4.86/5.0 |
| Dafni | 1 | $173,498 | 104 | 4.89/5.0 |
Analyzing the strategies of top hosts, such as their property selection, pricing, and guest communication, can offer valuable lessons for optimizing your own Airbnb operations in Adamantas.
Dive Deeper: Advanced Adamantas STR Market Data (2026)
Ready to unlock more insights? AirROI provides access to advanced metrics and comprehensive Airbnb data for Adamantas. Explore detailed analytics beyond this report to refine your investment strategy, optimize pricing, and maximize your vacation rental profits.
Explore Advanced MetricsAdamantas Short-Term Rental Market Composition (2026): Property & Room Types
Room Type Distribution
Property Type Distribution
Market Composition Insights for Adamantas
- The Adamantas Airbnb market composition is heavily skewed towards Entire Home/Apt listings, which make up 81.1% of the 429 active rentals. This indicates strong guest preference for privacy and space.
- Looking at the property type distribution in Adamantas, Apartment/Condo properties are the most common (51.5%), reflecting the local real estate landscape.
- Houses represent a significant 36.1% portion, catering likely to families or larger groups.
- The presence of 11.2% Hotel/Boutique listings indicates integration with traditional hospitality.
- Smaller segments like unique stays, others (combined 1.2%) offer potential for unique stay experiences.
Adamantas Airbnb Room Capacity Analysis (2026): Bedroom Distribution
Distribution of Listings by Number of Bedrooms
Room Capacity Insights for Adamantas
- The dominant room capacity in Adamantas is 1 bedroom listings, making up 61.5% of the market. This suggests a strong demand for properties suitable for couples or solo travelers.
- Together, 1 bedroom and 2 bedrooms properties represent 85.3% of the active Airbnb listings in Adamantas, indicating a high concentration in these sizes.
- With over half the market (61.5%) consisting of studios or 1-bedroom units, Adamantas is particularly well-suited for individuals or couples.
- Listings with 3+ bedrooms (3.9%) represent a smaller niche, potentially indicating an underserved market for larger group accommodations in Adamantas.
Adamantas Vacation Rental Guest Capacity Trends (2026)
Distribution of Listings by Guest Capacity
Guest Capacity Insights for Adamantas
- The most common guest capacity trend in Adamantas vacation rentals is listings accommodating 2 guests (37.1%). This suggests the primary traveler segment is likely couples or solo travelers.
- Properties designed for 2 guests and 3 guests dominate the Adamantas STR market, accounting for 57.8% of listings.
- On average, properties in Adamantas are equipped to host 3.2 guests.
Adamantas Airbnb Booking Patterns (2026): Available vs. Booked Days
Available Days Distribution
Booked Days Distribution
Booking Pattern Insights for Adamantas
- The most common availability pattern in Adamantas falls within the 181-270 days range, representing 50.6% of listings. This suggests many properties have significant open periods on their calendars.
- Approximately 87.2% of listings show high availability (181+ days open annually), indicating potential for increased bookings or specific owner usage patterns.
- For booked days, the 91-180 days range is most frequent in Adamantas (49.9%), reflecting common guest stay durations or potential owner blocking patterns.
- A notable 14.7% of properties secure long booking periods (181+ days booked per year), highlighting successful long-term rental strategies or significant owner usage.
Adamantas Airbnb Minimum Stay Requirements Analysis
Distribution of Listings by Minimum Night Requirement
1 Night
40 listings
9.3% of total
2 Nights
68 listings
15.9% of total
3 Nights
21 listings
4.9% of total
4-6 Nights
10 listings
2.3% of total
30+ Nights
290 listings
67.6% of total
Key Insights
- The most prevalent minimum stay requirement in Adamantas is 30+ Nights, adopted by 67.6% of listings. This highlights the market's preference for longer commitments.
- A significant segment (67.6%) caters to monthly stays (30+ nights) in Adamantas, pointing to opportunities in the extended-stay market.
Recommendations
- Align with the market by considering a 30+ Nights minimum stay, as 67.6% of Adamantas hosts use this setting.
- If feasible, allowing 1-night stays, especially midweek or during low season, could capture last-minute bookings, as only 9.3% currently do.
- Explore offering discounts for stays of 30+ nights to attract the 67.6% of the market seeking extended stays.
- Adjust minimum nights based on seasonality – potentially shorter during low season and longer during peak demand periods in Adamantas.
Adamantas Airbnb Cancellation Policy Trends Analysis (2026)
Super Strict 30 Days
25 listings
5.8% of total
Limited
6 listings
1.4% of total
Super Strict 60 Days
4 listings
0.9% of total
Flexible
28 listings
6.5% of total
Moderate
25 listings
5.8% of total
Firm
258 listings
60.1% of total
Strict
83 listings
19.3% of total
Cancellation Policy Insights for Adamantas
- The prevailing Airbnb cancellation policy trend in Adamantas is Firm, used by 60.1% of listings.
- A majority (79.4%) of hosts in Adamantas utilize Firm or Strict policies, indicating a market where hosts prioritize booking security.
Recommendations for Hosts
- Consider adopting a Firm policy to align with the 60.1% market standard in Adamantas.
- Regularly review your cancellation policy against competitors and market demand shifts in Adamantas.
Adamantas STR Booking Lead Time Analysis (2026)
Average Booking Lead Time by Month
Booking Lead Time Insights for Adamantas
- The overall average booking lead time for vacation rentals in Adamantas is 74 days.
- Guests book furthest in advance for stays during August (average 97 days), likely coinciding with peak travel demand or local events.
- The shortest booking windows occur for stays in January (average 34 days), indicating more last-minute travel plans during this time.
- Seasonally, Summer (86 days avg.) sees the longest lead times, while Winter (45 days avg.) has the shortest, reflecting typical travel planning cycles.
Recommendations for Hosts
- Use the overall average lead time (74 days) as a baseline for your pricing and availability strategy in Adamantas.
- For August stays, consider implementing length-of-stay discounts or slightly higher rates for bookings made less than 97 days out to capitalize on advance planning.
- Target marketing efforts for the Summer season well in advance (at least 86 days) to capture early planners.
- Monitor your own booking lead times against these Adamantas averages to identify opportunities for dynamic pricing adjustments.
Popular & Essential Airbnb Amenities in Adamantas (2026)
Amenity Prevalence
Amenity Insights for Adamantas
- Essential amenities in Adamantas that guests expect include: Wifi, Air conditioning, TV. Lacking these (any) could significantly impact bookings.
- Popular amenities like Hair dryer, Hot water, Hangers are common but not universal. Offering these can provide a competitive edge.
Recommendations for Hosts
- Ensure your listing includes all essential amenities for Adamantas: Wifi, Air conditioning, TV.
- Prioritize adding missing essentials: Wifi, Air conditioning, TV.
- Consider adding popular differentiators like Hair dryer or Hot water to increase appeal.
- Highlight unique or less common amenities you offer (e.g., hot tub, dedicated workspace, EV charger) in your listing description and photos.
- Regularly check competitor amenities in Adamantas to stay competitive.
Adamantas Airbnb Guest Demographics & Profile Analysis (2026)
Guest Profile Summary for Adamantas
- The typical guest profile for Airbnb in Adamantas consists of predominantly international visitors (99%), with top international origins including Australia, typically belonging to the Post-2000s (Gen Z/Alpha) group (50%), primarily speaking English or French.
- Domestic travelers account for 1.2% of guests.
- Key international markets include United States (33.8%) and Australia (17.6%).
- Top languages spoken are English (54.1%) followed by French (12.5%).
- A significant demographic segment is the Post-2000s (Gen Z/Alpha) group, representing 50% of guests.
Recommendations for Hosts
- Focus marketing internationally, particularly towards travelers from Australia.
- Tailor amenities and listing descriptions to appeal to the dominant Post-2000s (Gen Z/Alpha) demographic (e.g., highlight fast WiFi, smart home features, local guides).
- Highlight unique local experiences or amenities relevant to the primary guest profile.
- Consider seasonal promotions aligned with peak travel times for key origin markets.
Nearby Short-Term Rental Market Comparison
How does the Adamantas Airbnb market stack up against its neighbors? Compare key performance metrics like average monthly revenue, ADR, and occupancy rates in surrounding areas to understand the broader regional STR landscape.
| Market | Active Properties | Monthly Revenue | Daily Rate | Avg. Occupancy |
|---|---|---|---|---|
| Violi Charaki | 21 | $7,037 | $480.16 | 55% |
| Amnatos | 15 | $5,946 | $730.78 | 48% |
| Skaleta | 57 | $5,258 | $581.34 | 48% |
| Viranepiskopi | 11 | $4,940 | $322.10 | 65% |
| Perama | 27 | $4,927 | $392.67 | 52% |
| Pithari | 22 | $4,920 | $412.56 | 55% |
| Faros Armenistis | 119 | $4,791 | $715.43 | 41% |
| Xiro Chorio | 20 | $4,573 | $393.88 | 51% |
| Nea Magnisia | 22 | $4,332 | $392.45 | 52% |
| Municipality of Milopotamos | 20 | $3,882 | $348.22 | 51% |