Alinda Airbnb Market Analysis 2026: Short Term Rental Data & Vacation Rental Statistics in Aegean, Greece
Is Airbnb profitable in Alinda in 2026? Explore comprehensive Airbnb analytics for Alinda, Aegean, Greece to uncover income potential. This 2026 STR market report for Alinda, based on AirROI data from February 2025 to January 2026, reveals key trends in the niche market of 25 active listings.
Whether you're considering an Airbnb investment in Alinda, optimizing your existing vacation rental, or exploring rental arbitrage opportunities, understanding the Alinda Airbnb data is crucial. Navigating the high regulation landscape is key to maximizing your short term rental income potential. Let's dive into the specifics.
Key Alinda Airbnb Performance Metrics Overview
Monthly Airbnb Revenue Variations & Income Potential in Alinda (2026)
Understanding the monthly revenue variations for Airbnb listings in Alinda is key to maximizing your short term rental income potential. Seasonality significantly impacts earnings. Our analysis, based on data from the past 12 months, shows that the peak revenue month for STRs in Alinda is typically August, while December often presents the lowest earnings, highlighting opportunities for strategic pricing adjustments during shoulder and low seasons. Explore the typical Airbnb income in Alinda across different performance tiers:
- Best-in-class properties (Top 10%) achieve $2,689+ monthly, often utilizing dynamic pricing and superior guest experiences.
- Strong performing properties (Top 25%) earn $1,769 or more, indicating effective management and desirable locations/amenities.
- Typical properties (Median) generate around $1,024 per month, representing the average market performance.
- Entry-level properties (Bottom 25%) see earnings around $625, often with potential for optimization.
Average Monthly Airbnb Earnings Trend in Alinda
Alinda Airbnb Occupancy Rate Trends (2026)
Maximize your bookings by understanding the Alinda STR occupancy trends. Seasonal demand shifts significantly influence how often properties are booked. Typically, Marchsees the highest demand (peak season occupancy), while December experiences the lowest (low season). Effective strategies, like adjusting minimum stays or offering promotions, can boost occupancy during slower periods. Here's how different property tiers perform in Alinda:
- Best-in-class properties (Top 10%) achieve 48%+ occupancy, indicating high desirability and potentially optimized availability.
- Strong performing properties (Top 25%) maintain 37% or higher occupancy, suggesting good market fit and guest satisfaction.
- Typical properties (Median) have an occupancy rate around 25%.
- Entry-level properties (Bottom 25%) average 16% occupancy, potentially facing higher vacancy.
Average Monthly Occupancy Rate Trend in Alinda
Average Daily Rate (ADR) Airbnb Trends in Alinda (2026)
Effective short term rental pricing strategy in Alinda involves understanding monthly ADR fluctuations. The Average Daily Rate (ADR) for Airbnb in Alinda typically peaks in September and dips lowest during March. Leveraging Airbnb dynamic pricing tools or strategies based on this seasonality can significantly boost revenue. Here's a look at the typical nightly rates achieved:
- Best-in-class properties (Top 10%) command rates of $278+ per night, often due to premium features or locations.
- Strong performing properties (Top 25%) achieve nightly rates of $178 or more.
- Typical properties (Median) charge around $108 per night.
- Entry-level properties (Bottom 25%) earn around $77 per night.
Average Daily Rate (ADR) Trend by Month in Alinda
Get Live Alinda Market Intelligence 👇

Explore Real-time Analytics
Airbnb Seasonality Analysis & Trends in Alinda (2026)
Peak Season (August, March, July)
- Revenue averages $2,409 per month
- Occupancy rates average 45.0%
- Daily rates average $138
Shoulder Season
- Revenue averages $1,009 per month
- Occupancy maintains around 23.7%
- Daily rates hold near $135
Low Season (January, November, December)
- Revenue drops to average $79 per month
- Occupancy decreases to average 1.1%
- Daily rates adjust to average $149
Seasonality Insights for Alinda
- The Airbnb seasonality in Alinda shows highly seasonal trends requiring careful strategy. While the sections above show seasonal averages, it's also insightful to look at the extremes:
- During the high season, the absolute peak month showcases Alinda's highest earning potential, with monthly revenues capable of climbing to $2,634, occupancy reaching a high of 48.4%, and ADRs peaking at $156.
- Conversely, the slowest single month of the year, typically falling within the low season, marks the market's lowest point. In this month, revenue might dip to $0, occupancy could drop to 0.0%, and ADRs may adjust down to $122.
- Understanding both the seasonal averages and these monthly peaks and troughs in revenue, occupancy, and ADR is crucial for maximizing your Airbnb profit potential in Alinda.
Seasonal Strategies for Maximizing Profit
- Peak Season: Maximize revenue through premium pricing and potentially longer minimum stays. Ensure high availability.
- Low Season: Offer competitive pricing, special promotions (e.g., extended stay discounts), and flexible cancellation policies. Target off-season travelers like remote workers or budget-conscious guests.
- Shoulder Seasons: Implement dynamic pricing that balances peak and low rates. Target weekend travelers or specific events. Offer slightly more flexible terms than peak season.
- Regularly analyze your own performance against these Alinda seasonality benchmarks and adjust your pricing and availability strategy accordingly.
Best Areas for Airbnb Investment in Alinda (2026)
Exploring the top neighborhoods for short-term rentals in Alinda? This section highlights key areas, outlining why they are attractive for hosts and guests, along with notable local attractions. Consider these locations based on your target guest profile and investment strategy.
| Neighborhood / Area | Why Host Here? (Target Guests & Appeal) | Key Attractions & Landmarks |
|---|---|---|
| Alinda Beach | Beautiful beach area known for its crystal clear waters and sandy shoreline. Ideal for tourists looking to relax, swim, and enjoy water sports in a picturesque setting. | Alinda Beach, Aghios Georgios, Aghia Marina Beach, Aegean Sea views, Nearby tavernas and cafes |
| Kastellorizo | A stunning island known for its vivid blue waters and charming harbor. It's a perfect getaway for those seeking tranquility and stunning scenery, popular with travelers looking for a unique experience. | Kastellorizo Harbor, Blue Cave, Palaiokastro, Local seafood restaurants, Scenic hiking trails |
| Vromolithos | An area renowned for its serene beaches and natural beauty. Ideal for families and couples who want a peaceful vacation, with plenty of opportunities for swimming and relaxation. | Vromolithos Beach, Taverns with sea views, Scenic walking paths, Beachside activities |
| Leros Town (Platanos) | The main town of Leros, featuring traditional Greek architecture and vibrant local life. Attracts visitors who want to experience local culture and history, with various shops and restaurants. | Castle of the Virgin Mary, Traditional tavernas, Local markets, Shopping streets, Historical museums |
| Kokkali Beach | A less crowded beach that offers a more local experience with beautiful landscapes. Great for travelers looking for an authentic and relaxing beach day. | Kokkali Beach, Nearby hiking paths, Local eateries, Calm and clear waters |
| Alinda Village | A charming village near the beach, perfect for visitors who want to experience local life. It's family-friendly and offers access to scenic viewpoints and cultural sites. | Alinda Village square, Local cafes, Cultural festivals, Viewpoints over the sea |
| Agia Marina | A popular spot known for its lively atmosphere and proximity to local attractions. It attracts younger crowds and those seeking an active nightlife and local dining experiences. | Agia Marina Beach, Bars and nightlife, Water activities, Cafes by the beach |
| Bounali Beach | A serene and secluded beach perfect for those seeking solitude, ideal for couples and anyone looking to unwind in a tranquil beach environment. | Bounali Beach, Rock formations, Quiet surroundings, Crystal clear waters |
Understanding Airbnb License Requirements & STR Laws in Alinda (2026)
Yes, Alinda, Aegean, Greece enforces high STR regulations. Obtaining a license and ensuring compliance is almost certainly required according to current 2026 STR laws. Always verify the latest short term rental regulations and Airbnb license requirements directly with local government authorities for Alinda to ensure full compliance before hosting.
(Source: AirROI data, 2026, based on 88% licensed listings)
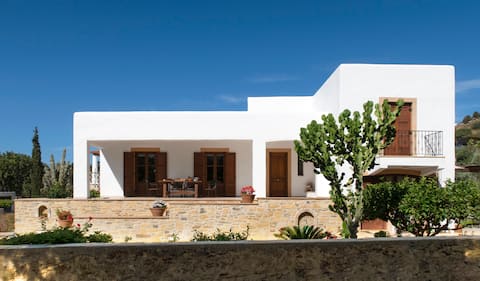
Top Performing Airbnb Properties in Alinda (2026)
Benchmark your potential! Explore examples of top-performing Airbnb properties in Alindabased on Trailing Twelve Month (TTM) revenue. Analyze their characteristics, revenue, occupancy rate, and ADR to understand what drives success in this market.
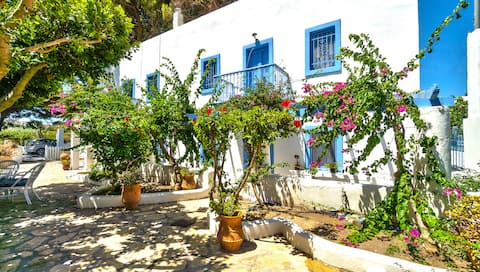
Polixeni's
Entire Place • 3 bedrooms
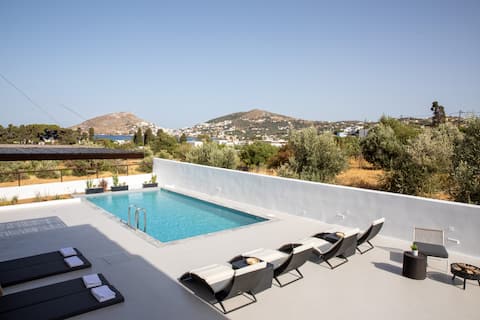
Serenity Bay, Pool, Sun, Sea and Magnificent View
Entire Place • 2 bedrooms
Lemon Cottage w/ Swimmingpool
Entire Place • 1 bedroom
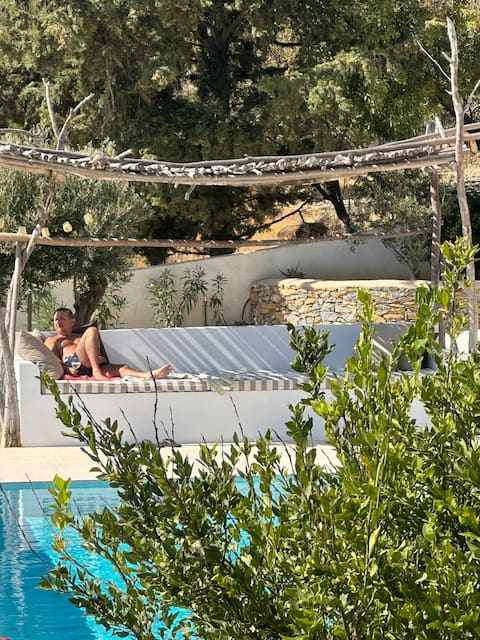
Pleiades a Greek Farmhouse Paradise in Alinda Bay
Entire Place • 2 bedrooms

Villa Anna
Entire Place • 2 bedrooms

Marilen Apartments studio
Private Room • N/A
Note: Performance varies based on location, size, amenities, seasonality, and management quality. Data reflects the past 12 months.
Top Performing Airbnb Hosts in Alinda (2026)
Learn from the best! This table showcases top-performing Airbnb hosts in Alinda based on the number of properties managed and estimated total revenue over the past year. Analyze their scale and performance metrics.
| Host Name | Properties | Grossing Revenue | Stay Reviews | Avg Rating |
|---|---|---|---|---|
| Alin Stefani | 1 | $31,372 | 3 | 5.00/5.0 |
| Alexandros | 1 | $13,186 | 1 | Not Rated |
| Gunnar Lossius | 1 | $11,231 | 11 | 4.91/5.0 |
| Francesca | 4 | $11,054 | 5 | Not Rated |
| Maria Anastasia | 1 | $10,998 | 7 | 4.86/5.0 |
| Ευγενια | 1 | $10,009 | 2 | Not Rated |
| Lena | 1 | $9,699 | 2 | Not Rated |
| Panos | 3 | $6,567 | 32 | 4.90/5.0 |
| Sonia | 1 | $6,125 | 3 | 5.00/5.0 |
| Κατερίνα | 1 | $5,806 | 9 | 4.56/5.0 |
Analyzing the strategies of top hosts, such as their property selection, pricing, and guest communication, can offer valuable lessons for optimizing your own Airbnb operations in Alinda.
Dive Deeper: Advanced Alinda STR Market Data (2026)
Ready to unlock more insights? AirROI provides access to advanced metrics and comprehensive Airbnb data for Alinda. Explore detailed analytics beyond this report to refine your investment strategy, optimize pricing, and maximize your vacation rental profits.
Explore Advanced MetricsAlinda Short-Term Rental Market Composition (2026): Property & Room Types
Room Type Distribution
Property Type Distribution
Market Composition Insights for Alinda
- The Alinda Airbnb market composition is heavily skewed towards Entire Home/Apt listings, which make up 76% of the 25 active rentals. This indicates strong guest preference for privacy and space.
- Looking at the property type distribution in Alinda, Apartment/Condo properties are the most common (44%), reflecting the local real estate landscape.
- Houses represent a significant 36% portion, catering likely to families or larger groups.
- The presence of 20% Hotel/Boutique listings indicates integration with traditional hospitality.
Alinda Airbnb Room Capacity Analysis (2026): Bedroom Distribution
Distribution of Listings by Number of Bedrooms
Room Capacity Insights for Alinda
- The dominant room capacity in Alinda is 1 bedroom listings, making up 48% of the market. This suggests a strong demand for properties suitable for couples or solo travelers.
- Together, 1 bedroom and 2 bedrooms properties represent 72.0% of the active Airbnb listings in Alinda, indicating a high concentration in these sizes.
Alinda Vacation Rental Guest Capacity Trends (2026)
Distribution of Listings by Guest Capacity
Guest Capacity Insights for Alinda
- The most common guest capacity trend in Alinda vacation rentals is listings accommodating 2 guests (40%). This suggests the primary traveler segment is likely couples or solo travelers.
- Properties designed for 2 guests and 6 guests dominate the Alinda STR market, accounting for 64.0% of listings.
- 24.0% of properties accommodate 6+ guests, serving the market segment for larger families or group travel in Alinda.
- On average, properties in Alinda are equipped to host 3.4 guests.
Alinda Airbnb Booking Patterns (2026): Available vs. Booked Days
Available Days Distribution
Booked Days Distribution
Booking Pattern Insights for Alinda
- The most common availability pattern in Alinda falls within the 271-366 days range, representing 96% of listings. This suggests many properties have significant open periods on their calendars.
- Approximately 100.0% of listings show high availability (181+ days open annually), indicating potential for increased bookings or specific owner usage patterns.
- For booked days, the 1-30 days range is most frequent in Alinda (52%), reflecting common guest stay durations or potential owner blocking patterns.
Alinda Airbnb Minimum Stay Requirements Analysis
Distribution of Listings by Minimum Night Requirement
1 Night
5 listings
20% of total
2 Nights
3 listings
12% of total
3 Nights
4 listings
16% of total
4-6 Nights
2 listings
8% of total
30+ Nights
11 listings
44% of total
Key Insights
- The most prevalent minimum stay requirement in Alinda is 30+ Nights, adopted by 44% of listings. This highlights the market's preference for longer commitments.
- A significant segment (44%) caters to monthly stays (30+ nights) in Alinda, pointing to opportunities in the extended-stay market.
Recommendations
- Align with the market by considering a 30+ Nights minimum stay, as 44% of Alinda hosts use this setting.
- If feasible, allowing 1-night stays, especially midweek or during low season, could capture last-minute bookings, as only 20% currently do.
- Explore offering discounts for stays of 30+ nights to attract the 44% of the market seeking extended stays.
- Adjust minimum nights based on seasonality – potentially shorter during low season and longer during peak demand periods in Alinda.
Alinda Airbnb Cancellation Policy Trends Analysis (2026)
Super Strict 30 Days
1 listings
4% of total
Limited
1 listings
4% of total
Moderate
1 listings
4% of total
Firm
21 listings
84% of total
Strict
1 listings
4% of total
Cancellation Policy Insights for Alinda
- The prevailing Airbnb cancellation policy trend in Alinda is Firm, used by 84% of listings.
- A majority (88.0%) of hosts in Alinda utilize Firm or Strict policies, indicating a market where hosts prioritize booking security.
- Strict cancellation policies are quite rare (4%), potentially making listings with this policy less competitive unless justified by high demand or property type.
Recommendations for Hosts
- Consider adopting a Firm policy to align with the 84% market standard in Alinda.
- Using a Strict policy might deter some guests, as only 4% of listings use it. Evaluate if potential revenue protection outweighs possible lower booking rates.
- Regularly review your cancellation policy against competitors and market demand shifts in Alinda.
Alinda STR Booking Lead Time Analysis (2026)
Average Booking Lead Time by Month
Booking Lead Time Insights for Alinda
- The overall average booking lead time for vacation rentals in Alinda is 52 days.
- Guests book furthest in advance for stays during July (average 86 days), likely coinciding with peak travel demand or local events.
- The shortest booking windows occur for stays in November (average 0 days), indicating more last-minute travel plans during this time.
- Seasonally, Summer (63 days avg.) sees the longest lead times, while Winter (1 days avg.) has the shortest, reflecting typical travel planning cycles.
Recommendations for Hosts
- Use the overall average lead time (52 days) as a baseline for your pricing and availability strategy in Alinda.
- For July stays, consider implementing length-of-stay discounts or slightly higher rates for bookings made less than 86 days out to capitalize on advance planning.
- During November, focus on last-minute booking availability and promotions, as guests book with very short notice (0 days avg.).
- Target marketing efforts for the Summer season well in advance (at least 63 days) to capture early planners.
- Monitor your own booking lead times against these Alinda averages to identify opportunities for dynamic pricing adjustments.
Popular & Essential Airbnb Amenities in Alinda (2026)
Amenity Prevalence
Amenity Insights for Alinda
- Essential amenities in Alinda that guests expect include: TV, Wifi, Free parking on premises. Lacking these (any) could significantly impact bookings.
- Popular amenities like Kitchen, Hangers, Air conditioning are common but not universal. Offering these can provide a competitive edge.
Recommendations for Hosts
- Ensure your listing includes all essential amenities for Alinda: TV, Wifi, Free parking on premises.
- Prioritize adding missing essentials: Free parking on premises.
- Consider adding popular differentiators like Kitchen or Hangers to increase appeal.
- Highlight unique or less common amenities you offer (e.g., hot tub, dedicated workspace, EV charger) in your listing description and photos.
- Regularly check competitor amenities in Alinda to stay competitive.
Alinda Airbnb Guest Demographics & Profile Analysis (2026)
Guest Profile Summary for Alinda
- The typical guest profile for Airbnb in Alinda consists of predominantly international visitors (87%), with top international origins including United Kingdom, typically belonging to the Post-2000s (Gen Z/Alpha) group (50%), primarily speaking English or Turkish.
- Domestic travelers account for 13.3% of guests.
- Key international markets include Turkey (23.3%) and United Kingdom (13.3%).
- Top languages spoken are English (38.2%) followed by Turkish (14.7%).
- A significant demographic segment is the Post-2000s (Gen Z/Alpha) group, representing 50% of guests.
Recommendations for Hosts
- Focus marketing internationally, particularly towards travelers from United Kingdom.
- Tailor amenities and listing descriptions to appeal to the dominant Post-2000s (Gen Z/Alpha) demographic (e.g., highlight fast WiFi, smart home features, local guides).
- Highlight unique local experiences or amenities relevant to the primary guest profile.
- Consider seasonal promotions aligned with peak travel times for key origin markets.
Nearby Short-Term Rental Market Comparison
How does the Alinda Airbnb market stack up against its neighbors? Compare key performance metrics like average monthly revenue, ADR, and occupancy rates in surrounding areas to understand the broader regional STR landscape.
| Market | Active Properties | Monthly Revenue | Daily Rate | Avg. Occupancy |
|---|---|---|---|---|
| Faros Armenistis | 119 | $4,791 | $715.43 | 41% |
| Ia Municipal Unit | 722 | $3,844 | $396.32 | 42% |
| Agios Ioannis Diakoftis | 159 | $3,592 | $590.02 | 39% |
| Orkos | 90 | $3,536 | $419.32 | 46% |
| Municipality of Mykonos | 330 | $3,535 | $688.35 | 35% |
| Psarou | 114 | $3,339 | $721.78 | 36% |
| Plintri | 146 | $3,195 | $575.49 | 38% |
| Platys Gialos | 221 | $3,129 | $408.65 | 46% |
| Ano Mera | 117 | $3,009 | $639.21 | 38% |
| Ornos | 266 | $2,971 | $373.81 | 44% |