Kea Municipality Airbnb Market Analysis 2026: Short Term Rental Data & Vacation Rental Statistics in Aegean, Greece
Is Airbnb profitable in Kea Municipality in 2026? Explore comprehensive Airbnb analytics for Kea Municipality, Aegean, Greece to uncover income potential. This 2026 STR market report for Kea Municipality, based on AirROI data from February 2025 to January 2026, reveals key trends in the market of 204 active listings.
Whether you're considering an Airbnb investment in Kea Municipality, optimizing your existing vacation rental, or exploring rental arbitrage opportunities, understanding the Kea Municipality Airbnb data is crucial. Navigating the high regulation landscape is key to maximizing your short term rental income potential. Let's dive into the specifics.
Key Kea Municipality Airbnb Performance Metrics Overview
Monthly Airbnb Revenue Variations & Income Potential in Kea Municipality (2026)
Understanding the monthly revenue variations for Airbnb listings in Kea Municipality is key to maximizing your short term rental income potential. Seasonality significantly impacts earnings. Our analysis, based on data from the past 12 months, shows that the peak revenue month for STRs in Kea Municipality is typically August, while December often presents the lowest earnings, highlighting opportunities for strategic pricing adjustments during shoulder and low seasons. Explore the typical Airbnb income in Kea Municipality across different performance tiers:
- Best-in-class properties (Top 10%) achieve $7,049+ monthly, often utilizing dynamic pricing and superior guest experiences.
- Strong performing properties (Top 25%) earn $3,536 or more, indicating effective management and desirable locations/amenities.
- Typical properties (Median) generate around $1,776 per month, representing the average market performance.
- Entry-level properties (Bottom 25%) see earnings around $899, often with potential for optimization.
Average Monthly Airbnb Earnings Trend in Kea Municipality
Kea Municipality Airbnb Occupancy Rate Trends (2026)
Maximize your bookings by understanding the Kea Municipality STR occupancy trends. Seasonal demand shifts significantly influence how often properties are booked. Typically, Augustsees the highest demand (peak season occupancy), while December experiences the lowest (low season). Effective strategies, like adjusting minimum stays or offering promotions, can boost occupancy during slower periods. Here's how different property tiers perform in Kea Municipality:
- Best-in-class properties (Top 10%) achieve 69%+ occupancy, indicating high desirability and potentially optimized availability.
- Strong performing properties (Top 25%) maintain 43% or higher occupancy, suggesting good market fit and guest satisfaction.
- Typical properties (Median) have an occupancy rate around 22%.
- Entry-level properties (Bottom 25%) average 11% occupancy, potentially facing higher vacancy.
Average Monthly Occupancy Rate Trend in Kea Municipality
Average Daily Rate (ADR) Airbnb Trends in Kea Municipality (2026)
Effective short term rental pricing strategy in Kea Municipality involves understanding monthly ADR fluctuations. The Average Daily Rate (ADR) for Airbnb in Kea Municipality typically peaks in August and dips lowest during November. Leveraging Airbnb dynamic pricing tools or strategies based on this seasonality can significantly boost revenue. Here's a look at the typical nightly rates achieved:
- Best-in-class properties (Top 10%) command rates of $730+ per night, often due to premium features or locations.
- Strong performing properties (Top 25%) achieve nightly rates of $517 or more.
- Typical properties (Median) charge around $279 per night.
- Entry-level properties (Bottom 25%) earn around $181 per night.
Average Daily Rate (ADR) Trend by Month in Kea Municipality
Get Live Kea Municipality Market Intelligence 👇

Explore Real-time Analytics
Airbnb Seasonality Analysis & Trends in Kea Municipality (2026)
Peak Season (August, July, September)
- Revenue averages $5,474 per month
- Occupancy rates average 44.8%
- Daily rates average $408
Shoulder Season
- Revenue averages $2,531 per month
- Occupancy maintains around 29.4%
- Daily rates hold near $381
Low Season (January, February, December)
- Revenue drops to average $1,081 per month
- Occupancy decreases to average 16.8%
- Daily rates adjust to average $378
Seasonality Insights for Kea Municipality
- The Airbnb seasonality in Kea Municipality shows highly seasonal trends requiring careful strategy. While the sections above show seasonal averages, it's also insightful to look at the extremes:
- During the high season, the absolute peak month showcases Kea Municipality's highest earning potential, with monthly revenues capable of climbing to $7,778, occupancy reaching a high of 60.3%, and ADRs peaking at $416.
- Conversely, the slowest single month of the year, typically falling within the low season, marks the market's lowest point. In this month, revenue might dip to $917, occupancy could drop to 15.7%, and ADRs may adjust down to $375.
- Understanding both the seasonal averages and these monthly peaks and troughs in revenue, occupancy, and ADR is crucial for maximizing your Airbnb profit potential in Kea Municipality.
Seasonal Strategies for Maximizing Profit
- Peak Season: Maximize revenue through premium pricing and potentially longer minimum stays. Ensure high availability.
- Low Season: Offer competitive pricing, special promotions (e.g., extended stay discounts), and flexible cancellation policies. Target off-season travelers like remote workers or budget-conscious guests.
- Shoulder Seasons: Implement dynamic pricing that balances peak and low rates. Target weekend travelers or specific events. Offer slightly more flexible terms than peak season.
- Regularly analyze your own performance against these Kea Municipality seasonality benchmarks and adjust your pricing and availability strategy accordingly.
Best Areas for Airbnb Investment in Kea Municipality (2026)
Exploring the top neighborhoods for short-term rentals in Kea Municipality? This section highlights key areas, outlining why they are attractive for hosts and guests, along with notable local attractions. Consider these locations based on your target guest profile and investment strategy.
| Neighborhood / Area | Why Host Here? (Target Guests & Appeal) | Key Attractions & Landmarks |
|---|---|---|
| Kea Chora | The charming main town of Kea, known for its traditional Cycladic architecture and vibrant local culture. Ideal for tourists looking for authentic Greek island experiences, local shops, and restaurants. | Kea Archaeological Museum, Local shops and cafes, St George Church, Kea's traditional architecture |
| Koundouros | A beautiful beach area offering stunning seaside views and several beach bars. Perfect for tourists looking to relax by the sea and enjoy water activities. | Koundouros Beach, Water sports, Beach bars and restaurants |
| Vourkari | A picturesque fishing village popular among visitors for its lovely bay and excellent seafood restaurants. Great for tourists seeking tranquility and local cuisine. | Vourkari Marina, Local seafood restaurants, Scenic views of the bay, Nearby walking trails |
| Otzias | Known for its sandy beach and family-friendly atmosphere. Attractive for visitors with children looking for relaxing beach vacations without the hustle of bigger towns. | Otzias Beach, Family-friendly restaurants, Walking trails |
| Ioulida | The ancient capital of Kea, situated on a hill with stunning views. Interesting for culture enthusiasts and those exploring the island’s history. | Ancient ruins, Kea's traditional windmills, Local museums, Stunning panoramic views |
| Pisses Beach | A serene beach with crystal clear waters, great for sunbathers and swimmers. It attracts tourists wanting a more secluded beach experience away from the crowded areas. | Pisses Beach, Natural beauty, Sunbathing and swimming |
| Kea's hiking trails | Kea is renowned for its hiking opportunities, attracting adventure enthusiasts. The trails offer stunning views and a chance to explore the island’s natural beauty. | Kea hiking trails, Flora and fauna, Scenic viewpoints |
| Korissia | The main port of Kea, where most ferries arrive. It has several amenities and is a good base for exploring the island. | Korissia Beach, Marina, Local shops |
Understanding Airbnb License Requirements & STR Laws in Kea Municipality (2026)
Yes, Kea Municipality, Aegean, Greece enforces high STR regulations. Obtaining a license and ensuring compliance is almost certainly required according to current 2026 STR laws. Always verify the latest short term rental regulations and Airbnb license requirements directly with local government authorities for Kea Municipality to ensure full compliance before hosting.
(Source: AirROI data, 2026, based on 83% licensed listings)
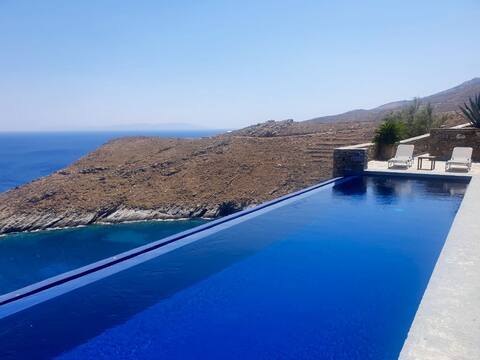
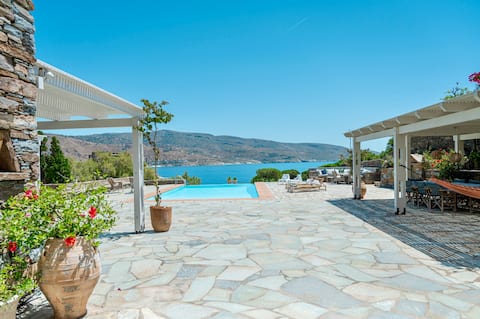
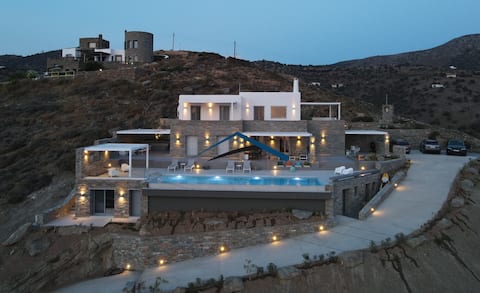
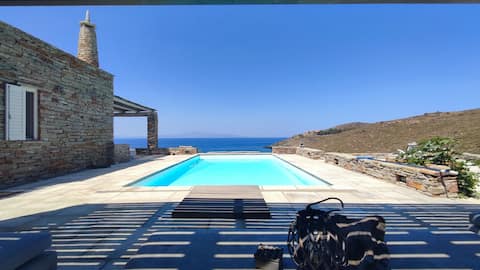
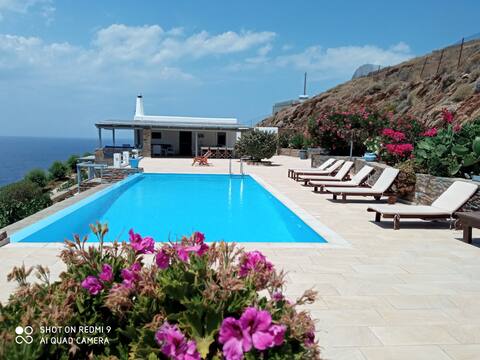
Top Performing Airbnb Properties in Kea Municipality (2026)
Benchmark your potential! Explore examples of top-performing Airbnb properties in Kea Municipalitybased on Trailing Twelve Month (TTM) revenue. Analyze their characteristics, revenue, occupancy rate, and ADR to understand what drives success in this market.
KEA Cyclades Greece - Villa Hyperion
Entire Place • 7 bedrooms
Danaé's house: "Waterfront"
Entire Place • 5 bedrooms
Luxurious villa with a large pool and sea view
Entire Place • 6 bedrooms
Waterfront villa with private pool and seaview
Entire Place • 3 bedrooms
Dreamscape Villa - Kea Island
Entire Place • 5 bedrooms

Villa Juno with pool and clifftop view by Jj
Entire Place • 5 bedrooms
Note: Performance varies based on location, size, amenities, seasonality, and management quality. Data reflects the past 12 months.
Top Performing Airbnb Hosts in Kea Municipality (2026)
Learn from the best! This table showcases top-performing Airbnb hosts in Kea Municipality based on the number of properties managed and estimated total revenue over the past year. Analyze their scale and performance metrics.
| Host Name | Properties | Grossing Revenue | Stay Reviews | Avg Rating |
|---|---|---|---|---|
| Maria | 24 | $501,474 | 125 | 4.86/5.0 |
| Luxvillas | 3 | $143,082 | 40 | 4.91/5.0 |
| Alex | 1 | $125,323 | 67 | 5.00/5.0 |
| Alfredos | 8 | $113,322 | 47 | 5.00/5.0 |
| Jj | 2 | $105,499 | 11 | 4.82/5.0 |
| Danae | 1 | $104,716 | 25 | 5.00/5.0 |
| Aegli | 2 | $93,162 | 29 | 5.00/5.0 |
| Kiki | 4 | $89,790 | 45 | 5.00/5.0 |
| Anais Filio | 5 | $78,667 | 295 | 4.94/5.0 |
| Spyridon | 1 | $78,622 | 24 | 4.96/5.0 |
Analyzing the strategies of top hosts, such as their property selection, pricing, and guest communication, can offer valuable lessons for optimizing your own Airbnb operations in Kea Municipality.
Dive Deeper: Advanced Kea Municipality STR Market Data (2026)
Ready to unlock more insights? AirROI provides access to advanced metrics and comprehensive Airbnb data for Kea Municipality. Explore detailed analytics beyond this report to refine your investment strategy, optimize pricing, and maximize your vacation rental profits.
Explore Advanced MetricsKea Municipality Short-Term Rental Market Composition (2026): Property & Room Types
Room Type Distribution
Property Type Distribution
Market Composition Insights for Kea Municipality
- The Kea Municipality Airbnb market composition is heavily skewed towards Entire Home/Apt listings, which make up 98% of the 204 active rentals. This indicates strong guest preference for privacy and space.
- Looking at the property type distribution in Kea Municipality, House properties are the most common (88.7%), reflecting the local real estate landscape.
- Houses represent a significant 88.7% portion, catering likely to families or larger groups.
- Smaller segments like others, hotel/boutique, outdoor/unique, unique stays (combined 5.5%) offer potential for unique stay experiences.
Kea Municipality Airbnb Room Capacity Analysis (2026): Bedroom Distribution
Distribution of Listings by Number of Bedrooms
Room Capacity Insights for Kea Municipality
- The dominant room capacity in Kea Municipality is 3 bedrooms listings, making up 27% of the market. This suggests a strong demand for properties suitable for families or small groups.
- Together, 3 bedrooms and 2 bedrooms properties represent 53.5% of the active Airbnb listings in Kea Municipality, indicating a high concentration in these sizes.
- A significant 55.9% of listings offer 3+ bedrooms, catering to larger groups and families seeking more space in Kea Municipality.
Kea Municipality Vacation Rental Guest Capacity Trends (2026)
Distribution of Listings by Guest Capacity
Guest Capacity Insights for Kea Municipality
- The most common guest capacity trend in Kea Municipality vacation rentals is listings accommodating 8+ guests (31.9%). This suggests the primary traveler segment is likely larger groups.
- Properties designed for 8+ guests and 6 guests dominate the Kea Municipality STR market, accounting for 52.0% of listings.
- 57.9% of properties accommodate 6+ guests, serving the market segment for larger families or group travel in Kea Municipality.
- On average, properties in Kea Municipality are equipped to host 5.8 guests.
Kea Municipality Airbnb Booking Patterns (2026): Available vs. Booked Days
Available Days Distribution
Booked Days Distribution
Booking Pattern Insights for Kea Municipality
- The most common availability pattern in Kea Municipality falls within the 271-366 days range, representing 82.8% of listings. This suggests many properties have significant open periods on their calendars.
- Approximately 98.5% of listings show high availability (181+ days open annually), indicating potential for increased bookings or specific owner usage patterns.
- For booked days, the 31-90 days range is most frequent in Kea Municipality (44.6%), reflecting common guest stay durations or potential owner blocking patterns.
- A notable 2.0% of properties secure long booking periods (181+ days booked per year), highlighting successful long-term rental strategies or significant owner usage.
Kea Municipality Airbnb Minimum Stay Requirements Analysis
Distribution of Listings by Minimum Night Requirement
1 Night
4 listings
2% of total
2 Nights
28 listings
13.7% of total
3 Nights
19 listings
9.3% of total
4-6 Nights
62 listings
30.4% of total
7-29 Nights
14 listings
6.9% of total
30+ Nights
77 listings
37.7% of total
Key Insights
- The most prevalent minimum stay requirement in Kea Municipality is 30+ Nights, adopted by 37.7% of listings. This highlights the market's preference for longer commitments.
- Very short stays (1-2 nights) are less common (15.7%), suggesting hosts prefer slightly longer bookings to optimize turnover.
- A significant segment (37.7%) caters to monthly stays (30+ nights) in Kea Municipality, pointing to opportunities in the extended-stay market.
Recommendations
- Align with the market by considering a 30+ Nights minimum stay, as 37.7% of Kea Municipality hosts use this setting.
- If feasible, allowing 1-night stays, especially midweek or during low season, could capture last-minute bookings, as only 2% currently do.
- Explore offering discounts for stays of 30+ nights to attract the 37.7% of the market seeking extended stays.
- Adjust minimum nights based on seasonality – potentially shorter during low season and longer during peak demand periods in Kea Municipality.
Kea Municipality Airbnb Cancellation Policy Trends Analysis (2026)
Super Strict 30 Days
3 listings
1.5% of total
Flexible
12 listings
5.9% of total
Moderate
20 listings
9.8% of total
Firm
90 listings
44.1% of total
Strict
79 listings
38.7% of total
Cancellation Policy Insights for Kea Municipality
- The prevailing Airbnb cancellation policy trend in Kea Municipality is Firm, used by 44.1% of listings.
- A majority (82.8%) of hosts in Kea Municipality utilize Firm or Strict policies, indicating a market where hosts prioritize booking security.
Recommendations for Hosts
- Consider adopting a Firm policy to align with the 44.1% market standard in Kea Municipality.
- With 38.7% using Strict terms, this is a viable option in Kea Municipality, particularly for high-value properties or during peak demand periods.
- Regularly review your cancellation policy against competitors and market demand shifts in Kea Municipality.
Kea Municipality STR Booking Lead Time Analysis (2026)
Average Booking Lead Time by Month
Booking Lead Time Insights for Kea Municipality
- The overall average booking lead time for vacation rentals in Kea Municipality is 58 days.
- Guests book furthest in advance for stays during August (average 93 days), likely coinciding with peak travel demand or local events.
- The shortest booking windows occur for stays in February (average 4 days), indicating more last-minute travel plans during this time.
- Seasonally, Summer (65 days avg.) sees the longest lead times, while Winter (15 days avg.) has the shortest, reflecting typical travel planning cycles.
Recommendations for Hosts
- Use the overall average lead time (58 days) as a baseline for your pricing and availability strategy in Kea Municipality.
- For August stays, consider implementing length-of-stay discounts or slightly higher rates for bookings made less than 93 days out to capitalize on advance planning.
- During February, focus on last-minute booking availability and promotions, as guests book with very short notice (4 days avg.).
- Target marketing efforts for the Summer season well in advance (at least 65 days) to capture early planners.
- Monitor your own booking lead times against these Kea Municipality averages to identify opportunities for dynamic pricing adjustments.
Popular & Essential Airbnb Amenities in Kea Municipality (2026)
Amenity Prevalence
Amenity Insights for Kea Municipality
- Essential amenities in Kea Municipality that guests expect include: Kitchen. Lacking these (this) could significantly impact bookings.
- Popular amenities like Dishes and silverware, Free parking on premises, Coffee maker are common but not universal. Offering these can provide a competitive edge.
- Warning: Wifi is not universally provided but is considered essential globally. Ensure reliable Wifi is offered.
Recommendations for Hosts
- Ensure your listing includes all essential amenities for Kea Municipality: Kitchen.
- Prioritize adding missing essentials: Kitchen.
- Consider adding popular differentiators like Dishes and silverware or Free parking on premises to increase appeal.
- Highlight unique or less common amenities you offer (e.g., hot tub, dedicated workspace, EV charger) in your listing description and photos.
- Regularly check competitor amenities in Kea Municipality to stay competitive.
Kea Municipality Airbnb Guest Demographics & Profile Analysis (2026)
Guest Profile Summary for Kea Municipality
- The typical guest profile for Airbnb in Kea Municipality consists of predominantly international visitors (85%), with top international origins including Greece, typically belonging to the Post-2000s (Gen Z/Alpha) group (50%), primarily speaking English or French.
- Domestic travelers account for 15.4% of guests.
- Key international markets include France (20.2%) and Greece (15.4%).
- Top languages spoken are English (39.4%) followed by French (17.1%).
- A significant demographic segment is the Post-2000s (Gen Z/Alpha) group, representing 50% of guests.
Recommendations for Hosts
- Focus marketing internationally, particularly towards travelers from Greece.
- Tailor amenities and listing descriptions to appeal to the dominant Post-2000s (Gen Z/Alpha) demographic (e.g., highlight fast WiFi, smart home features, local guides).
- Highlight unique local experiences or amenities relevant to the primary guest profile.
- Consider seasonal promotions aligned with peak travel times for key origin markets.
Nearby Short-Term Rental Market Comparison
How does the Kea Municipality Airbnb market stack up against its neighbors? Compare key performance metrics like average monthly revenue, ADR, and occupancy rates in surrounding areas to understand the broader regional STR landscape.
| Market | Active Properties | Monthly Revenue | Daily Rate | Avg. Occupancy |
|---|---|---|---|---|
| Faros Armenistis | 119 | $4,791 | $715.43 | 41% |
| Ia Municipal Unit | 722 | $3,844 | $396.32 | 42% |
| Agios Ioannis Diakoftis | 159 | $3,592 | $590.02 | 39% |
| Orkos | 90 | $3,536 | $419.32 | 46% |
| Municipality of Mykonos | 330 | $3,535 | $688.35 | 35% |
| Plaka | 181 | $3,420 | $285.40 | 59% |
| Psarou | 114 | $3,339 | $721.78 | 36% |
| Pollonia | 128 | $3,247 | $316.99 | 55% |
| Plintri | 146 | $3,195 | $575.49 | 38% |
| Platys Gialos | 221 | $3,129 | $408.65 | 46% |