Kionia Airbnb Market Analysis 2026: Short Term Rental Data & Vacation Rental Statistics in Aegean, Greece
Is Airbnb profitable in Kionia in 2026? Explore comprehensive Airbnb analytics for Kionia, Aegean, Greece to uncover income potential. This 2026 STR market report for Kionia, based on AirROI data from February 2025 to January 2026, reveals key trends in the niche market of 21 active listings.
Whether you're considering an Airbnb investment in Kionia, optimizing your existing vacation rental, or exploring rental arbitrage opportunities, understanding the Kionia Airbnb data is crucial. Navigating the high regulation landscape is key to maximizing your short term rental income potential. Let's dive into the specifics.
Key Kionia Airbnb Performance Metrics Overview
Monthly Airbnb Revenue Variations & Income Potential in Kionia (2026)
Understanding the monthly revenue variations for Airbnb listings in Kionia is key to maximizing your short term rental income potential. Seasonality significantly impacts earnings. Our analysis, based on data from the past 12 months, shows that the peak revenue month for STRs in Kionia is typically August, while January often presents the lowest earnings, highlighting opportunities for strategic pricing adjustments during shoulder and low seasons. Explore the typical Airbnb income in Kionia across different performance tiers:
- Best-in-class properties (Top 10%) achieve $5,710+ monthly, often utilizing dynamic pricing and superior guest experiences.
- Strong performing properties (Top 25%) earn $3,024 or more, indicating effective management and desirable locations/amenities.
- Typical properties (Median) generate around $1,850 per month, representing the average market performance.
- Entry-level properties (Bottom 25%) see earnings around $1,060, often with potential for optimization.
Average Monthly Airbnb Earnings Trend in Kionia
Kionia Airbnb Occupancy Rate Trends (2026)
Maximize your bookings by understanding the Kionia STR occupancy trends. Seasonal demand shifts significantly influence how often properties are booked. Typically, Augustsees the highest demand (peak season occupancy), while December experiences the lowest (low season). Effective strategies, like adjusting minimum stays or offering promotions, can boost occupancy during slower periods. Here's how different property tiers perform in Kionia:
- Best-in-class properties (Top 10%) achieve 65%+ occupancy, indicating high desirability and potentially optimized availability.
- Strong performing properties (Top 25%) maintain 52% or higher occupancy, suggesting good market fit and guest satisfaction.
- Typical properties (Median) have an occupancy rate around 31%.
- Entry-level properties (Bottom 25%) average 18% occupancy, potentially facing higher vacancy.
Average Monthly Occupancy Rate Trend in Kionia
Average Daily Rate (ADR) Airbnb Trends in Kionia (2026)
Effective short term rental pricing strategy in Kionia involves understanding monthly ADR fluctuations. The Average Daily Rate (ADR) for Airbnb in Kionia typically peaks in September and dips lowest during March. Leveraging Airbnb dynamic pricing tools or strategies based on this seasonality can significantly boost revenue. Here's a look at the typical nightly rates achieved:
- Best-in-class properties (Top 10%) command rates of $488+ per night, often due to premium features or locations.
- Strong performing properties (Top 25%) achieve nightly rates of $216 or more.
- Typical properties (Median) charge around $128 per night.
- Entry-level properties (Bottom 25%) earn around $102 per night.
Average Daily Rate (ADR) Trend by Month in Kionia
Get Live Kionia Market Intelligence 👇

Explore Real-time Analytics
Airbnb Seasonality Analysis & Trends in Kionia (2026)
Peak Season (August, July, February)
- Revenue averages $4,598 per month
- Occupancy rates average 36.7%
- Daily rates average $236
Shoulder Season
- Revenue averages $2,681 per month
- Occupancy maintains around 36.3%
- Daily rates hold near $229
Low Season (January, November, December)
- Revenue drops to average $632 per month
- Occupancy decreases to average 19.2%
- Daily rates adjust to average $241
Seasonality Insights for Kionia
- The Airbnb seasonality in Kionia shows highly seasonal trends requiring careful strategy. While the sections above show seasonal averages, it's also insightful to look at the extremes:
- During the high season, the absolute peak month showcases Kionia's highest earning potential, with monthly revenues capable of climbing to $5,891, occupancy reaching a high of 61.5%, and ADRs peaking at $272.
- Conversely, the slowest single month of the year, typically falling within the low season, marks the market's lowest point. In this month, revenue might dip to $181, occupancy could drop to 0.0%, and ADRs may adjust down to $199.
- Understanding both the seasonal averages and these monthly peaks and troughs in revenue, occupancy, and ADR is crucial for maximizing your Airbnb profit potential in Kionia.
Seasonal Strategies for Maximizing Profit
- Peak Season: Maximize revenue through premium pricing and potentially longer minimum stays. Ensure high availability.
- Low Season: Offer competitive pricing, special promotions (e.g., extended stay discounts), and flexible cancellation policies. Target off-season travelers like remote workers or budget-conscious guests.
- Shoulder Seasons: Implement dynamic pricing that balances peak and low rates. Target weekend travelers or specific events. Offer slightly more flexible terms than peak season.
- Regularly analyze your own performance against these Kionia seasonality benchmarks and adjust your pricing and availability strategy accordingly.
Best Areas for Airbnb Investment in Kionia (2026)
Exploring the top neighborhoods for short-term rentals in Kionia? This section highlights key areas, outlining why they are attractive for hosts and guests, along with notable local attractions. Consider these locations based on your target guest profile and investment strategy.
| Neighborhood / Area | Why Host Here? (Target Guests & Appeal) | Key Attractions & Landmarks |
|---|---|---|
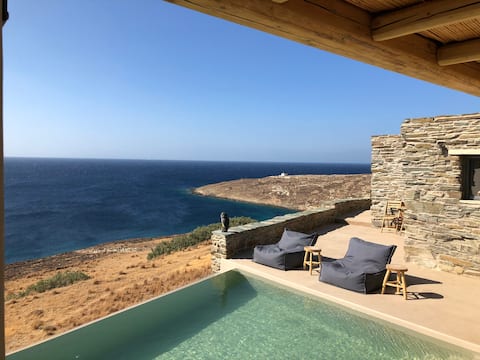
| Kionia Beach | A tranquil beach area known for its crystal-clear waters and beautiful surroundings. Perfect for tourists looking for a peaceful getaway with access to local dining and stunning sunsets. | Kionia Beach, Ancient Temple of Poseidon, Kionia Archaeological Museum, Local tavernas and cafes |
| Tinos Town | The island's capital, known for its charming streets, shops, and vibrant atmosphere. This area attracts tourists seeking culture, history, and local art. | Tinos Town main square, Church of Panagia Evangelistria, Art galleries, Traditional stone houses |
| Agios Romanos | A picturesque area known for its serene beach and natural beauty. Ideal for families and couples looking for a relaxing beach holiday. | Agios Romanos Beach, Water sports activities, Local beach bars, Beautiful walking trails |
| Pyrgos | A traditional village famous for its marble architecture and artistic atmosphere. Great for guests interested in culture and craftsmanship. | Marble Museum, Architectural tours, Local artisans, Historical architecture |
| Aghios Fokas | A great destination for those seeking a quieter beach experience away from the main tourist crowds. This area has lovely beaches and a laid-back vibe. | Aghios Fokas Beach, Secluded beaches, Local dining options |
| Livadas | Known for its stunning views and natural landscapes, this area is perfect for hikers and nature lovers. | Hiking trails, Scenic viewpoints, Nature photography opportunities |
| Kolymbithra Beach | A popular beach area perfect for water sports enthusiasts and those looking to enjoy vibrant beach life. | Kolymbithra Beach, Surfing and windsurfing, Beach bars and restaurants |
| Kardiani Village | A traditional Greek village with beautiful architecture and captivating views. This area is ideal for those looking for an authentic local experience. | Charming village streets, Local taverns, Stunning views of the Aegean Sea |
Understanding Airbnb License Requirements & STR Laws in Kionia (2026)
Yes, Kionia, Aegean, Greece enforces high STR regulations. Obtaining a license and ensuring compliance is almost certainly required according to current 2026 STR laws. Always verify the latest short term rental regulations and Airbnb license requirements directly with local government authorities for Kionia to ensure full compliance before hosting.
(Source: AirROI data, 2026, based on 81% licensed listings)
Top Performing Airbnb Properties in Kionia (2026)
Benchmark your potential! Explore examples of top-performing Airbnb properties in Kioniabased on Trailing Twelve Month (TTM) revenue. Analyze their characteristics, revenue, occupancy rate, and ADR to understand what drives success in this market.

Homatinos Villa, a SeaView Escape with 2 Pools
Entire Place • 5 bedrooms
KASTRAKI
Entire Place • 1 bedroom

Agios Markos Bay House
Entire Place • 2 bedrooms
Claire - Country House by the Sea.
Entire Place • 2 bedrooms

Stone house with sea view
Entire Place • 2 bedrooms

LUXURY APARTMENT BOURNI TINOS CYCLADES GREECE
Entire Place • 3 bedrooms
Note: Performance varies based on location, size, amenities, seasonality, and management quality. Data reflects the past 12 months.
Top Performing Airbnb Hosts in Kionia (2026)
Learn from the best! This table showcases top-performing Airbnb hosts in Kionia based on the number of properties managed and estimated total revenue over the past year. Analyze their scale and performance metrics.
| Host Name | Properties | Grossing Revenue | Stay Reviews | Avg Rating |
|---|---|---|---|---|
| Valia | 1 | $84,916 | 2 | Not Rated |
| George | 1 | $60,127 | 49 | 5.00/5.0 |
| Caroline | 1 | $33,440 | 73 | 4.96/5.0 |
| Bailas | 1 | $33,238 | 31 | 5.00/5.0 |
| Elena | 1 | $16,003 | 34 | 4.97/5.0 |
| Φωτεινή/ Fotini | 1 | $15,511 | 5 | 4.20/5.0 |
| Thanos | 1 | $14,271 | 46 | 4.80/5.0 |
| Iraklis | 1 | $13,921 | 22 | 4.86/5.0 |
| Αγγελος | 2 | $12,192 | 45 | 4.88/5.0 |
| Gerasimos | 4 | $11,624 | 100 | 4.96/5.0 |
Analyzing the strategies of top hosts, such as their property selection, pricing, and guest communication, can offer valuable lessons for optimizing your own Airbnb operations in Kionia.
Dive Deeper: Advanced Kionia STR Market Data (2026)
Ready to unlock more insights? AirROI provides access to advanced metrics and comprehensive Airbnb data for Kionia. Explore detailed analytics beyond this report to refine your investment strategy, optimize pricing, and maximize your vacation rental profits.
Explore Advanced MetricsKionia Short-Term Rental Market Composition (2026): Property & Room Types
Room Type Distribution
Property Type Distribution
Market Composition Insights for Kionia
- The Kionia Airbnb market composition is heavily skewed towards Entire Home/Apt listings, which make up 85.7% of the 21 active rentals. This indicates strong guest preference for privacy and space.
- Looking at the property type distribution in Kionia, House properties are the most common (57.1%), reflecting the local real estate landscape.
- Houses represent a significant 57.1% portion, catering likely to families or larger groups.
- The presence of 14.3% Hotel/Boutique listings indicates integration with traditional hospitality.
Kionia Airbnb Room Capacity Analysis (2026): Bedroom Distribution
Distribution of Listings by Number of Bedrooms
Room Capacity Insights for Kionia
- The dominant room capacity in Kionia is 1 bedroom listings, making up 52.4% of the market. This suggests a strong demand for properties suitable for couples or solo travelers.
- Together, 1 bedroom and 2 bedrooms properties represent 71.4% of the active Airbnb listings in Kionia, indicating a high concentration in these sizes.
- With over half the market (52.4%) consisting of studios or 1-bedroom units, Kionia is particularly well-suited for individuals or couples.
- A significant 23.8% of listings offer 3+ bedrooms, catering to larger groups and families seeking more space in Kionia.
Kionia Vacation Rental Guest Capacity Trends (2026)
Distribution of Listings by Guest Capacity
Guest Capacity Insights for Kionia
- The most common guest capacity trend in Kionia vacation rentals is listings accommodating 4 guests (33.3%). This suggests the primary traveler segment is likely small families or groups.
- Properties designed for 4 guests and 2 guests dominate the Kionia STR market, accounting for 61.9% of listings.
- 23.8% of properties accommodate 6+ guests, serving the market segment for larger families or group travel in Kionia.
- On average, properties in Kionia are equipped to host 4.0 guests.
Kionia Airbnb Booking Patterns (2026): Available vs. Booked Days
Available Days Distribution
Booked Days Distribution
Booking Pattern Insights for Kionia
- The most common availability pattern in Kionia falls within the 271-366 days range, representing 81% of listings. This suggests many properties have significant open periods on their calendars.
- Approximately 90.5% of listings show high availability (181+ days open annually), indicating potential for increased bookings or specific owner usage patterns.
- For booked days, the 31-90 days range is most frequent in Kionia (47.6%), reflecting common guest stay durations or potential owner blocking patterns.
- A notable 9.5% of properties secure long booking periods (181+ days booked per year), highlighting successful long-term rental strategies or significant owner usage.
Kionia Airbnb Minimum Stay Requirements Analysis
Distribution of Listings by Minimum Night Requirement
1 Night
1 listings
4.8% of total
2 Nights
8 listings
38.1% of total
3 Nights
3 listings
14.3% of total
4-6 Nights
4 listings
19% of total
7-29 Nights
1 listings
4.8% of total
30+ Nights
4 listings
19% of total
Key Insights
- The most prevalent minimum stay requirement in Kionia is 2 Nights, adopted by 38.1% of listings. This highlights the market's preference for shorter, flexible bookings.
- A significant segment (19%) caters to monthly stays (30+ nights) in Kionia, pointing to opportunities in the extended-stay market.
Recommendations
- Align with the market by considering a 2 Nights minimum stay, as 38.1% of Kionia hosts use this setting.
- If feasible, allowing 1-night stays, especially midweek or during low season, could capture last-minute bookings, as only 4.8% currently do.
- A 2-night minimum appears standard (38.1%). Consider this for weekends or peak periods.
- Explore offering discounts for stays of 30+ nights to attract the 19% of the market seeking extended stays.
- Adjust minimum nights based on seasonality – potentially shorter during low season and longer during peak demand periods in Kionia.
Kionia Airbnb Cancellation Policy Trends Analysis (2026)
Flexible
1 listings
4.8% of total
Moderate
3 listings
14.3% of total
Firm
12 listings
57.1% of total
Strict
5 listings
23.8% of total
Cancellation Policy Insights for Kionia
- The prevailing Airbnb cancellation policy trend in Kionia is Firm, used by 57.1% of listings.
- A majority (80.9%) of hosts in Kionia utilize Firm or Strict policies, indicating a market where hosts prioritize booking security.
Recommendations for Hosts
- Consider adopting a Firm policy to align with the 57.1% market standard in Kionia.
- Regularly review your cancellation policy against competitors and market demand shifts in Kionia.
Kionia STR Booking Lead Time Analysis (2026)
Average Booking Lead Time by Month
Booking Lead Time Insights for Kionia
- The overall average booking lead time for vacation rentals in Kionia is 57 days.
- Guests book furthest in advance for stays during August (average 102 days), likely coinciding with peak travel demand or local events.
- The shortest booking windows occur for stays in February (average 0 days), indicating more last-minute travel plans during this time.
- Seasonally, Summer (75 days avg.) sees the longest lead times, while Winter (1 days avg.) has the shortest, reflecting typical travel planning cycles.
Recommendations for Hosts
- Use the overall average lead time (57 days) as a baseline for your pricing and availability strategy in Kionia.
- For August stays, consider implementing length-of-stay discounts or slightly higher rates for bookings made less than 102 days out to capitalize on advance planning.
- During February, focus on last-minute booking availability and promotions, as guests book with very short notice (0 days avg.).
- Target marketing efforts for the Summer season well in advance (at least 75 days) to capture early planners.
- Monitor your own booking lead times against these Kionia averages to identify opportunities for dynamic pricing adjustments.
Popular & Essential Airbnb Amenities in Kionia (2026)
Amenity Prevalence
Amenity Insights for Kionia
- Essential amenities in Kionia that guests expect include: Free parking on premises, Kitchen. Lacking these (any) could significantly impact bookings.
- Popular amenities like Hot water, TV, Air conditioning are common but not universal. Offering these can provide a competitive edge.
- Warning: Wifi is not universally provided but is considered essential globally. Ensure reliable Wifi is offered.
Recommendations for Hosts
- Ensure your listing includes all essential amenities for Kionia: Free parking on premises, Kitchen.
- Prioritize adding missing essentials: Kitchen.
- Consider adding popular differentiators like Hot water or TV to increase appeal.
- Highlight unique or less common amenities you offer (e.g., hot tub, dedicated workspace, EV charger) in your listing description and photos.
- Regularly check competitor amenities in Kionia to stay competitive.
Kionia Airbnb Guest Demographics & Profile Analysis (2026)
Guest Profile Summary for Kionia
- The typical guest profile for Airbnb in Kionia consists of predominantly international visitors (78%), with top international origins including France, typically belonging to the Post-2000s (Gen Z/Alpha) group (50%), primarily speaking English or Greek.
- Domestic travelers account for 21.6% of guests.
- Key international markets include Greece (21.6%) and France (18.9%).
- Top languages spoken are English (38.5%) followed by Greek (17.9%).
- A significant demographic segment is the Post-2000s (Gen Z/Alpha) group, representing 50% of guests.
Recommendations for Hosts
- Focus marketing internationally, particularly towards travelers from France.
- Tailor amenities and listing descriptions to appeal to the dominant Post-2000s (Gen Z/Alpha) demographic (e.g., highlight fast WiFi, smart home features, local guides).
- Highlight unique local experiences or amenities relevant to the primary guest profile.
- Consider seasonal promotions aligned with peak travel times for key origin markets.
Nearby Short-Term Rental Market Comparison
How does the Kionia Airbnb market stack up against its neighbors? Compare key performance metrics like average monthly revenue, ADR, and occupancy rates in surrounding areas to understand the broader regional STR landscape.
| Market | Active Properties | Monthly Revenue | Daily Rate | Avg. Occupancy |
|---|---|---|---|---|
| Faros Armenistis | 119 | $4,791 | $715.43 | 41% |
| Ia Municipal Unit | 722 | $3,844 | $396.32 | 42% |
| Agios Ioannis Diakoftis | 159 | $3,592 | $590.02 | 39% |
| Orkos | 90 | $3,536 | $419.32 | 46% |
| Municipality of Mykonos | 330 | $3,535 | $688.35 | 35% |
| Plaka | 181 | $3,420 | $285.40 | 59% |
| Psarou | 114 | $3,339 | $721.78 | 36% |
| Pollonia | 128 | $3,247 | $316.99 | 55% |
| Plintri | 146 | $3,195 | $575.49 | 38% |
| Platys Gialos | 221 | $3,129 | $408.65 | 46% |