Naousa Airbnb Market Analysis 2026: Short Term Rental Data & Vacation Rental Statistics in Aegean, Greece
Is Airbnb profitable in Naousa in 2026? Explore comprehensive Airbnb analytics for Naousa, Aegean, Greece to uncover income potential. This 2026 STR market report for Naousa, based on AirROI data from February 2025 to January 2026, reveals key trends in the market of 612 active listings.
Whether you're considering an Airbnb investment in Naousa, optimizing your existing vacation rental, or exploring rental arbitrage opportunities, understanding the Naousa Airbnb data is crucial. Navigating the high regulation landscape is key to maximizing your short term rental income potential. Let's dive into the specifics.
Key Naousa Airbnb Performance Metrics Overview
Monthly Airbnb Revenue Variations & Income Potential in Naousa (2026)
Understanding the monthly revenue variations for Airbnb listings in Naousa is key to maximizing your short term rental income potential. Seasonality significantly impacts earnings. Our analysis, based on data from the past 12 months, shows that the peak revenue month for STRs in Naousa is typically August, while February often presents the lowest earnings, highlighting opportunities for strategic pricing adjustments during shoulder and low seasons. Explore the typical Airbnb income in Naousa across different performance tiers:
- Best-in-class properties (Top 10%) achieve $8,558+ monthly, often utilizing dynamic pricing and superior guest experiences.
- Strong performing properties (Top 25%) earn $4,928 or more, indicating effective management and desirable locations/amenities.
- Typical properties (Median) generate around $2,875 per month, representing the average market performance.
- Entry-level properties (Bottom 25%) see earnings around $1,575, often with potential for optimization.
Average Monthly Airbnb Earnings Trend in Naousa
Naousa Airbnb Occupancy Rate Trends (2026)
Maximize your bookings by understanding the Naousa STR occupancy trends. Seasonal demand shifts significantly influence how often properties are booked. Typically, Augustsees the highest demand (peak season occupancy), while January experiences the lowest (low season). Effective strategies, like adjusting minimum stays or offering promotions, can boost occupancy during slower periods. Here's how different property tiers perform in Naousa:
- Best-in-class properties (Top 10%) achieve 79%+ occupancy, indicating high desirability and potentially optimized availability.
- Strong performing properties (Top 25%) maintain 63% or higher occupancy, suggesting good market fit and guest satisfaction.
- Typical properties (Median) have an occupancy rate around 41%.
- Entry-level properties (Bottom 25%) average 24% occupancy, potentially facing higher vacancy.
Average Monthly Occupancy Rate Trend in Naousa
Average Daily Rate (ADR) Airbnb Trends in Naousa (2026)
Effective short term rental pricing strategy in Naousa involves understanding monthly ADR fluctuations. The Average Daily Rate (ADR) for Airbnb in Naousa typically peaks in August and dips lowest during April. Leveraging Airbnb dynamic pricing tools or strategies based on this seasonality can significantly boost revenue. Here's a look at the typical nightly rates achieved:
- Best-in-class properties (Top 10%) command rates of $632+ per night, often due to premium features or locations.
- Strong performing properties (Top 25%) achieve nightly rates of $349 or more.
- Typical properties (Median) charge around $219 per night.
- Entry-level properties (Bottom 25%) earn around $141 per night.
Average Daily Rate (ADR) Trend by Month in Naousa
Get Live Naousa Market Intelligence 👇

Explore Real-time Analytics
Airbnb Seasonality Analysis & Trends in Naousa (2026)
Peak Season (August, July, June)
- Revenue averages $8,104 per month
- Occupancy rates average 66.4%
- Daily rates average $397
Shoulder Season
- Revenue averages $3,391 per month
- Occupancy maintains around 41.3%
- Daily rates hold near $307
Low Season (January, February, December)
- Revenue drops to average $1,572 per month
- Occupancy decreases to average 24.5%
- Daily rates adjust to average $323
Seasonality Insights for Naousa
- The Airbnb seasonality in Naousa shows highly seasonal trends requiring careful strategy. While the sections above show seasonal averages, it's also insightful to look at the extremes:
- During the high season, the absolute peak month showcases Naousa's highest earning potential, with monthly revenues capable of climbing to $9,760, occupancy reaching a high of 73.0%, and ADRs peaking at $427.
- Conversely, the slowest single month of the year, typically falling within the low season, marks the market's lowest point. In this month, revenue might dip to $1,203, occupancy could drop to 21.7%, and ADRs may adjust down to $288.
- Understanding both the seasonal averages and these monthly peaks and troughs in revenue, occupancy, and ADR is crucial for maximizing your Airbnb profit potential in Naousa.
Seasonal Strategies for Maximizing Profit
- Peak Season: Maximize revenue through premium pricing and potentially longer minimum stays. Ensure high availability.
- Low Season: Offer competitive pricing, special promotions (e.g., extended stay discounts), and flexible cancellation policies. Target off-season travelers like remote workers or budget-conscious guests.
- Shoulder Seasons: Implement dynamic pricing that balances peak and low rates. Target weekend travelers or specific events. Offer slightly more flexible terms than peak season.
- Regularly analyze your own performance against these Naousa seasonality benchmarks and adjust your pricing and availability strategy accordingly.
Best Areas for Airbnb Investment in Naousa (2026)
Exploring the top neighborhoods for short-term rentals in Naousa? This section highlights key areas, outlining why they are attractive for hosts and guests, along with notable local attractions. Consider these locations based on your target guest profile and investment strategy.
| Neighborhood / Area | Why Host Here? (Target Guests & Appeal) | Key Attractions & Landmarks |
|---|---|---|
| Old Port | The historic port area with picturesque streets and charming architecture. Popular for tourists exploring Naousa's rich history and enjoying seaside dining. | Venetian Port, Naoussa Castle, Agios Nikolaos Monastery, Local restaurants and cafes, Traditional shops |
| Kolymbithres Beach | Famous for its unique rock formations and crystal-clear waters. Attracts beach lovers and those seeking a relaxing day by the sea. | Kolymbithres Beach, Secluded coves, Water sports activities, Beachside tavernas, Scenic walking paths |
| Naousa Town Center | The vibrant heart of Naousa with an array of shops, restaurants, and nightlife. Ideal for visitors wanting to experience the local culture. | Local boutiques, Wine bars, Nightclubs, Street festivals, Cultural events |
| Santa Maria Beach | A beloved beach known for its soft sand and water sports facilities. Great for families and young travelers. | Santa Maria Beach, Water sports rentals, Nearby beach bars, Family-friendly atmosphere, Sunset views |
| Xifara Beach | A more tranquil beach option, perfect for those seeking solitude and relaxation away from the busier tourist spots. | Xifara Beach, Crystal-clear waters, Secluded picnic areas, Walking trails, Nature views |
| Monastiri Beach | A picturesque beach surrounded by natural beauty, popular for its clear waters and scenic settings. | Monastiri Beach, Snorkeling opportunities, Beach clubs, Nature trails, Camping spots |
| Paros Park | An ecological park offering stunning landscapes and hiking trails. Attracts nature lovers and outdoor enthusiasts. | Hiking trails, Wildlife viewing, Natural beauty, Cultural events at the park, Bird watching |
| Agios Ioannis Beach | A less crowded beach ideal for relaxation and enjoying nature, with beautiful views and amenities available. | Agios Ioannis Beach, Calm waters, Beachside refreshments, Ideal for sunbathing, Tranquil environment |
Understanding Airbnb License Requirements & STR Laws in Naousa (2026)
Yes, Naousa, Aegean, Greece enforces high STR regulations. Obtaining a license and ensuring compliance is almost certainly required according to current 2026 STR laws. Always verify the latest short term rental regulations and Airbnb license requirements directly with local government authorities for Naousa to ensure full compliance before hosting.
(Source: AirROI data, 2026, based on 95% licensed listings)
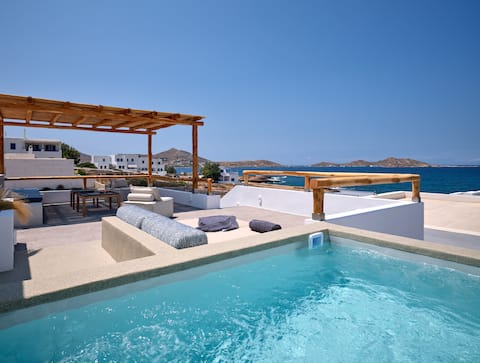
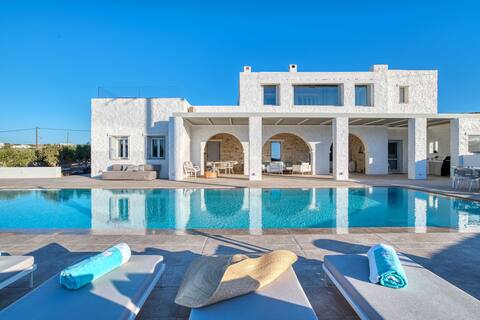
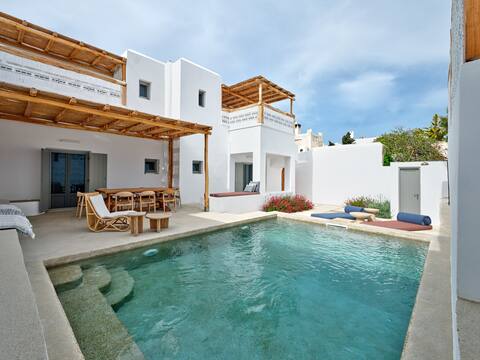
Top Performing Airbnb Properties in Naousa (2026)
Benchmark your potential! Explore examples of top-performing Airbnb properties in Naousabased on Trailing Twelve Month (TTM) revenue. Analyze their characteristics, revenue, occupancy rate, and ADR to understand what drives success in this market.
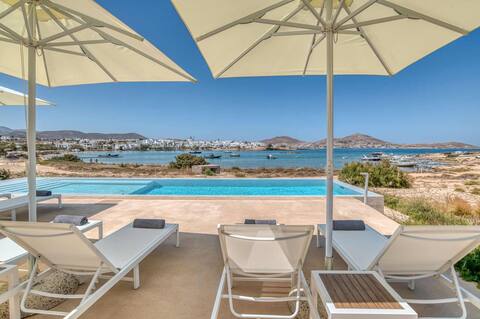
Beachfront Pool Villa – Walking Distance to Naousa
Entire Place • 7 bedrooms
Siora of Paros Malatesta & Piccolo
Entire Place • 4 bedrooms
Grand Dream Villa | Naousa Paros
Entire Place • 5 bedrooms
Siora of Paros Admiralis & Castelis
Entire Place • 4 bedrooms

Siora of Paros - Malatesta
Entire Place • 3 bedrooms

White Sand Paros Villa ENJOY
Entire Place • 5 bedrooms
Note: Performance varies based on location, size, amenities, seasonality, and management quality. Data reflects the past 12 months.
Top Performing Airbnb Hosts in Naousa (2026)
Learn from the best! This table showcases top-performing Airbnb hosts in Naousa based on the number of properties managed and estimated total revenue over the past year. Analyze their scale and performance metrics.
| Host Name | Properties | Grossing Revenue | Stay Reviews | Avg Rating |
|---|---|---|---|---|
| Bill And John | 10 | $996,222 | 286 | 4.91/5.0 |
| Whitestay | 23 | $641,248 | 1134 | 4.82/5.0 |
| Sivanis | 14 | $564,041 | 555 | 4.92/5.0 |
| Paros Rocks Estates | 10 | $461,140 | 418 | 4.92/5.0 |
| Stamatios | 7 | $433,988 | 79 | 4.93/5.0 |
| Σαπφώ | 4 | $416,995 | 71 | 4.96/5.0 |
| Antouella And Christos | 9 | $342,555 | 2400 | 4.95/5.0 |
| Mardiva Estates | 4 | $315,435 | 290 | 4.86/5.0 |
| Kyriakos | 7 | $298,558 | 212 | 4.97/5.0 |
| G M K Properties | 3 | $290,049 | 48 | 4.95/5.0 |
Analyzing the strategies of top hosts, such as their property selection, pricing, and guest communication, can offer valuable lessons for optimizing your own Airbnb operations in Naousa.
Dive Deeper: Advanced Naousa STR Market Data (2026)
Ready to unlock more insights? AirROI provides access to advanced metrics and comprehensive Airbnb data for Naousa. Explore detailed analytics beyond this report to refine your investment strategy, optimize pricing, and maximize your vacation rental profits.
Explore Advanced MetricsNaousa Short-Term Rental Market Composition (2026): Property & Room Types
Room Type Distribution
Property Type Distribution
Market Composition Insights for Naousa
- The Naousa Airbnb market composition is heavily skewed towards Entire Home/Apt listings, which make up 90% of the 612 active rentals. This indicates strong guest preference for privacy and space.
- Looking at the property type distribution in Naousa, House properties are the most common (51%), reflecting the local real estate landscape.
- Houses represent a significant 51% portion, catering likely to families or larger groups.
- The presence of 5.7% Hotel/Boutique listings indicates integration with traditional hospitality.
- Smaller segments like unique stays, others (combined 0.4%) offer potential for unique stay experiences.
Naousa Airbnb Room Capacity Analysis (2026): Bedroom Distribution
Distribution of Listings by Number of Bedrooms
Room Capacity Insights for Naousa
- The dominant room capacity in Naousa is 1 bedroom listings, making up 45.4% of the market. This suggests a strong demand for properties suitable for couples or solo travelers.
- Together, 1 bedroom and 2 bedrooms properties represent 74.3% of the active Airbnb listings in Naousa, indicating a high concentration in these sizes.
Naousa Vacation Rental Guest Capacity Trends (2026)
Distribution of Listings by Guest Capacity
Guest Capacity Insights for Naousa
- The most common guest capacity trend in Naousa vacation rentals is listings accommodating 4 guests (31.7%). This suggests the primary traveler segment is likely small families or groups.
- Properties designed for 4 guests and 2 guests dominate the Naousa STR market, accounting for 51.1% of listings.
- 22.3% of properties accommodate 6+ guests, serving the market segment for larger families or group travel in Naousa.
- On average, properties in Naousa are equipped to host 4.1 guests.
Naousa Airbnb Booking Patterns (2026): Available vs. Booked Days
Available Days Distribution
Booked Days Distribution
Booking Pattern Insights for Naousa
- The most common availability pattern in Naousa falls within the 181-270 days range, representing 46.6% of listings. This suggests many properties have significant open periods on their calendars.
- Approximately 89.7% of listings show high availability (181+ days open annually), indicating potential for increased bookings or specific owner usage patterns.
- For booked days, the 91-180 days range is most frequent in Naousa (47.4%), reflecting common guest stay durations or potential owner blocking patterns.
- A notable 11.6% of properties secure long booking periods (181+ days booked per year), highlighting successful long-term rental strategies or significant owner usage.
Naousa Airbnb Minimum Stay Requirements Analysis
Distribution of Listings by Minimum Night Requirement
1 Night
37 listings
6% of total
2 Nights
95 listings
15.5% of total
3 Nights
72 listings
11.8% of total
4-6 Nights
61 listings
10% of total
7-29 Nights
7 listings
1.1% of total
30+ Nights
340 listings
55.6% of total
Key Insights
- The most prevalent minimum stay requirement in Naousa is 30+ Nights, adopted by 55.6% of listings. This highlights the market's preference for longer commitments.
- A significant segment (55.6%) caters to monthly stays (30+ nights) in Naousa, pointing to opportunities in the extended-stay market.
Recommendations
- Align with the market by considering a 30+ Nights minimum stay, as 55.6% of Naousa hosts use this setting.
- If feasible, allowing 1-night stays, especially midweek or during low season, could capture last-minute bookings, as only 6% currently do.
- Explore offering discounts for stays of 30+ nights to attract the 55.6% of the market seeking extended stays.
- Adjust minimum nights based on seasonality – potentially shorter during low season and longer during peak demand periods in Naousa.
Naousa Airbnb Cancellation Policy Trends Analysis (2026)
Limited
8 listings
1.3% of total
Super Strict 30 Days
22 listings
3.6% of total
Super Strict 60 Days
10 listings
1.6% of total
Flexible
26 listings
4.3% of total
Moderate
55 listings
9% of total
Firm
284 listings
46.5% of total
Strict
206 listings
33.7% of total
Cancellation Policy Insights for Naousa
- The prevailing Airbnb cancellation policy trend in Naousa is Firm, used by 46.5% of listings.
- A majority (80.2%) of hosts in Naousa utilize Firm or Strict policies, indicating a market where hosts prioritize booking security.
Recommendations for Hosts
- Consider adopting a Firm policy to align with the 46.5% market standard in Naousa.
- With 33.7% using Strict terms, this is a viable option in Naousa, particularly for high-value properties or during peak demand periods.
- Regularly review your cancellation policy against competitors and market demand shifts in Naousa.
Naousa STR Booking Lead Time Analysis (2026)
Average Booking Lead Time by Month
Booking Lead Time Insights for Naousa
- The overall average booking lead time for vacation rentals in Naousa is 83 days.
- Guests book furthest in advance for stays during July (average 101 days), likely coinciding with peak travel demand or local events.
- The shortest booking windows occur for stays in January (average 17 days), indicating more last-minute travel plans during this time.
- Seasonally, Summer (93 days avg.) sees the longest lead times, while Winter (36 days avg.) has the shortest, reflecting typical travel planning cycles.
Recommendations for Hosts
- Use the overall average lead time (83 days) as a baseline for your pricing and availability strategy in Naousa.
- For July stays, consider implementing length-of-stay discounts or slightly higher rates for bookings made less than 101 days out to capitalize on advance planning.
- Target marketing efforts for the Summer season well in advance (at least 93 days) to capture early planners.
- Monitor your own booking lead times against these Naousa averages to identify opportunities for dynamic pricing adjustments.
Popular & Essential Airbnb Amenities in Naousa (2026)
Amenity Prevalence
Amenity Insights for Naousa
- Essential amenities in Naousa that guests expect include: Wifi, Air conditioning. Lacking these (any) could significantly impact bookings.
- Popular amenities like Hair dryer, TV, Hangers are common but not universal. Offering these can provide a competitive edge.
Recommendations for Hosts
- Ensure your listing includes all essential amenities for Naousa: Wifi, Air conditioning.
- Prioritize adding missing essentials: Wifi, Air conditioning.
- Consider adding popular differentiators like Hair dryer or TV to increase appeal.
- Highlight unique or less common amenities you offer (e.g., hot tub, dedicated workspace, EV charger) in your listing description and photos.
- Regularly check competitor amenities in Naousa to stay competitive.
Naousa Airbnb Guest Demographics & Profile Analysis (2026)
Guest Profile Summary for Naousa
- The typical guest profile for Airbnb in Naousa consists of predominantly international visitors (99%), with top international origins including Australia, typically belonging to the Post-2000s (Gen Z/Alpha) group (50%), primarily speaking English or Spanish.
- Domestic travelers account for 1.3% of guests.
- Key international markets include United States (45.3%) and Australia (12.4%).
- Top languages spoken are English (56.6%) followed by Spanish (10.7%).
- A significant demographic segment is the Post-2000s (Gen Z/Alpha) group, representing 50% of guests.
Recommendations for Hosts
- Focus marketing internationally, particularly towards travelers from Australia.
- Tailor amenities and listing descriptions to appeal to the dominant Post-2000s (Gen Z/Alpha) demographic (e.g., highlight fast WiFi, smart home features, local guides).
- Highlight unique local experiences or amenities relevant to the primary guest profile.
- Consider seasonal promotions aligned with peak travel times for key origin markets.
Nearby Short-Term Rental Market Comparison
How does the Naousa Airbnb market stack up against its neighbors? Compare key performance metrics like average monthly revenue, ADR, and occupancy rates in surrounding areas to understand the broader regional STR landscape.
| Market | Active Properties | Monthly Revenue | Daily Rate | Avg. Occupancy |
|---|---|---|---|---|
| Faros Armenistis | 119 | $4,791 | $715.43 | 41% |
| Ia Municipal Unit | 722 | $3,844 | $396.32 | 42% |
| Agios Ioannis Diakoftis | 159 | $3,592 | $590.02 | 39% |
| Orkos | 90 | $3,536 | $419.32 | 46% |
| Municipality of Mykonos | 330 | $3,535 | $688.35 | 35% |
| Plaka | 181 | $3,420 | $285.40 | 59% |
| Psarou | 114 | $3,339 | $721.78 | 36% |
| Pollonia | 128 | $3,247 | $316.99 | 55% |
| Plintri | 146 | $3,195 | $575.49 | 38% |
| Platys Gialos | 221 | $3,129 | $408.65 | 46% |