Thira Municipal Unit Airbnb Market Analysis 2026: Short Term Rental Data & Vacation Rental Statistics in Aegean, Greece
Is Airbnb profitable in Thira Municipal Unit in 2026? Explore comprehensive Airbnb analytics for Thira Municipal Unit, Aegean, Greece to uncover income potential. This 2026 STR market report for Thira Municipal Unit, based on AirROI data from February 2025 to January 2026, reveals key trends in the bustling market of 3,007 active listings.
Whether you're considering an Airbnb investment in Thira Municipal Unit, optimizing your existing vacation rental, or exploring rental arbitrage opportunities, understanding the Thira Municipal Unit Airbnb data is crucial. Navigating the high regulation landscape is key to maximizing your short term rental income potential. Let's dive into the specifics.
Key Thira Municipal Unit Airbnb Performance Metrics Overview
Monthly Airbnb Revenue Variations & Income Potential in Thira Municipal Unit (2026)
Understanding the monthly revenue variations for Airbnb listings in Thira Municipal Unit is key to maximizing your short term rental income potential. Seasonality significantly impacts earnings. Our analysis, based on data from the past 12 months, shows that the peak revenue month for STRs in Thira Municipal Unit is typically August, while January often presents the lowest earnings, highlighting opportunities for strategic pricing adjustments during shoulder and low seasons. Explore the typical Airbnb income in Thira Municipal Unit across different performance tiers:
- Best-in-class properties (Top 10%) achieve $7,133+ monthly, often utilizing dynamic pricing and superior guest experiences.
- Strong performing properties (Top 25%) earn $3,907 or more, indicating effective management and desirable locations/amenities.
- Typical properties (Median) generate around $2,018 per month, representing the average market performance.
- Entry-level properties (Bottom 25%) see earnings around $943, often with potential for optimization.
Average Monthly Airbnb Earnings Trend in Thira Municipal Unit
Thira Municipal Unit Airbnb Occupancy Rate Trends (2026)
Maximize your bookings by understanding the Thira Municipal Unit STR occupancy trends. Seasonal demand shifts significantly influence how often properties are booked. Typically, Augustsees the highest demand (peak season occupancy), while January experiences the lowest (low season). Effective strategies, like adjusting minimum stays or offering promotions, can boost occupancy during slower periods. Here's how different property tiers perform in Thira Municipal Unit:
- Best-in-class properties (Top 10%) achieve 74%+ occupancy, indicating high desirability and potentially optimized availability.
- Strong performing properties (Top 25%) maintain 57% or higher occupancy, suggesting good market fit and guest satisfaction.
- Typical properties (Median) have an occupancy rate around 34%.
- Entry-level properties (Bottom 25%) average 16% occupancy, potentially facing higher vacancy.
Average Monthly Occupancy Rate Trend in Thira Municipal Unit
Average Daily Rate (ADR) Airbnb Trends in Thira Municipal Unit (2026)
Effective short term rental pricing strategy in Thira Municipal Unit involves understanding monthly ADR fluctuations. The Average Daily Rate (ADR) for Airbnb in Thira Municipal Unit typically peaks in August and dips lowest during October. Leveraging Airbnb dynamic pricing tools or strategies based on this seasonality can significantly boost revenue. Here's a look at the typical nightly rates achieved:
- Best-in-class properties (Top 10%) command rates of $521+ per night, often due to premium features or locations.
- Strong performing properties (Top 25%) achieve nightly rates of $309 or more.
- Typical properties (Median) charge around $184 per night.
- Entry-level properties (Bottom 25%) earn around $123 per night.
Average Daily Rate (ADR) Trend by Month in Thira Municipal Unit
Get Live Thira Municipal Unit Market Intelligence 👇

Explore Real-time Analytics
Airbnb Seasonality Analysis & Trends in Thira Municipal Unit (2026)
Peak Season (August, July, September)
- Revenue averages $4,825 per month
- Occupancy rates average 50.5%
- Daily rates average $315
Shoulder Season
- Revenue averages $3,126 per month
- Occupancy maintains around 37.5%
- Daily rates hold near $265
Low Season (January, February, December)
- Revenue drops to average $1,804 per month
- Occupancy decreases to average 26.7%
- Daily rates adjust to average $259
Seasonality Insights for Thira Municipal Unit
- The Airbnb seasonality in Thira Municipal Unit shows highly seasonal trends requiring careful strategy. While the sections above show seasonal averages, it's also insightful to look at the extremes:
- During the high season, the absolute peak month showcases Thira Municipal Unit's highest earning potential, with monthly revenues capable of climbing to $5,380, occupancy reaching a high of 54.5%, and ADRs peaking at $326.
- Conversely, the slowest single month of the year, typically falling within the low season, marks the market's lowest point. In this month, revenue might dip to $1,606, occupancy could drop to 23.8%, and ADRs may adjust down to $245.
- Understanding both the seasonal averages and these monthly peaks and troughs in revenue, occupancy, and ADR is crucial for maximizing your Airbnb profit potential in Thira Municipal Unit.
Seasonal Strategies for Maximizing Profit
- Peak Season: Maximize revenue through premium pricing and potentially longer minimum stays. Ensure high availability.
- Low Season: Offer competitive pricing, special promotions (e.g., extended stay discounts), and flexible cancellation policies. Target off-season travelers like remote workers or budget-conscious guests.
- Shoulder Seasons: Implement dynamic pricing that balances peak and low rates. Target weekend travelers or specific events. Offer slightly more flexible terms than peak season.
- Regularly analyze your own performance against these Thira Municipal Unit seasonality benchmarks and adjust your pricing and availability strategy accordingly.
Best Areas for Airbnb Investment in Thira Municipal Unit (2026)
Exploring the top neighborhoods for short-term rentals in Thira Municipal Unit? This section highlights key areas, outlining why they are attractive for hosts and guests, along with notable local attractions. Consider these locations based on your target guest profile and investment strategy.
| Neighborhood / Area | Why Host Here? (Target Guests & Appeal) | Key Attractions & Landmarks |
|---|---|---|
| Fira | The bustling capital of Santorini with stunning caldera views, vibrant shopping, and nightlife. Fira attracts tourists year-round and is ideal for guests looking for convenience and beauty. | Fira promenade, Museum of Prehistoric Thera, Orthodox Metropolitan Cathedral, Cable car to the old port, Shopping and dining options |
| Oia | Famous for its picturesque sunsets and whitewashed buildings, Oia is a must-visit village that attracts couples and honeymooners. Its romantic atmosphere and breathtaking views make it highly desirable for Airbnb. | Sunset in Oia, Castle of Oia, Oia's narrow streets, Amoudi Bay, Art galleries and boutiques |
| Imerovigli | Known as the 'balcony to the Aegean', Imerovigli offers luxurious accommodations with less crowding than Fira or Oia. It's perfect for guests seeking tranquility and breathtaking views of the caldera. | Skaros Rock, Panagia Theoskepasti Chapel, Infinity pools, Local tavernas, Hiking trails to Oia |
| Akrotiri | Home to the ancient ruins of Akrotiri, this area offers a unique blend of history and stunning beaches. It's popular with families and those wanting a quieter stay with cultural attractions. | Akrotiri archaeological site, Red Beach, Akrotiri Lighthouse, Local wineries, Nature walks |
| Perissa | Known for its black sand beach and lively beach bars, Perissa is popular among younger tourists and beach lovers. A great spot for affordable accommodations close to the beach. | Perissa Beach, Ancient Thera, Water sports, Beachfront restaurants, Nightlife options |
| Kamari | Another beautiful beach area with a vibrant promenade, Kamari attracts sun-seekers and families. It offers a wide range of dining options and beachfront activities. | Kamari Beach, Ancient Thera, Water sports, Cinemas on the beach, Dining and nightlife |
| Pyrgos | A charming village known for its traditional architecture and panoramic views of Santorini. It's less touristy, appealing to guests looking for an authentic Santorini experience away from crowds. | Pyrgos Kallistis, Local wineries, Traditional tavernas, Hiking trails, Scenic viewpoints |
| Vothonas | This lesser-known village provides a glimpse into local life in Santorini, making it appealing for travelers interested in culture and local experiences. It’s close to the beach and main attractions. | Local bakeries, Charming streets, Nearby beaches, Cultural experiences, Wine tasting tours |
Understanding Airbnb License Requirements & STR Laws in Thira Municipal Unit (2026)
Yes, Thira Municipal Unit, Aegean, Greece enforces high STR regulations. Obtaining a license and ensuring compliance is almost certainly required according to current 2026 STR laws. Always verify the latest short term rental regulations and Airbnb license requirements directly with local government authorities for Thira Municipal Unit to ensure full compliance before hosting.
(Source: AirROI data, 2026, based on 92% licensed listings)
Top Performing Airbnb Properties in Thira Municipal Unit (2026)
Benchmark your potential! Explore examples of top-performing Airbnb properties in Thira Municipal Unitbased on Trailing Twelve Month (TTM) revenue. Analyze their characteristics, revenue, occupancy rate, and ADR to understand what drives success in this market.
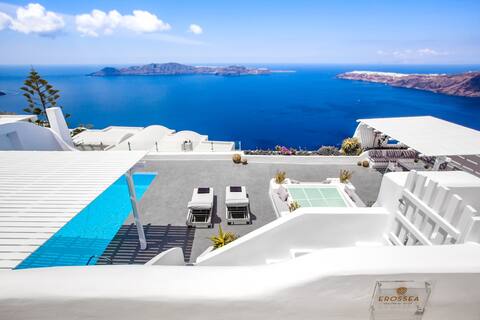
Erossea Villa-Imerovigli Santorini
Entire Place • 5 bedrooms

LUXURY PRIVATE VILLA WITH UNIQUE SUNSET VIEW
Entire Place • 8 bedrooms

Santorini Mansion Volcano & Sea View up to 17pax
Entire Place • 6 bedrooms

Three bedroom Villa with two Caldera View Jacuzzi
Entire Place • 3 bedrooms

Antelmi luxury villa caldera firostefani
Entire Place • 4 bedrooms

LyMaRou Collection, 7 Suites, Pool, 7 Priv Hot Tub
Entire Place • 7 bedrooms
Note: Performance varies based on location, size, amenities, seasonality, and management quality. Data reflects the past 12 months.
Top Performing Airbnb Hosts in Thira Municipal Unit (2026)
Learn from the best! This table showcases top-performing Airbnb hosts in Thira Municipal Unit based on the number of properties managed and estimated total revenue over the past year. Analyze their scale and performance metrics.
| Host Name | Properties | Grossing Revenue | Stay Reviews | Avg Rating |
|---|---|---|---|---|
| Dragons Group | 46 | $1,245,799 | 1419 | 4.78/5.0 |
| El Verano | 9 | $833,552 | 359 | 4.98/5.0 |
| Chantal | 8 | $791,541 | 511 | 4.99/5.0 |
| Santorini Sky | 8 | $761,295 | 659 | 4.96/5.0 |
| Petros | 12 | $674,558 | 355 | 4.85/5.0 |
| Stavroula | 6 | $618,774 | 200 | 4.99/5.0 |
| Filita | 3 | $572,551 | 153 | 4.96/5.0 |
| Anna & Teo | 10 | $561,308 | 1039 | 4.93/5.0 |
| Aesthesis Villas | 7 | $547,895 | 361 | 4.88/5.0 |
| Christos | 17 | $543,848 | 647 | 4.85/5.0 |
Analyzing the strategies of top hosts, such as their property selection, pricing, and guest communication, can offer valuable lessons for optimizing your own Airbnb operations in Thira Municipal Unit.
Dive Deeper: Advanced Thira Municipal Unit STR Market Data (2026)
Ready to unlock more insights? AirROI provides access to advanced metrics and comprehensive Airbnb data for Thira Municipal Unit. Explore detailed analytics beyond this report to refine your investment strategy, optimize pricing, and maximize your vacation rental profits.
Explore Advanced MetricsThira Municipal Unit Short-Term Rental Market Composition (2026): Property & Room Types
Room Type Distribution
Property Type Distribution
Market Composition Insights for Thira Municipal Unit
- The Thira Municipal Unit Airbnb market composition is heavily skewed towards Entire Home/Apt listings, which make up 75.5% of the 3,007 active rentals. This indicates strong guest preference for privacy and space.
- Looking at the property type distribution in Thira Municipal Unit, House properties are the most common (45.7%), reflecting the local real estate landscape.
- Houses represent a significant 45.7% portion, catering likely to families or larger groups.
- The presence of 17.9% Hotel/Boutique listings indicates integration with traditional hospitality.
- Smaller segments like others (combined 1.5%) offer potential for unique stay experiences.
Thira Municipal Unit Airbnb Room Capacity Analysis (2026): Bedroom Distribution
Distribution of Listings by Number of Bedrooms
Room Capacity Insights for Thira Municipal Unit
- The dominant room capacity in Thira Municipal Unit is 1 bedroom listings, making up 59.1% of the market. This suggests a strong demand for properties suitable for couples or solo travelers.
- Together, 1 bedroom and 2 bedrooms properties represent 82.7% of the active Airbnb listings in Thira Municipal Unit, indicating a high concentration in these sizes.
- With over half the market (59.1%) consisting of studios or 1-bedroom units, Thira Municipal Unit is particularly well-suited for individuals or couples.
Thira Municipal Unit Vacation Rental Guest Capacity Trends (2026)
Distribution of Listings by Guest Capacity
Guest Capacity Insights for Thira Municipal Unit
- The most common guest capacity trend in Thira Municipal Unit vacation rentals is listings accommodating 2 guests (27.3%). This suggests the primary traveler segment is likely couples or solo travelers.
- Properties designed for 2 guests and 4 guests dominate the Thira Municipal Unit STR market, accounting for 51.5% of listings.
- 16.5% of properties accommodate 6+ guests, serving the market segment for larger families or group travel in Thira Municipal Unit.
- On average, properties in Thira Municipal Unit are equipped to host 3.7 guests.
Thira Municipal Unit Airbnb Booking Patterns (2026): Available vs. Booked Days
Available Days Distribution
Booked Days Distribution
Booking Pattern Insights for Thira Municipal Unit
- The most common availability pattern in Thira Municipal Unit falls within the 271-366 days range, representing 61.2% of listings. This suggests many properties have significant open periods on their calendars.
- Approximately 91.5% of listings show high availability (181+ days open annually), indicating potential for increased bookings or specific owner usage patterns.
- For booked days, the 31-90 days range is most frequent in Thira Municipal Unit (34.1%), reflecting common guest stay durations or potential owner blocking patterns.
- A notable 9.5% of properties secure long booking periods (181+ days booked per year), highlighting successful long-term rental strategies or significant owner usage.
Thira Municipal Unit Airbnb Minimum Stay Requirements Analysis
Distribution of Listings by Minimum Night Requirement
1 Night
859 listings
28.6% of total
2 Nights
628 listings
20.9% of total
3 Nights
144 listings
4.8% of total
4-6 Nights
36 listings
1.2% of total
7-29 Nights
6 listings
0.2% of total
30+ Nights
1334 listings
44.4% of total
Key Insights
- The most prevalent minimum stay requirement in Thira Municipal Unit is 30+ Nights, adopted by 44.4% of listings. This highlights the market's preference for longer commitments.
- A significant segment (44.4%) caters to monthly stays (30+ nights) in Thira Municipal Unit, pointing to opportunities in the extended-stay market.
Recommendations
- Align with the market by considering a 30+ Nights minimum stay, as 44.4% of Thira Municipal Unit hosts use this setting.
- If feasible, allowing 1-night stays, especially midweek or during low season, could capture last-minute bookings, as only 28.6% currently do.
- Explore offering discounts for stays of 30+ nights to attract the 44.4% of the market seeking extended stays.
- Adjust minimum nights based on seasonality – potentially shorter during low season and longer during peak demand periods in Thira Municipal Unit.
Thira Municipal Unit Airbnb Cancellation Policy Trends Analysis (2026)
Super Strict 30 Days
50 listings
1.7% of total
Super Strict 60 Days
37 listings
1.2% of total
Limited
47 listings
1.6% of total
Flexible
167 listings
5.6% of total
Moderate
326 listings
10.9% of total
Firm
1515 listings
50.5% of total
Strict
858 listings
28.6% of total
Cancellation Policy Insights for Thira Municipal Unit
- The prevailing Airbnb cancellation policy trend in Thira Municipal Unit is Firm, used by 50.5% of listings.
- A majority (79.1%) of hosts in Thira Municipal Unit utilize Firm or Strict policies, indicating a market where hosts prioritize booking security.
Recommendations for Hosts
- Consider adopting a Firm policy to align with the 50.5% market standard in Thira Municipal Unit.
- Regularly review your cancellation policy against competitors and market demand shifts in Thira Municipal Unit.
Thira Municipal Unit STR Booking Lead Time Analysis (2026)
Average Booking Lead Time by Month
Booking Lead Time Insights for Thira Municipal Unit
- The overall average booking lead time for vacation rentals in Thira Municipal Unit is 74 days.
- Guests book furthest in advance for stays during March (average 100 days), likely coinciding with peak travel demand or local events.
- The shortest booking windows occur for stays in January (average 55 days), indicating more last-minute travel plans during this time.
- Seasonally, Spring (85 days avg.) sees the longest lead times, while Summer (70 days avg.) has the shortest, reflecting typical travel planning cycles.
Recommendations for Hosts
- Use the overall average lead time (74 days) as a baseline for your pricing and availability strategy in Thira Municipal Unit.
- For March stays, consider implementing length-of-stay discounts or slightly higher rates for bookings made less than 100 days out to capitalize on advance planning.
- Target marketing efforts for the Spring season well in advance (at least 85 days) to capture early planners.
- Monitor your own booking lead times against these Thira Municipal Unit averages to identify opportunities for dynamic pricing adjustments.
Popular & Essential Airbnb Amenities in Thira Municipal Unit (2026)
Amenity Prevalence
Amenity Insights for Thira Municipal Unit
- Essential amenities in Thira Municipal Unit that guests expect include: Wifi, Air conditioning, TV. Lacking these (any) could significantly impact bookings.
- Popular amenities like Hair dryer, Essentials, Hangers are common but not universal. Offering these can provide a competitive edge.
Recommendations for Hosts
- Ensure your listing includes all essential amenities for Thira Municipal Unit: Wifi, Air conditioning, TV.
- Prioritize adding missing essentials: Wifi, Air conditioning, TV.
- Consider adding popular differentiators like Hair dryer or Essentials to increase appeal.
- Highlight unique or less common amenities you offer (e.g., hot tub, dedicated workspace, EV charger) in your listing description and photos.
- Regularly check competitor amenities in Thira Municipal Unit to stay competitive.
Thira Municipal Unit Airbnb Guest Demographics & Profile Analysis (2026)
Guest Profile Summary for Thira Municipal Unit
- The typical guest profile for Airbnb in Thira Municipal Unit consists of predominantly international visitors (99%), with top international origins including United Kingdom, typically belonging to the Post-2000s (Gen Z/Alpha) group (50%), primarily speaking English or French.
- Domestic travelers account for 0.9% of guests.
- Key international markets include United States (37.2%) and United Kingdom (12.8%).
- Top languages spoken are English (50.5%) followed by French (12.8%).
- A significant demographic segment is the Post-2000s (Gen Z/Alpha) group, representing 50% of guests.
Recommendations for Hosts
- Focus marketing internationally, particularly towards travelers from United Kingdom.
- Tailor amenities and listing descriptions to appeal to the dominant Post-2000s (Gen Z/Alpha) demographic (e.g., highlight fast WiFi, smart home features, local guides).
- Highlight unique local experiences or amenities relevant to the primary guest profile.
- Consider seasonal promotions aligned with peak travel times for key origin markets.
Nearby Short-Term Rental Market Comparison
How does the Thira Municipal Unit Airbnb market stack up against its neighbors? Compare key performance metrics like average monthly revenue, ADR, and occupancy rates in surrounding areas to understand the broader regional STR landscape.
| Market | Active Properties | Monthly Revenue | Daily Rate | Avg. Occupancy |
|---|---|---|---|---|
| Violi Charaki | 21 | $7,037 | $480.16 | 55% |
| Amnatos | 15 | $5,946 | $730.78 | 48% |
| Skaleta | 57 | $5,258 | $581.34 | 48% |
| Viranepiskopi | 11 | $4,940 | $322.10 | 65% |
| Perama | 27 | $4,927 | $392.67 | 52% |
| Pithari | 22 | $4,920 | $412.56 | 55% |
| Faros Armenistis | 119 | $4,791 | $715.43 | 41% |
| Xiro Chorio | 20 | $4,573 | $393.88 | 51% |
| Nea Magnisia | 22 | $4,332 | $392.45 | 52% |
| Municipality of Milopotamos | 20 | $3,882 | $348.23 | 51% |