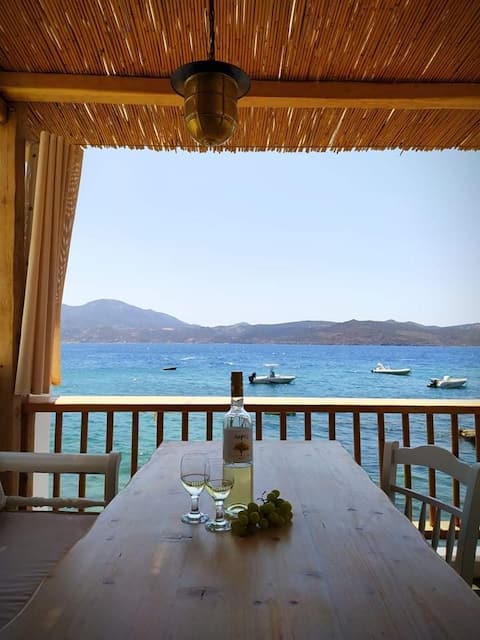
Tripiti Airbnb Market Analysis 2026: Short Term Rental Data & Vacation Rental Statistics in Aegean, Greece
Is Airbnb profitable in Tripiti in 2026? Explore comprehensive Airbnb analytics for Tripiti, Aegean, Greece to uncover income potential. This 2026 STR market report for Tripiti, based on AirROI data from February 2025 to January 2026, reveals key trends in the niche market of 82 active listings.
Whether you're considering an Airbnb investment in Tripiti, optimizing your existing vacation rental, or exploring rental arbitrage opportunities, understanding the Tripiti Airbnb data is crucial. Navigating the high regulation landscape is key to maximizing your short term rental income potential. Let's dive into the specifics.
Key Tripiti Airbnb Performance Metrics Overview
Monthly Airbnb Revenue Variations & Income Potential in Tripiti (2026)
Understanding the monthly revenue variations for Airbnb listings in Tripiti is key to maximizing your short term rental income potential. Seasonality significantly impacts earnings. Our analysis, based on data from the past 12 months, shows that the peak revenue month for STRs in Tripiti is typically August, while December often presents the lowest earnings, highlighting opportunities for strategic pricing adjustments during shoulder and low seasons. Explore the typical Airbnb income in Tripiti across different performance tiers:
- Best-in-class properties (Top 10%) achieve $6,221+ monthly, often utilizing dynamic pricing and superior guest experiences.
- Strong performing properties (Top 25%) earn $4,216 or more, indicating effective management and desirable locations/amenities.
- Typical properties (Median) generate around $2,697 per month, representing the average market performance.
- Entry-level properties (Bottom 25%) see earnings around $1,645, often with potential for optimization.
Average Monthly Airbnb Earnings Trend in Tripiti
Tripiti Airbnb Occupancy Rate Trends (2026)
Maximize your bookings by understanding the Tripiti STR occupancy trends. Seasonal demand shifts significantly influence how often properties are booked. Typically, Julysees the highest demand (peak season occupancy), while February experiences the lowest (low season). Effective strategies, like adjusting minimum stays or offering promotions, can boost occupancy during slower periods. Here's how different property tiers perform in Tripiti:
- Best-in-class properties (Top 10%) achieve 73%+ occupancy, indicating high desirability and potentially optimized availability.
- Strong performing properties (Top 25%) maintain 61% or higher occupancy, suggesting good market fit and guest satisfaction.
- Typical properties (Median) have an occupancy rate around 44%.
- Entry-level properties (Bottom 25%) average 27% occupancy, potentially facing higher vacancy.
Average Monthly Occupancy Rate Trend in Tripiti
Average Daily Rate (ADR) Airbnb Trends in Tripiti (2026)
Effective short term rental pricing strategy in Tripiti involves understanding monthly ADR fluctuations. The Average Daily Rate (ADR) for Airbnb in Tripiti typically peaks in August and dips lowest during October. Leveraging Airbnb dynamic pricing tools or strategies based on this seasonality can significantly boost revenue. Here's a look at the typical nightly rates achieved:
- Best-in-class properties (Top 10%) command rates of $425+ per night, often due to premium features or locations.
- Strong performing properties (Top 25%) achieve nightly rates of $302 or more.
- Typical properties (Median) charge around $212 per night.
- Entry-level properties (Bottom 25%) earn around $146 per night.
Average Daily Rate (ADR) Trend by Month in Tripiti
Get Live Tripiti Market Intelligence 👇

Explore Real-time Analytics
Airbnb Seasonality Analysis & Trends in Tripiti (2026)
Peak Season (August, July, September)
- Revenue averages $6,402 per month
- Occupancy rates average 67.9%
- Daily rates average $311
Shoulder Season
- Revenue averages $3,125 per month
- Occupancy maintains around 49.0%
- Daily rates hold near $233
Low Season (January, February, December)
- Revenue drops to average $689 per month
- Occupancy decreases to average 14.9%
- Daily rates adjust to average $242
Seasonality Insights for Tripiti
- The Airbnb seasonality in Tripiti shows highly seasonal trends requiring careful strategy. While the sections above show seasonal averages, it's also insightful to look at the extremes:
- During the high season, the absolute peak month showcases Tripiti's highest earning potential, with monthly revenues capable of climbing to $7,011, occupancy reaching a high of 69.4%, and ADRs peaking at $332.
- Conversely, the slowest single month of the year, typically falling within the low season, marks the market's lowest point. In this month, revenue might dip to $260, occupancy could drop to 12.5%, and ADRs may adjust down to $212.
- Understanding both the seasonal averages and these monthly peaks and troughs in revenue, occupancy, and ADR is crucial for maximizing your Airbnb profit potential in Tripiti.
Seasonal Strategies for Maximizing Profit
- Peak Season: Maximize revenue through premium pricing and potentially longer minimum stays. Ensure high availability.
- Low Season: Offer competitive pricing, special promotions (e.g., extended stay discounts), and flexible cancellation policies. Target off-season travelers like remote workers or budget-conscious guests.
- Shoulder Seasons: Implement dynamic pricing that balances peak and low rates. Target weekend travelers or specific events. Offer slightly more flexible terms than peak season.
- Regularly analyze your own performance against these Tripiti seasonality benchmarks and adjust your pricing and availability strategy accordingly.
Best Areas for Airbnb Investment in Tripiti (2026)
Exploring the top neighborhoods for short-term rentals in Tripiti? This section highlights key areas, outlining why they are attractive for hosts and guests, along with notable local attractions. Consider these locations based on your target guest profile and investment strategy.
| Neighborhood / Area | Why Host Here? (Target Guests & Appeal) | Key Attractions & Landmarks |
|---|---|---|
| Tripiti Village | Charming traditional village with authentic Greek architecture. Perfect for travelers seeking a quiet, cultural experience with a local vibe. | Tripiti Beach, The Windmill, Local tavernas, Kleftiko Cove, Ancient Theatre of Milos |
| Plaka | The beautiful capital of Milos with scenic views and traditional Cycladic architecture. A favorite for its stunning sunsets and vibrant local life. | Plaka Castle, Plaka Church, Local artisan shops, Milos Mining Museum, Adamas port |
| Pollonia | A picturesque fishing village known for its calm waters and beautiful beaches. Great for families and couples looking for a relaxing holiday. | Pollonia Beach, The Church of Agios Nikolaos, Milos Adventures, Local seafood restaurants, Boat trips to nearby islands |
| Sarakiniko | Famous for its lunar landscape and crystal-clear waters. A must-visit for nature lovers and photography enthusiasts. | Sarakiniko Beach, Unique rock formations, Snorkeling spots, Sunbathing areas, Nearby hiking trails |
| Adamas | The main port of Milos, bustling with activities and amenities. Ideal for travelers wanting easy access to transportation and services. | Adamas Beach, Port shops and cafes, Milos Sea Tour, The Church of Agios Haralambos, Local markets |
| Kapos Beach | A lesser-known beach providing serene surroundings and natural beauty. Perfect for those seeking tranquility away from crowded tourist spots. | Secluded beaches, Natural rock formations, Rustic beach bars, Local wildlife, Ideal swimming spots |
| Firopotamos | A small fishing village with stunning beach views. Great for those wanting to experience the island's beauty off the beaten path. | Firopotamos Beach, Traditional fishing boats, Local cafes, Scenic walks, Snorkeling spots |
| Tsigrado | Known for its breathtaking cliffs and secluded beach access via a steep path. A unique destination for adventurous travelers. | Tsigrado Beach, Hiking trails, Cliffside views, Natural beauty, Secluded atmosphere |
Understanding Airbnb License Requirements & STR Laws in Tripiti (2026)
Yes, Tripiti, Aegean, Greece enforces high STR regulations. Obtaining a license and ensuring compliance is almost certainly required according to current 2026 STR laws. Always verify the latest short term rental regulations and Airbnb license requirements directly with local government authorities for Tripiti to ensure full compliance before hosting.
(Source: AirROI data, 2026, based on 93% licensed listings)
Top Performing Airbnb Properties in Tripiti (2026)
Benchmark your potential! Explore examples of top-performing Airbnb properties in Tripitibased on Trailing Twelve Month (TTM) revenue. Analyze their characteristics, revenue, occupancy rate, and ADR to understand what drives success in this market.
Capetan Nikolas Boat House
Entire Place • 1 bedroom

Family Villa, Amazing Sunset View
Entire Place • 3 bedrooms

Windmill Karamitsos since 1859
Entire Place • 2 bedrooms
KLIMA BAY Beachfront Boutique Houses (Blue)
Entire Place • 2 bedrooms

Villa Blue Sky
Entire Place • 3 bedrooms
The monk boathouse
Entire Place • 1 bedroom
Note: Performance varies based on location, size, amenities, seasonality, and management quality. Data reflects the past 12 months.
Top Performing Airbnb Hosts in Tripiti (2026)
Learn from the best! This table showcases top-performing Airbnb hosts in Tripiti based on the number of properties managed and estimated total revenue over the past year. Analyze their scale and performance metrics.
| Host Name | Properties | Grossing Revenue | Stay Reviews | Avg Rating |
|---|---|---|---|---|
| Nikos | 12 | $416,176 | 282 | 4.84/5.0 |
| Dimitrios | 6 | $221,204 | 182 | 4.81/5.0 |
| Niki | 1 | $96,341 | 95 | 5.00/5.0 |
| Sofia | 2 | $93,251 | 88 | 4.88/5.0 |
| Giannis | 1 | $92,720 | 118 | 4.97/5.0 |
| Anezina | 3 | $91,899 | 103 | 4.98/5.0 |
| Maria | 1 | $88,326 | 4 | 5.00/5.0 |
| Στυλιανός Ζανεσης Και | 2 | $84,358 | 94 | 4.96/5.0 |
| Marinos | 2 | $81,781 | 81 | 4.88/5.0 |
| Aristidis | 1 | $64,321 | 77 | 4.94/5.0 |
Analyzing the strategies of top hosts, such as their property selection, pricing, and guest communication, can offer valuable lessons for optimizing your own Airbnb operations in Tripiti.
Dive Deeper: Advanced Tripiti STR Market Data (2026)
Ready to unlock more insights? AirROI provides access to advanced metrics and comprehensive Airbnb data for Tripiti. Explore detailed analytics beyond this report to refine your investment strategy, optimize pricing, and maximize your vacation rental profits.
Explore Advanced MetricsTripiti Short-Term Rental Market Composition (2026): Property & Room Types
Room Type Distribution
Property Type Distribution
Market Composition Insights for Tripiti
- The Tripiti Airbnb market composition is heavily skewed towards Entire Home/Apt listings, which make up 95.1% of the 82 active rentals. This indicates strong guest preference for privacy and space.
- Looking at the property type distribution in Tripiti, House properties are the most common (68.3%), reflecting the local real estate landscape.
- Houses represent a significant 68.3% portion, catering likely to families or larger groups.
- Smaller segments like hotel/boutique, unique stays, others, outdoor/unique (combined 10.9%) offer potential for unique stay experiences.
Tripiti Airbnb Room Capacity Analysis (2026): Bedroom Distribution
Distribution of Listings by Number of Bedrooms
Room Capacity Insights for Tripiti
- The dominant room capacity in Tripiti is 1 bedroom listings, making up 47.6% of the market. This suggests a strong demand for properties suitable for couples or solo travelers.
- Together, 1 bedroom and 2 bedrooms properties represent 90.3% of the active Airbnb listings in Tripiti, indicating a high concentration in these sizes.
- Listings with 3+ bedrooms (4.9%) represent a smaller niche, potentially indicating an underserved market for larger group accommodations in Tripiti.
Tripiti Vacation Rental Guest Capacity Trends (2026)
Distribution of Listings by Guest Capacity
Guest Capacity Insights for Tripiti
- The most common guest capacity trend in Tripiti vacation rentals is listings accommodating 4 guests (42.7%). This suggests the primary traveler segment is likely small families or groups.
- Properties designed for 4 guests and 2 guests dominate the Tripiti STR market, accounting for 68.3% of listings.
- On average, properties in Tripiti are equipped to host 3.6 guests.
Tripiti Airbnb Booking Patterns (2026): Available vs. Booked Days
Available Days Distribution
Booked Days Distribution
Booking Pattern Insights for Tripiti
- The most common availability pattern in Tripiti falls within the 181-270 days range, representing 54.9% of listings. This suggests many properties have significant open periods on their calendars.
- Approximately 87.8% of listings show high availability (181+ days open annually), indicating potential for increased bookings or specific owner usage patterns.
- For booked days, the 91-180 days range is most frequent in Tripiti (54.9%), reflecting common guest stay durations or potential owner blocking patterns.
- A notable 12.2% of properties secure long booking periods (181+ days booked per year), highlighting successful long-term rental strategies or significant owner usage.
Tripiti Airbnb Minimum Stay Requirements Analysis
Distribution of Listings by Minimum Night Requirement
1 Night
3 listings
3.7% of total
2 Nights
17 listings
20.7% of total
3 Nights
5 listings
6.1% of total
4-6 Nights
4 listings
4.9% of total
30+ Nights
53 listings
64.6% of total
Key Insights
- The most prevalent minimum stay requirement in Tripiti is 30+ Nights, adopted by 64.6% of listings. This highlights the market's preference for longer commitments.
- A significant segment (64.6%) caters to monthly stays (30+ nights) in Tripiti, pointing to opportunities in the extended-stay market.
Recommendations
- Align with the market by considering a 30+ Nights minimum stay, as 64.6% of Tripiti hosts use this setting.
- If feasible, allowing 1-night stays, especially midweek or during low season, could capture last-minute bookings, as only 3.7% currently do.
- Explore offering discounts for stays of 30+ nights to attract the 64.6% of the market seeking extended stays.
- Adjust minimum nights based on seasonality – potentially shorter during low season and longer during peak demand periods in Tripiti.
Tripiti Airbnb Cancellation Policy Trends Analysis (2026)
Super Strict 30 Days
8 listings
9.8% of total
Flexible
4 listings
4.9% of total
Moderate
10 listings
12.2% of total
Firm
39 listings
47.6% of total
Strict
21 listings
25.6% of total
Cancellation Policy Insights for Tripiti
- The prevailing Airbnb cancellation policy trend in Tripiti is Firm, used by 47.6% of listings.
- A majority (73.2%) of hosts in Tripiti utilize Firm or Strict policies, indicating a market where hosts prioritize booking security.
Recommendations for Hosts
- Consider adopting a Firm policy to align with the 47.6% market standard in Tripiti.
- Regularly review your cancellation policy against competitors and market demand shifts in Tripiti.
Tripiti STR Booking Lead Time Analysis (2026)
Average Booking Lead Time by Month
Booking Lead Time Insights for Tripiti
- The overall average booking lead time for vacation rentals in Tripiti is 81 days.
- Guests book furthest in advance for stays during August (average 105 days), likely coinciding with peak travel demand or local events.
- The shortest booking windows occur for stays in December (average 0 days), indicating more last-minute travel plans during this time.
- Seasonally, Summer (90 days avg.) sees the longest lead times, while Winter (39 days avg.) has the shortest, reflecting typical travel planning cycles.
Recommendations for Hosts
- Use the overall average lead time (81 days) as a baseline for your pricing and availability strategy in Tripiti.
- For August stays, consider implementing length-of-stay discounts or slightly higher rates for bookings made less than 105 days out to capitalize on advance planning.
- During December, focus on last-minute booking availability and promotions, as guests book with very short notice (0 days avg.).
- Target marketing efforts for the Summer season well in advance (at least 90 days) to capture early planners.
- Monitor your own booking lead times against these Tripiti averages to identify opportunities for dynamic pricing adjustments.
Popular & Essential Airbnb Amenities in Tripiti (2026)
Amenity Prevalence
Amenity Insights for Tripiti
- Essential amenities in Tripiti that guests expect include: Hair dryer, Hot water. Lacking these (any) could significantly impact bookings.
- Popular amenities like Air conditioning, Wifi, Essentials are common but not universal. Offering these can provide a competitive edge.
- Warning: Wifi is not universally provided but is considered essential globally. Ensure reliable Wifi is offered.
Recommendations for Hosts
- Ensure your listing includes all essential amenities for Tripiti: Hair dryer, Hot water.
- Prioritize adding missing essentials: Hair dryer, Hot water.
- Consider adding popular differentiators like Air conditioning or Wifi to increase appeal.
- Highlight unique or less common amenities you offer (e.g., hot tub, dedicated workspace, EV charger) in your listing description and photos.
- Regularly check competitor amenities in Tripiti to stay competitive.
Tripiti Airbnb Guest Demographics & Profile Analysis (2026)
Guest Profile Summary for Tripiti
- The typical guest profile for Airbnb in Tripiti consists of predominantly international visitors (99%), with top international origins including Australia, typically belonging to the Post-2000s (Gen Z/Alpha) group (50%), primarily speaking English or French.
- Domestic travelers account for 0.8% of guests.
- Key international markets include United States (34.2%) and Australia (12.9%).
- Top languages spoken are English (51.3%) followed by French (15%).
- A significant demographic segment is the Post-2000s (Gen Z/Alpha) group, representing 50% of guests.
Recommendations for Hosts
- Focus marketing internationally, particularly towards travelers from Australia.
- Tailor amenities and listing descriptions to appeal to the dominant Post-2000s (Gen Z/Alpha) demographic (e.g., highlight fast WiFi, smart home features, local guides).
- Highlight unique local experiences or amenities relevant to the primary guest profile.
- Consider seasonal promotions aligned with peak travel times for key origin markets.
Nearby Short-Term Rental Market Comparison
How does the Tripiti Airbnb market stack up against its neighbors? Compare key performance metrics like average monthly revenue, ADR, and occupancy rates in surrounding areas to understand the broader regional STR landscape.
| Market | Active Properties | Monthly Revenue | Daily Rate | Avg. Occupancy |
|---|---|---|---|---|
| Violi Charaki | 21 | $7,037 | $480.16 | 55% |
| Amnatos | 15 | $5,946 | $730.78 | 48% |
| Skaleta | 57 | $5,258 | $581.34 | 48% |
| Viranepiskopi | 11 | $4,940 | $322.10 | 65% |
| Perama | 27 | $4,927 | $392.67 | 52% |
| Pithari | 22 | $4,920 | $412.56 | 55% |
| Faros Armenistis | 119 | $4,791 | $715.43 | 41% |
| Xiro Chorio | 20 | $4,573 | $393.88 | 51% |
| Nea Magnisia | 22 | $4,332 | $392.45 | 52% |
| Municipality of Milopotamos | 20 | $3,882 | $348.23 | 51% |