Kypseli Airbnb Market Analysis 2026: Short Term Rental Data & Vacation Rental Statistics in Attica, Greece
Is Airbnb profitable in Kypseli in 2026? Explore comprehensive Airbnb analytics for Kypseli, Attica, Greece to uncover income potential. This 2026 STR market report for Kypseli, based on AirROI data from February 2025 to January 2026, reveals key trends in the niche market of 21 active listings.
Whether you're considering an Airbnb investment in Kypseli, optimizing your existing vacation rental, or exploring rental arbitrage opportunities, understanding the Kypseli Airbnb data is crucial. Navigating the high regulation landscape is key to maximizing your short term rental income potential. Let's dive into the specifics.
Key Kypseli Airbnb Performance Metrics Overview
Monthly Airbnb Revenue Variations & Income Potential in Kypseli (2026)
Understanding the monthly revenue variations for Airbnb listings in Kypseli is key to maximizing your short term rental income potential. Seasonality significantly impacts earnings. Our analysis, based on data from the past 12 months, shows that the peak revenue month for STRs in Kypseli is typically August, while February often presents the lowest earnings, highlighting opportunities for strategic pricing adjustments during shoulder and low seasons. Explore the typical Airbnb income in Kypseli across different performance tiers:
- Best-in-class properties (Top 10%) achieve $5,696+ monthly, often utilizing dynamic pricing and superior guest experiences.
- Strong performing properties (Top 25%) earn $3,067 or more, indicating effective management and desirable locations/amenities.
- Typical properties (Median) generate around $1,301 per month, representing the average market performance.
- Entry-level properties (Bottom 25%) see earnings around $570, often with potential for optimization.
Average Monthly Airbnb Earnings Trend in Kypseli
Kypseli Airbnb Occupancy Rate Trends (2026)
Maximize your bookings by understanding the Kypseli STR occupancy trends. Seasonal demand shifts significantly influence how often properties are booked. Typically, Augustsees the highest demand (peak season occupancy), while December experiences the lowest (low season). Effective strategies, like adjusting minimum stays or offering promotions, can boost occupancy during slower periods. Here's how different property tiers perform in Kypseli:
- Best-in-class properties (Top 10%) achieve 54%+ occupancy, indicating high desirability and potentially optimized availability.
- Strong performing properties (Top 25%) maintain 41% or higher occupancy, suggesting good market fit and guest satisfaction.
- Typical properties (Median) have an occupancy rate around 26%.
- Entry-level properties (Bottom 25%) average 13% occupancy, potentially facing higher vacancy.
Average Monthly Occupancy Rate Trend in Kypseli
Average Daily Rate (ADR) Airbnb Trends in Kypseli (2026)
Effective short term rental pricing strategy in Kypseli involves understanding monthly ADR fluctuations. The Average Daily Rate (ADR) for Airbnb in Kypseli typically peaks in August and dips lowest during February. Leveraging Airbnb dynamic pricing tools or strategies based on this seasonality can significantly boost revenue. Here's a look at the typical nightly rates achieved:
- Best-in-class properties (Top 10%) command rates of $440+ per night, often due to premium features or locations.
- Strong performing properties (Top 25%) achieve nightly rates of $230 or more.
- Typical properties (Median) charge around $137 per night.
- Entry-level properties (Bottom 25%) earn around $111 per night.
Average Daily Rate (ADR) Trend by Month in Kypseli
Get Live Kypseli Market Intelligence 👇

Explore Real-time Analytics
Airbnb Seasonality Analysis & Trends in Kypseli (2026)
Peak Season (August, July, October)
- Revenue averages $4,000 per month
- Occupancy rates average 43.7%
- Daily rates average $216
Shoulder Season
- Revenue averages $1,996 per month
- Occupancy maintains around 25.6%
- Daily rates hold near $197
Low Season (January, February, March)
- Revenue drops to average $1,221 per month
- Occupancy decreases to average 19.4%
- Daily rates adjust to average $190
Seasonality Insights for Kypseli
- The Airbnb seasonality in Kypseli shows highly seasonal trends requiring careful strategy. While the sections above show seasonal averages, it's also insightful to look at the extremes:
- During the high season, the absolute peak month showcases Kypseli's highest earning potential, with monthly revenues capable of climbing to $4,992, occupancy reaching a high of 58.6%, and ADRs peaking at $227.
- Conversely, the slowest single month of the year, typically falling within the low season, marks the market's lowest point. In this month, revenue might dip to $808, occupancy could drop to 14.5%, and ADRs may adjust down to $185.
- Understanding both the seasonal averages and these monthly peaks and troughs in revenue, occupancy, and ADR is crucial for maximizing your Airbnb profit potential in Kypseli.
Seasonal Strategies for Maximizing Profit
- Peak Season: Maximize revenue through premium pricing and potentially longer minimum stays. Ensure high availability.
- Low Season: Offer competitive pricing, special promotions (e.g., extended stay discounts), and flexible cancellation policies. Target off-season travelers like remote workers or budget-conscious guests.
- Shoulder Seasons: Implement dynamic pricing that balances peak and low rates. Target weekend travelers or specific events. Offer slightly more flexible terms than peak season.
- Regularly analyze your own performance against these Kypseli seasonality benchmarks and adjust your pricing and availability strategy accordingly.
Best Areas for Airbnb Investment in Kypseli (2026)
Exploring the top neighborhoods for short-term rentals in Kypseli? This section highlights key areas, outlining why they are attractive for hosts and guests, along with notable local attractions. Consider these locations based on your target guest profile and investment strategy.
| Neighborhood / Area | Why Host Here? (Target Guests & Appeal) | Key Attractions & Landmarks |
|---|---|---|
| Platia Viktorias | A vibrant square known for its multicultural atmosphere and proximity to major transportation hubs. It attracts both local and international visitors looking to experience authentic Greek culture and urban life. | Viktoria Square, National Archaeological Museum, Kifisias Avenue, Pagrati Cemetery |
| Liosion Street | A bustling street lined with shops, cafes, and eateries, perfect for those wanting to engage in daily Athenian life. The area is convenient for travelers seeking a local experience away from tourist traps. | Liosion Street Cafes, Local Markets, Street Art, Community Parks |
| Fokionos Negri | Fokionos Negri is known for its leafy streets and relaxed vibe, making it a favorite for locals and visitors alike. It features charming cafes and parks, ideal for relaxed stays. | Fokionos Negri Park, Local Cafes, Bakery Shops, Art Work Shops |
| Kiprou | This area offers a unique blend of residential charm and urban accessibility, with various dining options and local markets. It's great for those wanting both comfort and convenience. | Kiprou Square, Local Dining Spots, Nearby Parks, Art Galleries |
| Kifisia | Kifisia is an upscale neighborhood known for its shops, cafes, and green spaces. It is perfect for families or professionals seeking a quieter, affluent neighborhood close to the city. | Kifisia Square, Shopping Streets, Parks and Gardens, Local Restaurants |
| Nea Filadelfeia | A suburb with a strong community feel, featuring parks and cafes. It's ideal for people looking for a longer-term stay in a more residential area with easy access to the city. | Parks, Local Eateries, Community Markets, Cafes |
| Exarchia | Known for its bohemian culture and artistic vibes, Exarchia attracts young audiences and creative spirits. Perfect for those wanting to experience Athenian countercultural life. | Exarchia Square, Street Art, Local Bars, Art Exhibitions |
| Kolonos | A working-class neighborhood that is undergoing gentrification, making it an affordable option for visitors while still close to central attractions. | Local Markets, Historical Sites, Small Cafes, Street Vendors |
Understanding Airbnb License Requirements & STR Laws in Kypseli (2026)
Yes, Kypseli, Attica, Greece enforces high STR regulations. Obtaining a license and ensuring compliance is almost certainly required according to current 2026 STR laws. Always verify the latest short term rental regulations and Airbnb license requirements directly with local government authorities for Kypseli to ensure full compliance before hosting.
(Source: AirROI data, 2026, based on 86% licensed listings)
Top Performing Airbnb Properties in Kypseli (2026)
Benchmark your potential! Explore examples of top-performing Airbnb properties in Kypselibased on Trailing Twelve Month (TTM) revenue. Analyze their characteristics, revenue, occupancy rate, and ADR to understand what drives success in this market.
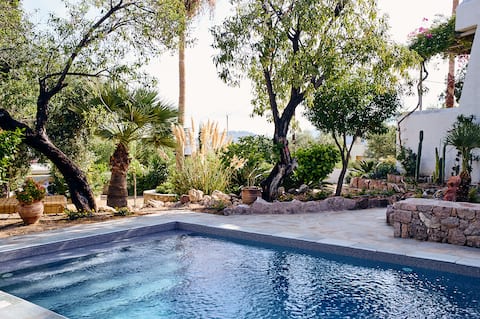
Villa Adara, pool and sea view
Entire Place • 4 bedrooms

Villa Calypso, idyllic pool villa & sea view
Entire Place • 5 bedrooms
Artist house with amazing sea view
Entire Place • 4 bedrooms

Villa Nirome xlarge private pool
Entire Place • 3 bedrooms

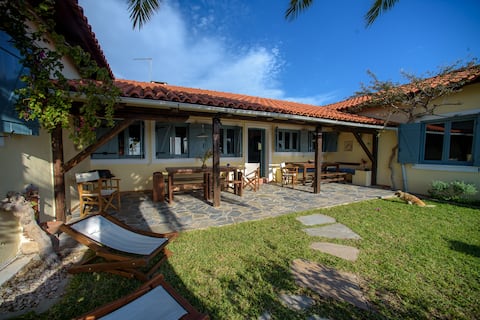
Secret Garden Residence
Entire Place • 2 bedrooms

Villa Waterfront in 4,5
Entire Place • 3 bedrooms
Note: Performance varies based on location, size, amenities, seasonality, and management quality. Data reflects the past 12 months.
Top Performing Airbnb Hosts in Kypseli (2026)
Learn from the best! This table showcases top-performing Airbnb hosts in Kypseli based on the number of properties managed and estimated total revenue over the past year. Analyze their scale and performance metrics.
| Host Name | Properties | Grossing Revenue | Stay Reviews | Avg Rating |
|---|---|---|---|---|
| Isabelle | 2 | $142,790 | 11 | 5.00/5.0 |
| Lmproperties | 2 | $43,340 | 14 | 4.69/5.0 |
| Alexandra | 1 | $29,830 | 16 | 4.94/5.0 |
| Themis | 1 | $11,973 | 3 | 5.00/5.0 |
| Αντωνια | 1 | $11,872 | 16 | 4.81/5.0 |
| Frangki | 1 | $10,286 | 2 | Not Rated |
| Μαρια | 1 | $9,161 | 8 | 5.00/5.0 |
| Panos | 2 | $8,309 | 23 | 4.67/5.0 |
| Dafni | 1 | $8,031 | 7 | 4.86/5.0 |
| Bruno | 1 | $7,719 | 6 | 4.83/5.0 |
Analyzing the strategies of top hosts, such as their property selection, pricing, and guest communication, can offer valuable lessons for optimizing your own Airbnb operations in Kypseli.
Dive Deeper: Advanced Kypseli STR Market Data (2026)
Ready to unlock more insights? AirROI provides access to advanced metrics and comprehensive Airbnb data for Kypseli. Explore detailed analytics beyond this report to refine your investment strategy, optimize pricing, and maximize your vacation rental profits.
Explore Advanced MetricsKypseli Short-Term Rental Market Composition (2026): Property & Room Types
Room Type Distribution
Property Type Distribution
Market Composition Insights for Kypseli
- The Kypseli Airbnb market composition is heavily skewed towards Entire Home/Apt listings, which make up 95.2% of the 21 active rentals. This indicates strong guest preference for privacy and space.
- Looking at the property type distribution in Kypseli, House properties are the most common (85.7%), reflecting the local real estate landscape.
- Houses represent a significant 85.7% portion, catering likely to families or larger groups.
- Smaller segments like apartment/condo, unique stays, hotel/boutique (combined 14.4%) offer potential for unique stay experiences.
Kypseli Airbnb Room Capacity Analysis (2026): Bedroom Distribution
Distribution of Listings by Number of Bedrooms
Room Capacity Insights for Kypseli
- The dominant room capacity in Kypseli is 1 bedroom listings, making up 33.3% of the market. This suggests a strong demand for properties suitable for couples or solo travelers.
- Together, 1 bedroom and 2 bedrooms properties represent 61.9% of the active Airbnb listings in Kypseli, indicating a high concentration in these sizes.
- A significant 38.1% of listings offer 3+ bedrooms, catering to larger groups and families seeking more space in Kypseli.
Kypseli Vacation Rental Guest Capacity Trends (2026)
Distribution of Listings by Guest Capacity
Guest Capacity Insights for Kypseli
- The most common guest capacity trend in Kypseli vacation rentals is listings accommodating 4 guests (33.3%). This suggests the primary traveler segment is likely small families or groups.
- Properties designed for 4 guests and 6 guests dominate the Kypseli STR market, accounting for 52.3% of listings.
- 47.5% of properties accommodate 6+ guests, serving the market segment for larger families or group travel in Kypseli.
- On average, properties in Kypseli are equipped to host 5.1 guests.
Kypseli Airbnb Booking Patterns (2026): Available vs. Booked Days
Available Days Distribution
Booked Days Distribution
Booking Pattern Insights for Kypseli
- The most common availability pattern in Kypseli falls within the 271-366 days range, representing 90.5% of listings. This suggests many properties have significant open periods on their calendars.
- Approximately 100.0% of listings show high availability (181+ days open annually), indicating potential for increased bookings or specific owner usage patterns.
- For booked days, the 31-90 days range is most frequent in Kypseli (57.1%), reflecting common guest stay durations or potential owner blocking patterns.
Kypseli Airbnb Minimum Stay Requirements Analysis
Distribution of Listings by Minimum Night Requirement
1 Night
4 listings
19% of total
2 Nights
5 listings
23.8% of total
3 Nights
1 listings
4.8% of total
4-6 Nights
5 listings
23.8% of total
7-29 Nights
2 listings
9.5% of total
30+ Nights
4 listings
19% of total
Key Insights
- The most prevalent minimum stay requirement in Kypseli is 2 Nights, adopted by 23.8% of listings. This highlights the market's preference for shorter, flexible bookings.
- A significant segment (19%) caters to monthly stays (30+ nights) in Kypseli, pointing to opportunities in the extended-stay market.
Recommendations
- Align with the market by considering a 2 Nights minimum stay, as 23.8% of Kypseli hosts use this setting.
- If feasible, allowing 1-night stays, especially midweek or during low season, could capture last-minute bookings, as only 19% currently do.
- Explore offering discounts for stays of 30+ nights to attract the 19% of the market seeking extended stays.
- Adjust minimum nights based on seasonality – potentially shorter during low season and longer during peak demand periods in Kypseli.
Kypseli Airbnb Cancellation Policy Trends Analysis (2026)
Flexible
2 listings
10% of total
Moderate
1 listings
5% of total
Firm
12 listings
60% of total
Strict
5 listings
25% of total
Cancellation Policy Insights for Kypseli
- The prevailing Airbnb cancellation policy trend in Kypseli is Firm, used by 60% of listings.
- A majority (85.0%) of hosts in Kypseli utilize Firm or Strict policies, indicating a market where hosts prioritize booking security.
Recommendations for Hosts
- Consider adopting a Firm policy to align with the 60% market standard in Kypseli.
- Regularly review your cancellation policy against competitors and market demand shifts in Kypseli.
Kypseli STR Booking Lead Time Analysis (2026)
Average Booking Lead Time by Month
Booking Lead Time Insights for Kypseli
- The overall average booking lead time for vacation rentals in Kypseli is 37 days.
- Guests book furthest in advance for stays during August (average 72 days), likely coinciding with peak travel demand or local events.
- The shortest booking windows occur for stays in December (average 1 days), indicating more last-minute travel plans during this time.
- Seasonally, Summer (40 days avg.) sees the longest lead times, while Winter (8 days avg.) has the shortest, reflecting typical travel planning cycles.
Recommendations for Hosts
- Use the overall average lead time (37 days) as a baseline for your pricing and availability strategy in Kypseli.
- For August stays, consider implementing length-of-stay discounts or slightly higher rates for bookings made less than 72 days out to capitalize on advance planning.
- During December, focus on last-minute booking availability and promotions, as guests book with very short notice (1 days avg.).
- Target marketing efforts for the Summer season well in advance (at least 40 days) to capture early planners.
- Monitor your own booking lead times against these Kypseli averages to identify opportunities for dynamic pricing adjustments.
Popular & Essential Airbnb Amenities in Kypseli (2026)
Amenity Prevalence
Amenity Insights for Kypseli
- Essential amenities in Kypseli that guests expect include: Wifi, Kitchen, Air conditioning. Lacking these (any) could significantly impact bookings.
- Popular amenities like Coffee maker, Refrigerator, TV are common but not universal. Offering these can provide a competitive edge.
Recommendations for Hosts
- Ensure your listing includes all essential amenities for Kypseli: Wifi, Kitchen, Air conditioning.
- Prioritize adding missing essentials: Wifi, Kitchen, Air conditioning.
- Consider adding popular differentiators like Coffee maker or Refrigerator to increase appeal.
- Highlight unique or less common amenities you offer (e.g., hot tub, dedicated workspace, EV charger) in your listing description and photos.
- Regularly check competitor amenities in Kypseli to stay competitive.
Kypseli Airbnb Guest Demographics & Profile Analysis (2026)
Guest Profile Summary for Kypseli
- The typical guest profile for Airbnb in Kypseli consists of a mix of domestic (41%) and international guests, with top international origins including France, typically belonging to the Post-2000s (Gen Z/Alpha) group (50%), primarily speaking English or Greek.
- Domestic travelers account for 41.4% of guests.
- Key international markets include Greece (41.4%) and France (13.8%).
- Top languages spoken are English (36.7%) followed by Greek (20%).
- A significant demographic segment is the Post-2000s (Gen Z/Alpha) group, representing 50% of guests.
Recommendations for Hosts
- Balance marketing efforts between domestic and international channels based on the guest mix.
- Tailor amenities and listing descriptions to appeal to the dominant Post-2000s (Gen Z/Alpha) demographic (e.g., highlight fast WiFi, smart home features, local guides).
- Highlight unique local experiences or amenities relevant to the primary guest profile.
- Consider seasonal promotions aligned with peak travel times for key origin markets.
Nearby Short-Term Rental Market Comparison
How does the Kypseli Airbnb market stack up against its neighbors? Compare key performance metrics like average monthly revenue, ADR, and occupancy rates in surrounding areas to understand the broader regional STR landscape.
| Market | Active Properties | Monthly Revenue | Daily Rate | Avg. Occupancy |
|---|---|---|---|---|
| Plaka | 181 | $3,420 | $285.40 | 59% |
| Pollonia | 128 | $3,247 | $316.99 | 55% |
| Πλατύς Γιαλός | 10 | $2,927 | $373.22 | 41% |
| Hydra | 330 | $2,844 | $282.51 | 50% |
| Pera Triovassalos | 61 | $2,606 | $239.07 | 57% |
| Panormos | 181 | $2,580 | $257.56 | 46% |
| Tripiti | 82 | $2,484 | $252.19 | 54% |
| Municipality of Milos | 113 | $2,422 | $221.00 | 55% |
| Plaka | 26 | $2,263 | $362.94 | 48% |
| Vouliagmeni Municipal Unit | 183 | $2,263 | $238.50 | 44% |