Marathon Airbnb Market Analysis 2025: Short Term Rental Data & Vacation Rental Statistics in Attica, Greece
Is Airbnb profitable in Marathon in 2025? Explore comprehensive Airbnb analytics for Marathon, Attica, Greece to uncover income potential. This 2025 STR market report for Marathon, based on AirROI data from October 2024 to September 2025, reveals key trends in the niche market of 18 active listings.
Whether you're considering an Airbnb investment in Marathon, optimizing your existing vacation rental, or exploring rental arbitrage opportunities, understanding the Marathon Airbnb data is crucial. Navigating the high regulation landscape is key to maximizing your short term rental income potential. Let's dive into the specifics.
Key Marathon Airbnb Performance Metrics Overview
Monthly Airbnb Revenue Variations & Income Potential in Marathon (2025)
Understanding the monthly revenue variations for Airbnb listings in Marathon is key to maximizing your short term rental income potential. Seasonality significantly impacts earnings. Our analysis, based on data from the past 12 months, shows that the peak revenue month for STRs in Marathon is typically January, while May often presents the lowest earnings, highlighting opportunities for strategic pricing adjustments during shoulder and low seasons. Explore the typical Airbnb income in Marathon across different performance tiers:
- Best-in-class properties (Top 10%) achieve $4,401+ monthly, often utilizing dynamic pricing and superior guest experiences.
- Strong performing properties (Top 25%) earn $1,459 or more, indicating effective management and desirable locations/amenities.
- Typical properties (Median) generate around $641 per month, representing the average market performance.
- Entry-level properties (Bottom 25%) see earnings around $398, often with potential for optimization.
Average Monthly Airbnb Earnings Trend in Marathon
Marathon Airbnb Occupancy Rate Trends (2025)
Maximize your bookings by understanding the Marathon STR occupancy trends. Seasonal demand shifts significantly influence how often properties are booked. Typically, Augustsees the highest demand (peak season occupancy), while March experiences the lowest (low season). Effective strategies, like adjusting minimum stays or offering promotions, can boost occupancy during slower periods. Here's how different property tiers perform in Marathon:
- Best-in-class properties (Top 10%) achieve 56%+ occupancy, indicating high desirability and potentially optimized availability.
- Strong performing properties (Top 25%) maintain 37% or higher occupancy, suggesting good market fit and guest satisfaction.
- Typical properties (Median) have an occupancy rate around 20%.
- Entry-level properties (Bottom 25%) average 13% occupancy, potentially facing higher vacancy.
Average Monthly Occupancy Rate Trend in Marathon
Average Daily Rate (ADR) Airbnb Trends in Marathon (2025)
Effective short term rental pricing strategy in Marathon involves understanding monthly ADR fluctuations. The Average Daily Rate (ADR) for Airbnb in Marathon typically peaks in August and dips lowest during February. Leveraging Airbnb dynamic pricing tools or strategies based on this seasonality can significantly boost revenue. Here's a look at the typical nightly rates achieved:
- Best-in-class properties (Top 10%) command rates of $236+ per night, often due to premium features or locations.
- Strong performing properties (Top 25%) achieve nightly rates of $148 or more.
- Typical properties (Median) charge around $109 per night.
- Entry-level properties (Bottom 25%) earn around $68 per night.
Average Daily Rate (ADR) Trend by Month in Marathon
Get Live Marathon Market Intelligence 👇

Explore Real-time Analytics
Airbnb Seasonality Analysis & Trends in Marathon (2025)
Peak Season (January, August, July)
- Revenue averages $2,708 per month
- Occupancy rates average 38.0%
- Daily rates average $157
Shoulder Season
- Revenue averages $1,172 per month
- Occupancy maintains around 26.1%
- Daily rates hold near $144
Low Season (February, March, May)
- Revenue drops to average $731 per month
- Occupancy decreases to average 18.4%
- Daily rates adjust to average $136
Seasonality Insights for Marathon
- The Airbnb seasonality in Marathon shows highly seasonal trends requiring careful strategy. While the sections above show seasonal averages, it's also insightful to look at the extremes:
- During the high season, the absolute peak month showcases Marathon's highest earning potential, with monthly revenues capable of climbing to $3,298, occupancy reaching a high of 47.6%, and ADRs peaking at $172.
- Conversely, the slowest single month of the year, typically falling within the low season, marks the market's lowest point. In this month, revenue might dip to $692, occupancy could drop to 14.5%, and ADRs may adjust down to $131.
- Understanding both the seasonal averages and these monthly peaks and troughs in revenue, occupancy, and ADR is crucial for maximizing your Airbnb profit potential in Marathon.
Seasonal Strategies for Maximizing Profit
- Peak Season: Maximize revenue through premium pricing and potentially longer minimum stays. Ensure high availability.
- Low Season: Offer competitive pricing, special promotions (e.g., extended stay discounts), and flexible cancellation policies. Target off-season travelers like remote workers or budget-conscious guests.
- Shoulder Seasons: Implement dynamic pricing that balances peak and low rates. Target weekend travelers or specific events. Offer slightly more flexible terms than peak season.
- Regularly analyze your own performance against these Marathon seasonality benchmarks and adjust your pricing and availability strategy accordingly.
Best Areas for Airbnb Investment in Marathon (2025)
Exploring the top neighborhoods for short-term rentals in Marathon? This section highlights key areas, outlining why they are attractive for hosts and guests, along with notable local attractions. Consider these locations based on your target guest profile and investment strategy.
| Neighborhood / Area | Why Host Here? (Target Guests & Appeal) | Key Attractions & Landmarks |
|---|---|---|
| Marathon Beach | A stunning beach destination with crystal-clear waters and sandy shores, ideal for families and beach lovers. Close to local eateries and shops, this area attracts both tourists and locals. | Marathon Beach, Agios Nikolaos Beach, Water sports activities, Local tavernas, Cycling paths |
| Kea Island (near Marathon) | A picturesque island that is perfect for guests seeking a quieter getaway with beautiful nature and village charm. Popular for hiking and exploring traditional Greek villages. | Kea Island beaches, Hiking trails, Traditional villages, Local cuisine, Scenic views |
| Schinias | Known for its lush pine forest and beautiful beach, Schinias is popular among those who enjoy outdoor activities like hiking and windsurfing. A great spot for nature lovers looking for a peaceful retreat. | Schinias Beach, Marathon National Park, Windsurfing and kitesurfing, Nature trails, Picnic areas |
| Nea Makri | A charming coastal town that offers a blend of beachside relaxation and local culture. Great for families and couples, with easy access to Athens and local dining options. | Nea Makri Beach, Marathon Tomb, Local seafood restaurants, Cycling routes, Kayaking opportunities |
| Marathon | An area rich in history, known for the famous Battle of Marathon. Great for history buffs and tourists interested in Greek heritage, with museums and archaeological sites nearby. | Marathon Archaeological Museum, The Marathon Tomb, Historical sites, Local history tours, Nearby nature areas |
| Agrilios Kampos | A tranquil, lesser-known area with beautiful views and access to the sea. Perfect for those looking for a peaceful escape, away from the more tourist-heavy locations. | Quiet beaches, Seaside walking paths, Local tavernas, Views of the Aegean Sea, Tranquil nature |
| Platia Kentriki | The main square of Marathon and a lively hub with cafes and shops. Attracts visitors for its vibrant atmosphere and is within walking distance to local attractions. | Central square cafes, Local markets, Nearby shops, Cultural events, Public parks |
| Rafina | A nearby coastal town that serves as a ferry port to the Cyclades. Offers visitors great dining options and a lively harbor atmosphere, attracting tourists headed to nearby islands. | Rafina Port, Local fish markets, Dining along the harbor, Nearby beaches, Cyclades ferry connections |
Understanding Airbnb License Requirements & STR Laws in Marathon (2025)
Yes, Marathon, Attica, Greece enforces high STR regulations. Obtaining a license and ensuring compliance is almost certainly required according to current 2025 STR laws. Always verify the latest short term rental regulations and Airbnb license requirements directly with local government authorities for Marathon to ensure full compliance before hosting.
(Source: AirROI data, 2025, based on 56% licensed listings)
Top Performing Airbnb Properties in Marathon (2025)
Benchmark your potential! Explore examples of top-performing Airbnb properties in Marathonbased on Trailing Twelve Month (TTM) revenue. Analyze their characteristics, revenue, occupancy rate, and ADR to understand what drives success in this market.
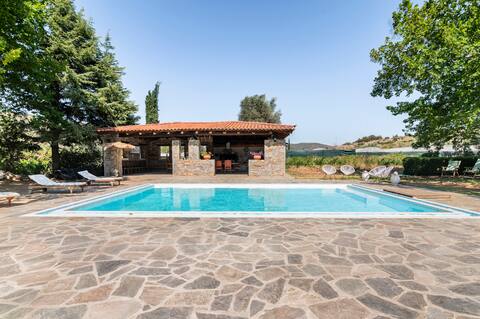
Estate Villa OINOI for Luxury Vacation and Events
Entire Place • 5 bedrooms

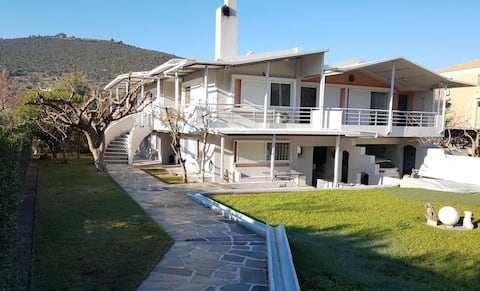
3 or 5 Bedroom Beachfront Villa amid Pine Trees.
Entire Place • 5 bedrooms
Μarathon Runner
Entire Place • 3 bedrooms
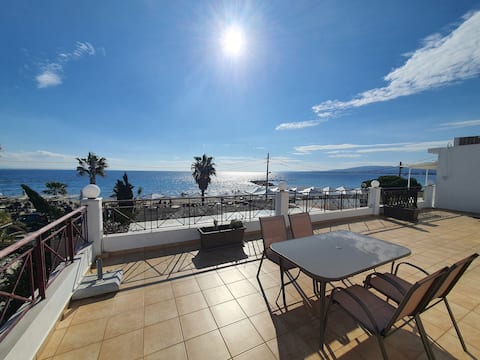
Waterfront apartment, Marathon beach
Entire Place • 1 bedroom
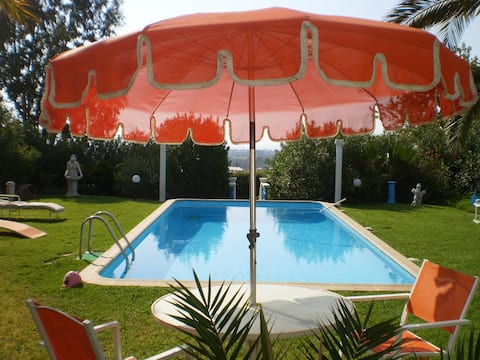
Paradise Cool Place
Entire Place • 2 bedrooms

OLIVE TREE
Entire Place • 1 bedroom
Note: Performance varies based on location, size, amenities, seasonality, and management quality. Data reflects the past 12 months.
Top Performing Airbnb Hosts in Marathon (2025)
Learn from the best! This table showcases top-performing Airbnb hosts in Marathon based on the number of properties managed and estimated total revenue over the past year. Analyze their scale and performance metrics.
| Host Name | Properties | Grossing Revenue | Stay Reviews | Avg Rating |
|---|---|---|---|---|
| EuRoCec | 1 | $53,549 | 9 | 4.89/5.0 |
| Konstantinos | 1 | $18,466 | 15 | 5.00/5.0 |
| Tryfon | 1 | $15,001 | 7 | 5.00/5.0 |
| Foteini | 1 | $12,673 | 44 | 4.89/5.0 |
| Georgina Jane | 1 | $12,100 | 6 | 5.00/5.0 |
| Calypso | 1 | $7,847 | 62 | 4.89/5.0 |
| Eleni | 2 | $7,151 | 14 | 5.00/5.0 |
| Χριστόφορος | 1 | $5,956 | 8 | 4.13/5.0 |
| George | 1 | $4,277 | 30 | 4.90/5.0 |
| Άγγελος | 1 | $3,985 | 1 | Not Rated |
Analyzing the strategies of top hosts, such as their property selection, pricing, and guest communication, can offer valuable lessons for optimizing your own Airbnb operations in Marathon.
Dive Deeper: Advanced Marathon STR Market Data (2025)
Ready to unlock more insights? AirROI provides access to advanced metrics and comprehensive Airbnb data for Marathon. Explore detailed analytics beyond this report to refine your investment strategy, optimize pricing, and maximize your vacation rental profits.
Explore Advanced MetricsMarathon Short-Term Rental Market Composition (2025): Property & Room Types
Room Type Distribution
Property Type Distribution
Market Composition Insights for Marathon
- The Marathon Airbnb market composition is heavily skewed towards Entire Home/Apt listings, which make up 100% of the 18 active rentals. This indicates strong guest preference for privacy and space.
- Looking at the property type distribution in Marathon, House properties are the most common (83.3%), reflecting the local real estate landscape.
- Houses represent a significant 83.3% portion, catering likely to families or larger groups.
Marathon Airbnb Room Capacity Analysis (2025): Bedroom Distribution
Distribution of Listings by Number of Bedrooms
Room Capacity Insights for Marathon
- The dominant room capacity in Marathon is 2 bedrooms listings, making up 50% of the market. This suggests a strong demand for properties suitable for couples or solo travelers.
- Together, 2 bedrooms and 1 bedroom properties represent 66.7% of the active Airbnb listings in Marathon, indicating a high concentration in these sizes.
- A significant 22.2% of listings offer 3+ bedrooms, catering to larger groups and families seeking more space in Marathon.
Marathon Vacation Rental Guest Capacity Trends (2025)
Distribution of Listings by Guest Capacity
Guest Capacity Insights for Marathon
- The most common guest capacity trend in Marathon vacation rentals is listings accommodating 6 guests (33.3%). This suggests the primary traveler segment is likely larger groups.
- Properties designed for 6 guests and 4 guests dominate the Marathon STR market, accounting for 66.6% of listings.
- 44.4% of properties accommodate 6+ guests, serving the market segment for larger families or group travel in Marathon.
- On average, properties in Marathon are equipped to host 5.2 guests.
Marathon Airbnb Booking Patterns (2025): Available vs. Booked Days
Available Days Distribution
Booked Days Distribution
Booking Pattern Insights for Marathon
- The most common availability pattern in Marathon falls within the 271-366 days range, representing 83.3% of listings. This suggests many properties have significant open periods on their calendars.
- Approximately 100.0% of listings show high availability (181+ days open annually), indicating potential for increased bookings or specific owner usage patterns.
- For booked days, the 1-30 days range is most frequent in Marathon (44.4%), reflecting common guest stay durations or potential owner blocking patterns.
Marathon Airbnb Minimum Stay Requirements Analysis
Distribution of Listings by Minimum Night Requirement
3 Nights
6 listings
33.3% of total
4-6 Nights
7 listings
38.9% of total
7-29 Nights
1 listings
5.6% of total
30+ Nights
4 listings
22.2% of total
Key Insights
- The most prevalent minimum stay requirement in Marathon is 4-6 Nights, adopted by 38.9% of listings. This highlights the market's preference for longer commitments.
- A significant segment (22.2%) caters to monthly stays (30+ nights) in Marathon, pointing to opportunities in the extended-stay market.
Recommendations
- Align with the market by considering a 4-6 Nights minimum stay, as 38.9% of Marathon hosts use this setting.
- Explore offering discounts for stays of 30+ nights to attract the 22.2% of the market seeking extended stays.
- Adjust minimum nights based on seasonality – potentially shorter during low season and longer during peak demand periods in Marathon.
Marathon Airbnb Cancellation Policy Trends Analysis (2025)
Super Strict 30 Days
1 listings
5.6% of total
Flexible
1 listings
5.6% of total
Moderate
5 listings
27.8% of total
Firm
4 listings
22.2% of total
Strict
7 listings
38.9% of total
Cancellation Policy Insights for Marathon
- The prevailing Airbnb cancellation policy trend in Marathon is Strict, used by 38.9% of listings.
- A majority (61.1%) of hosts in Marathon utilize Firm or Strict policies, indicating a market where hosts prioritize booking security.
Recommendations for Hosts
- Consider adopting a Strict policy to align with the 38.9% market standard in Marathon.
- With 38.9% using Strict terms, this is a viable option in Marathon, particularly for high-value properties or during peak demand periods.
- Regularly review your cancellation policy against competitors and market demand shifts in Marathon.
Marathon STR Booking Lead Time Analysis (2025)
Average Booking Lead Time by Month
Booking Lead Time Insights for Marathon
- The overall average booking lead time for vacation rentals in Marathon is 38 days.
- Guests book furthest in advance for stays during November (average 108 days), likely coinciding with peak travel demand or local events.
- The shortest booking windows occur for stays in December (average 4 days), indicating more last-minute travel plans during this time.
- Seasonally, Fall (72 days avg.) sees the longest lead times, while Winter (6 days avg.) has the shortest, reflecting typical travel planning cycles.
Recommendations for Hosts
- Use the overall average lead time (38 days) as a baseline for your pricing and availability strategy in Marathon.
- For November stays, consider implementing length-of-stay discounts or slightly higher rates for bookings made less than 108 days out to capitalize on advance planning.
- During December, focus on last-minute booking availability and promotions, as guests book with very short notice (4 days avg.).
- Target marketing efforts for the Fall season well in advance (at least 72 days) to capture early planners.
- Monitor your own booking lead times against these Marathon averages to identify opportunities for dynamic pricing adjustments.
Popular & Essential Airbnb Amenities in Marathon (2025)
Amenity Prevalence
Amenity Insights for Marathon
- Essential amenities in Marathon that guests expect include: Kitchen. Lacking these (this) could significantly impact bookings.
- Popular amenities like Cooking basics, Refrigerator, Dishes and silverware are common but not universal. Offering these can provide a competitive edge.
- Warning: Wifi is not universally provided but is considered essential globally. Ensure reliable Wifi is offered.
Recommendations for Hosts
- Ensure your listing includes all essential amenities for Marathon: Kitchen.
- Consider adding popular differentiators like Cooking basics or Refrigerator to increase appeal.
- Highlight unique or less common amenities you offer (e.g., hot tub, dedicated workspace, EV charger) in your listing description and photos.
- Regularly check competitor amenities in Marathon to stay competitive.
Marathon Airbnb Guest Demographics & Profile Analysis (2025)
Guest Profile Summary for Marathon
- The typical guest profile for Airbnb in Marathon consists of predominantly international visitors (83%), with top international origins including Greece, typically belonging to the Post-2000s (Gen Z/Alpha) group (50%), primarily speaking English or French.
- Domestic travelers account for 16.7% of guests.
- Key international markets include France (16.7%) and Greece (16.7%).
- Top languages spoken are English (40.7%) followed by French (14.8%).
- A significant demographic segment is the Post-2000s (Gen Z/Alpha) group, representing 50% of guests.
Recommendations for Hosts
- Focus marketing internationally, particularly towards travelers from Greece.
- Tailor amenities and listing descriptions to appeal to the dominant Post-2000s (Gen Z/Alpha) demographic (e.g., highlight fast WiFi, smart home features, local guides).
- Highlight unique local experiences or amenities relevant to the primary guest profile.
- Consider seasonal promotions aligned with peak travel times for key origin markets.
Nearby Short-Term Rental Market Comparison
How does the Marathon Airbnb market stack up against its neighbors? Compare key performance metrics like average monthly revenue, ADR, and occupancy rates in surrounding areas to understand the broader regional STR landscape.
| Market | Active Properties | Monthly Revenue | Daily Rate | Avg. Occupancy |
|---|---|---|---|---|
| Hydra | 337 | $2,633 | $273.84 | 47% |
| Skiathos Municipality | 64 | $2,264 | $431.62 | 44% |
| Achladias | 93 | $2,251 | $351.14 | 46% |
| Vouliagmeni Municipal Unit | 193 | $2,111 | $232.65 | 42% |
| Agios Dimitrios | 17 | $2,009 | $252.00 | 32% |
| Municipal Unit of Ayios Konstantinos | 13 | $1,986 | $302.85 | 30% |
| Nerotrivia | 15 | $1,961 | $208.97 | 43% |
| Magoula | 13 | $1,933 | $280.33 | 33% |
| Municipality of Sifnos | 46 | $1,898 | $191.79 | 50% |
| Municipality of North Kynouria | 12 | $1,856 | $286.03 | 32% |