Paiania Municipal Unit Airbnb Market Analysis 2026: Short Term Rental Data & Vacation Rental Statistics in Attica, Greece
Is Airbnb profitable in Paiania Municipal Unit in 2026? Explore comprehensive Airbnb analytics for Paiania Municipal Unit, Attica, Greece to uncover income potential. This 2026 STR market report for Paiania Municipal Unit, based on AirROI data from February 2025 to January 2026, reveals key trends in the niche market of 31 active listings.
Whether you're considering an Airbnb investment in Paiania Municipal Unit, optimizing your existing vacation rental, or exploring rental arbitrage opportunities, understanding the Paiania Municipal Unit Airbnb data is crucial. Navigating the high regulation landscape is key to maximizing your short term rental income potential. Let's dive into the specifics.
Key Paiania Municipal Unit Airbnb Performance Metrics Overview
Monthly Airbnb Revenue Variations & Income Potential in Paiania Municipal Unit (2026)
Understanding the monthly revenue variations for Airbnb listings in Paiania Municipal Unit is key to maximizing your short term rental income potential. Seasonality significantly impacts earnings. Our analysis, based on data from the past 12 months, shows that the peak revenue month for STRs in Paiania Municipal Unit is typically August, while December often presents the lowest earnings, highlighting opportunities for strategic pricing adjustments during shoulder and low seasons. Explore the typical Airbnb income in Paiania Municipal Unit across different performance tiers:
- Best-in-class properties (Top 10%) achieve $2,243+ monthly, often utilizing dynamic pricing and superior guest experiences.
- Strong performing properties (Top 25%) earn $1,464 or more, indicating effective management and desirable locations/amenities.
- Typical properties (Median) generate around $936 per month, representing the average market performance.
- Entry-level properties (Bottom 25%) see earnings around $558, often with potential for optimization.
Average Monthly Airbnb Earnings Trend in Paiania Municipal Unit
Paiania Municipal Unit Airbnb Occupancy Rate Trends (2026)
Maximize your bookings by understanding the Paiania Municipal Unit STR occupancy trends. Seasonal demand shifts significantly influence how often properties are booked. Typically, Septembersees the highest demand (peak season occupancy), while December experiences the lowest (low season). Effective strategies, like adjusting minimum stays or offering promotions, can boost occupancy during slower periods. Here's how different property tiers perform in Paiania Municipal Unit:
- Best-in-class properties (Top 10%) achieve 70%+ occupancy, indicating high desirability and potentially optimized availability.
- Strong performing properties (Top 25%) maintain 57% or higher occupancy, suggesting good market fit and guest satisfaction.
- Typical properties (Median) have an occupancy rate around 37%.
- Entry-level properties (Bottom 25%) average 22% occupancy, potentially facing higher vacancy.
Average Monthly Occupancy Rate Trend in Paiania Municipal Unit
Average Daily Rate (ADR) Airbnb Trends in Paiania Municipal Unit (2026)
Effective short term rental pricing strategy in Paiania Municipal Unit involves understanding monthly ADR fluctuations. The Average Daily Rate (ADR) for Airbnb in Paiania Municipal Unit typically peaks in August and dips lowest during February. Leveraging Airbnb dynamic pricing tools or strategies based on this seasonality can significantly boost revenue. Here's a look at the typical nightly rates achieved:
- Best-in-class properties (Top 10%) command rates of $261+ per night, often due to premium features or locations.
- Strong performing properties (Top 25%) achieve nightly rates of $118 or more.
- Typical properties (Median) charge around $75 per night.
- Entry-level properties (Bottom 25%) earn around $58 per night.
Average Daily Rate (ADR) Trend by Month in Paiania Municipal Unit
Get Live Paiania Municipal Unit Market Intelligence 👇

Explore Real-time Analytics
Airbnb Seasonality Analysis & Trends in Paiania Municipal Unit (2026)
Peak Season (August, May, September)
- Revenue averages $2,122 per month
- Occupancy rates average 50.2%
- Daily rates average $208
Shoulder Season
- Revenue averages $1,421 per month
- Occupancy maintains around 41.4%
- Daily rates hold near $160
Low Season (January, February, December)
- Revenue drops to average $821 per month
- Occupancy decreases to average 27.6%
- Daily rates adjust to average $125
Seasonality Insights for Paiania Municipal Unit
- The Airbnb seasonality in Paiania Municipal Unit shows highly seasonal trends requiring careful strategy. While the sections above show seasonal averages, it's also insightful to look at the extremes:
- During the high season, the absolute peak month showcases Paiania Municipal Unit's highest earning potential, with monthly revenues capable of climbing to $2,213, occupancy reaching a high of 54.9%, and ADRs peaking at $235.
- Conversely, the slowest single month of the year, typically falling within the low season, marks the market's lowest point. In this month, revenue might dip to $628, occupancy could drop to 21.9%, and ADRs may adjust down to $119.
- Understanding both the seasonal averages and these monthly peaks and troughs in revenue, occupancy, and ADR is crucial for maximizing your Airbnb profit potential in Paiania Municipal Unit.
Seasonal Strategies for Maximizing Profit
- Peak Season: Maximize revenue through premium pricing and potentially longer minimum stays. Ensure high availability.
- Low Season: Offer competitive pricing, special promotions (e.g., extended stay discounts), and flexible cancellation policies. Target off-season travelers like remote workers or budget-conscious guests.
- Shoulder Seasons: Implement dynamic pricing that balances peak and low rates. Target weekend travelers or specific events. Offer slightly more flexible terms than peak season.
- Regularly analyze your own performance against these Paiania Municipal Unit seasonality benchmarks and adjust your pricing and availability strategy accordingly.
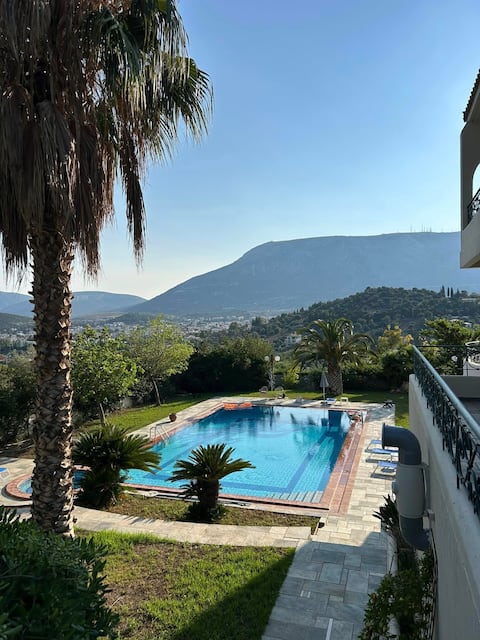
Best Areas for Airbnb Investment in Paiania Municipal Unit (2026)
Exploring the top neighborhoods for short-term rentals in Paiania Municipal Unit? This section highlights key areas, outlining why they are attractive for hosts and guests, along with notable local attractions. Consider these locations based on your target guest profile and investment strategy.
| Neighborhood / Area | Why Host Here? (Target Guests & Appeal) | Key Attractions & Landmarks |
|---|---|---|
| Center of Paiania | The central hub of Paiania, offering easy access to shops, cafes, and local amenities. It's ideal for travelers looking to experience authentic daily life in a Greek town while being close to major attractions. | Paiania Archaeological Museum, Local cafés and tavernas, St. John the Baptist Church, Parks and green spaces, Nearby suburban Metro station |
| Eastern Paiania | A quieter residential area with a more laid-back feel, perfect for families and long-term stays. Offers a mix of local culture and proximity to parks and outdoor spaces. | Private gardens, Parks, Family-friendly activities, Local markets, Walks in nature |
| Montofoli | Known for its lush vineyards and wineries, Montofoli attracts wine enthusiasts and nature lovers. It's perfect for guests looking for a rural getaway while still being close to Athens. | Local wineries, Trekking routes, Nature reserves, Scenic vineyard views, Cultural wine tasting experiences |
| Byron's Hill | A picturesque neighborhood offering stunning views of the surrounding area, attracting nature lovers and those who appreciate scenic vistas. A great spot for relaxation and nature exploration. | Scenic viewpoints, Nature trails, Outdoor activities, Nearby hiking trails, Peaceful ambiance |
| Near Attica Zoo | Close to the popular Attica Zoo, this area is perfect for families traveling with children. It offers fun activities and educational experiences for all ages. | Attica Zoo, Parks for children, Family-friendly entertainment, Outdoor play areas, Cafés |
| Cultural District | Home to various cultural sites and museums, this district is attractive to tourists interested in history and art. A great place to learn about Greek heritage. | Cultural museums, Art galleries, Historical landmarks, Theater venues, Cultural events |
| Athens Airport Proximity | Strategically located near the airport, this area is ideal for short-term visitors or travelers in transit. Quick access to flights while offering basic amenities. | Athens International Airport, Motels and guesthouses, Local shops, Quick dining options, Transportation links |
| Parks and Recreation Area | A family-friendly zone filled with parks and recreational facilities. Perfect for tourists seeking outdoor activities and active lifestyles during their stay. | Public parks, Play areas, Outdoor sports facilities, Walking paths, Community events |
Understanding Airbnb License Requirements & STR Laws in Paiania Municipal Unit (2026)
Yes, Paiania Municipal Unit, Attica, Greece enforces high STR regulations. Obtaining a license and ensuring compliance is almost certainly required according to current 2026 STR laws. Always verify the latest short term rental regulations and Airbnb license requirements directly with local government authorities for Paiania Municipal Unit to ensure full compliance before hosting.
(Source: AirROI data, 2026, based on 100% licensed listings)
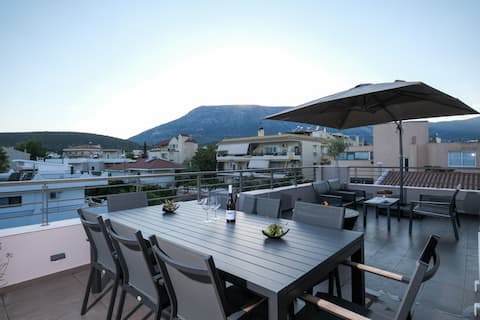
Top Performing Airbnb Properties in Paiania Municipal Unit (2026)
Benchmark your potential! Explore examples of top-performing Airbnb properties in Paiania Municipal Unitbased on Trailing Twelve Month (TTM) revenue. Analyze their characteristics, revenue, occupancy rate, and ADR to understand what drives success in this market.
Villa Zen Kyriakos Magnificent Vibes
Entire Place • 6 bedrooms

Relaxing house 10'~Airport 15'~Port 35'~Acropolis
Entire Place • 6 bedrooms

Your Home2b (near Athens airport)
Entire Place • 4 bedrooms

Nansy house
Entire Place • 2 bedrooms
Spacious & Minimal Apartment Near Airport Peania
Entire Place • 1 bedroom

Apartment in Peania (15 mins from Athens Airport)
Entire Place • 2 bedrooms
Note: Performance varies based on location, size, amenities, seasonality, and management quality. Data reflects the past 12 months.
Top Performing Airbnb Hosts in Paiania Municipal Unit (2026)
Learn from the best! This table showcases top-performing Airbnb hosts in Paiania Municipal Unit based on the number of properties managed and estimated total revenue over the past year. Analyze their scale and performance metrics.
| Host Name | Properties | Grossing Revenue | Stay Reviews | Avg Rating |
|---|---|---|---|---|
| Kyriakos | 1 | $126,564 | 38 | 4.92/5.0 |
| Σωτήρης | 6 | $48,312 | 364 | 4.73/5.0 |
| Maria & Manolis | 3 | $43,581 | 819 | 4.83/5.0 |
| Konstantinos | 2 | $34,745 | 51 | 4.99/5.0 |
| Tatiana | 2 | $22,700 | 501 | 4.82/5.0 |
| Panagiotis | 2 | $22,166 | 157 | 5.00/5.0 |
| John | 1 | $21,363 | 85 | 4.96/5.0 |
| St Thomas Bed And Breakfast | 4 | $21,212 | 64 | 4.80/5.0 |
| Αθανασια | 1 | $19,104 | 324 | 4.98/5.0 |
| Ειρήνη | 1 | $17,861 | 360 | 4.95/5.0 |
Analyzing the strategies of top hosts, such as their property selection, pricing, and guest communication, can offer valuable lessons for optimizing your own Airbnb operations in Paiania Municipal Unit.
Dive Deeper: Advanced Paiania Municipal Unit STR Market Data (2026)
Ready to unlock more insights? AirROI provides access to advanced metrics and comprehensive Airbnb data for Paiania Municipal Unit. Explore detailed analytics beyond this report to refine your investment strategy, optimize pricing, and maximize your vacation rental profits.
Explore Advanced MetricsPaiania Municipal Unit Short-Term Rental Market Composition (2026): Property & Room Types
Room Type Distribution
Property Type Distribution
Market Composition Insights for Paiania Municipal Unit
- The Paiania Municipal Unit Airbnb market composition is heavily skewed towards Entire Home/Apt listings, which make up 87.1% of the 31 active rentals. This indicates strong guest preference for privacy and space.
- Looking at the property type distribution in Paiania Municipal Unit, House properties are the most common (51.6%), reflecting the local real estate landscape.
- Houses represent a significant 51.6% portion, catering likely to families or larger groups.
- The presence of 12.9% Hotel/Boutique listings indicates integration with traditional hospitality.
- Smaller segments like others (combined 3.2%) offer potential for unique stay experiences.
Paiania Municipal Unit Airbnb Room Capacity Analysis (2026): Bedroom Distribution
Distribution of Listings by Number of Bedrooms
Room Capacity Insights for Paiania Municipal Unit
- The dominant room capacity in Paiania Municipal Unit is 1 bedroom listings, making up 48.4% of the market. This suggests a strong demand for properties suitable for couples or solo travelers.
- Together, 1 bedroom and 2 bedrooms properties represent 71.0% of the active Airbnb listings in Paiania Municipal Unit, indicating a high concentration in these sizes.
Paiania Municipal Unit Vacation Rental Guest Capacity Trends (2026)
Distribution of Listings by Guest Capacity
Guest Capacity Insights for Paiania Municipal Unit
- The most common guest capacity trend in Paiania Municipal Unit vacation rentals is listings accommodating 2 guests (25.8%). This suggests the primary traveler segment is likely couples or solo travelers.
- Properties designed for 2 guests and 3 guests dominate the Paiania Municipal Unit STR market, accounting for 45.2% of listings.
- 22.6% of properties accommodate 6+ guests, serving the market segment for larger families or group travel in Paiania Municipal Unit.
- On average, properties in Paiania Municipal Unit are equipped to host 3.5 guests.
Paiania Municipal Unit Airbnb Booking Patterns (2026): Available vs. Booked Days
Available Days Distribution
Booked Days Distribution
Booking Pattern Insights for Paiania Municipal Unit
- The most common availability pattern in Paiania Municipal Unit falls within the 271-366 days range, representing 41.9% of listings. This suggests many properties have significant open periods on their calendars.
- Approximately 70.9% of listings show high availability (181+ days open annually), indicating potential for increased bookings or specific owner usage patterns.
- For booked days, the 91-180 days range is most frequent in Paiania Municipal Unit (35.5%), reflecting common guest stay durations or potential owner blocking patterns.
- A notable 32.3% of properties secure long booking periods (181+ days booked per year), highlighting successful long-term rental strategies or significant owner usage.
Paiania Municipal Unit Airbnb Minimum Stay Requirements Analysis
Distribution of Listings by Minimum Night Requirement
1 Night
20 listings
64.5% of total
2 Nights
5 listings
16.1% of total
3 Nights
1 listings
3.2% of total
30+ Nights
5 listings
16.1% of total
Key Insights
- The most prevalent minimum stay requirement in Paiania Municipal Unit is 1 Night, adopted by 64.5% of listings. This highlights the market's preference for shorter, flexible bookings.
- A strong majority (80.6%) of the Paiania Municipal Unit Airbnb data shows acceptance of very short stays (1-2 nights), indicating a dynamic, high-turnover market.
- A significant segment (16.1%) caters to monthly stays (30+ nights) in Paiania Municipal Unit, pointing to opportunities in the extended-stay market.
Recommendations
- Align with the market by considering a 1 Night minimum stay, as 64.5% of Paiania Municipal Unit hosts use this setting.
- Explore offering discounts for stays of 30+ nights to attract the 16.1% of the market seeking extended stays.
- Adjust minimum nights based on seasonality – potentially shorter during low season and longer during peak demand periods in Paiania Municipal Unit.
Paiania Municipal Unit Airbnb Cancellation Policy Trends Analysis (2026)
Flexible
7 listings
22.6% of total
Moderate
10 listings
32.3% of total
Firm
5 listings
16.1% of total
Strict
9 listings
29% of total
Cancellation Policy Insights for Paiania Municipal Unit
- The prevailing Airbnb cancellation policy trend in Paiania Municipal Unit is Moderate, used by 32.3% of listings.
- There's a relatively balanced mix between guest-friendly (54.9%) and stricter (45.1%) policies, offering choices for different guest needs.
Recommendations for Hosts
- Consider adopting a Moderate policy to align with the 32.3% market standard in Paiania Municipal Unit.
- Regularly review your cancellation policy against competitors and market demand shifts in Paiania Municipal Unit.
Paiania Municipal Unit STR Booking Lead Time Analysis (2026)
Average Booking Lead Time by Month
Booking Lead Time Insights for Paiania Municipal Unit
- The overall average booking lead time for vacation rentals in Paiania Municipal Unit is 54 days.
- Guests book furthest in advance for stays during September (average 73 days), likely coinciding with peak travel demand or local events.
- The shortest booking windows occur for stays in February (average 21 days), indicating more last-minute travel plans during this time.
- Seasonally, Summer (61 days avg.) sees the longest lead times, while Winter (34 days avg.) has the shortest, reflecting typical travel planning cycles.
Recommendations for Hosts
- Use the overall average lead time (54 days) as a baseline for your pricing and availability strategy in Paiania Municipal Unit.
- For September stays, consider implementing length-of-stay discounts or slightly higher rates for bookings made less than 73 days out to capitalize on advance planning.
- Target marketing efforts for the Summer season well in advance (at least 61 days) to capture early planners.
- Monitor your own booking lead times against these Paiania Municipal Unit averages to identify opportunities for dynamic pricing adjustments.
Popular & Essential Airbnb Amenities in Paiania Municipal Unit (2026)
Amenity Prevalence
Amenity Insights for Paiania Municipal Unit
- Essential amenities in Paiania Municipal Unit that guests expect include: TV, Air conditioning, Wifi. Lacking these (any) could significantly impact bookings.
- Popular amenities like Hot water, Refrigerator, Shampoo are common but not universal. Offering these can provide a competitive edge.
Recommendations for Hosts
- Ensure your listing includes all essential amenities for Paiania Municipal Unit: TV, Air conditioning, Wifi.
- Consider adding popular differentiators like Hot water or Refrigerator to increase appeal.
- Highlight unique or less common amenities you offer (e.g., hot tub, dedicated workspace, EV charger) in your listing description and photos.
- Regularly check competitor amenities in Paiania Municipal Unit to stay competitive.
Paiania Municipal Unit Airbnb Guest Demographics & Profile Analysis (2026)
Guest Profile Summary for Paiania Municipal Unit
- The typical guest profile for Airbnb in Paiania Municipal Unit consists of predominantly international visitors (88%), with top international origins including Greece, typically belonging to the Post-2000s (Gen Z/Alpha) group (50%), primarily speaking English or Greek.
- Domestic travelers account for 12.4% of guests.
- Key international markets include United States (37.3%) and Greece (12.4%).
- Top languages spoken are English (50%) followed by Greek (9%).
- A significant demographic segment is the Post-2000s (Gen Z/Alpha) group, representing 50% of guests.
Recommendations for Hosts
- Focus marketing internationally, particularly towards travelers from Greece.
- Tailor amenities and listing descriptions to appeal to the dominant Post-2000s (Gen Z/Alpha) demographic (e.g., highlight fast WiFi, smart home features, local guides).
- Highlight unique local experiences or amenities relevant to the primary guest profile.
- Consider seasonal promotions aligned with peak travel times for key origin markets.
Nearby Short-Term Rental Market Comparison
How does the Paiania Municipal Unit Airbnb market stack up against its neighbors? Compare key performance metrics like average monthly revenue, ADR, and occupancy rates in surrounding areas to understand the broader regional STR landscape.
| Market | Active Properties | Monthly Revenue | Daily Rate | Avg. Occupancy |
|---|---|---|---|---|
| Plaka | 181 | $3,420 | $285.40 | 59% |
| Pollonia | 128 | $3,247 | $316.99 | 55% |
| Πλατύς Γιαλός | 10 | $2,927 | $373.22 | 41% |
| Hydra | 330 | $2,844 | $282.51 | 50% |
| Pera Triovassalos | 61 | $2,606 | $239.07 | 57% |
| Panormos | 181 | $2,580 | $257.56 | 46% |
| Tripiti | 82 | $2,484 | $252.19 | 54% |
| Municipality of Milos | 113 | $2,422 | $221.00 | 55% |
| Plaka | 26 | $2,263 | $362.94 | 48% |
| Vouliagmeni Municipal Unit | 183 | $2,263 | $238.50 | 44% |