Ntomata Airbnb Market Analysis 2026: Short Term Rental Data & Vacation Rental Statistics in Peloponnese, Western Greece and the Ionian, Greece
Is Airbnb profitable in Ntomata in 2026? Explore comprehensive Airbnb analytics for Ntomata, Peloponnese, Western Greece and the Ionian, Greece to uncover income potential. This 2026 STR market report for Ntomata, based on AirROI data from February 2025 to January 2026, reveals key trends in the niche market of 22 active listings.
Whether you're considering an Airbnb investment in Ntomata, optimizing your existing vacation rental, or exploring rental arbitrage opportunities, understanding the Ntomata Airbnb data is crucial. Navigating the high regulation landscape is key to maximizing your short term rental income potential. Let's dive into the specifics.
Key Ntomata Airbnb Performance Metrics Overview
Monthly Airbnb Revenue Variations & Income Potential in Ntomata (2026)
Understanding the monthly revenue variations for Airbnb listings in Ntomata is key to maximizing your short term rental income potential. Seasonality significantly impacts earnings. Our analysis, based on data from the past 12 months, shows that the peak revenue month for STRs in Ntomata is typically July, while February often presents the lowest earnings, highlighting opportunities for strategic pricing adjustments during shoulder and low seasons. Explore the typical Airbnb income in Ntomata across different performance tiers:
- Best-in-class properties (Top 10%) achieve $7,269+ monthly, often utilizing dynamic pricing and superior guest experiences.
- Strong performing properties (Top 25%) earn $5,340 or more, indicating effective management and desirable locations/amenities.
- Typical properties (Median) generate around $3,074 per month, representing the average market performance.
- Entry-level properties (Bottom 25%) see earnings around $1,871, often with potential for optimization.
Average Monthly Airbnb Earnings Trend in Ntomata
Ntomata Airbnb Occupancy Rate Trends (2026)
Maximize your bookings by understanding the Ntomata STR occupancy trends. Seasonal demand shifts significantly influence how often properties are booked. Typically, Julysees the highest demand (peak season occupancy), while February experiences the lowest (low season). Effective strategies, like adjusting minimum stays or offering promotions, can boost occupancy during slower periods. Here's how different property tiers perform in Ntomata:
- Best-in-class properties (Top 10%) achieve 76%+ occupancy, indicating high desirability and potentially optimized availability.
- Strong performing properties (Top 25%) maintain 64% or higher occupancy, suggesting good market fit and guest satisfaction.
- Typical properties (Median) have an occupancy rate around 39%.
- Entry-level properties (Bottom 25%) average 24% occupancy, potentially facing higher vacancy.
Average Monthly Occupancy Rate Trend in Ntomata
Average Daily Rate (ADR) Airbnb Trends in Ntomata (2026)
Effective short term rental pricing strategy in Ntomata involves understanding monthly ADR fluctuations. The Average Daily Rate (ADR) for Airbnb in Ntomata typically peaks in August and dips lowest during October. Leveraging Airbnb dynamic pricing tools or strategies based on this seasonality can significantly boost revenue. Here's a look at the typical nightly rates achieved:
- Best-in-class properties (Top 10%) command rates of $554+ per night, often due to premium features or locations.
- Strong performing properties (Top 25%) achieve nightly rates of $344 or more.
- Typical properties (Median) charge around $232 per night.
- Entry-level properties (Bottom 25%) earn around $116 per night.
Average Daily Rate (ADR) Trend by Month in Ntomata
Get Live Ntomata Market Intelligence 👇
Explore Real-time Analytics
Airbnb Seasonality Analysis & Trends in Ntomata (2026)
Peak Season (July, August, September)
- Revenue averages $5,960 per month
- Occupancy rates average 61.4%
- Daily rates average $333
Shoulder Season
- Revenue averages $2,996 per month
- Occupancy maintains around 42.5%
- Daily rates hold near $270
Low Season (January, February, December)
- Revenue drops to average $397 per month
- Occupancy decreases to average 7.1%
- Daily rates adjust to average $268
Seasonality Insights for Ntomata
- The Airbnb seasonality in Ntomata shows highly seasonal trends requiring careful strategy. While the sections above show seasonal averages, it's also insightful to look at the extremes:
- During the high season, the absolute peak month showcases Ntomata's highest earning potential, with monthly revenues capable of climbing to $7,212, occupancy reaching a high of 70.3%, and ADRs peaking at $361.
- Conversely, the slowest single month of the year, typically falling within the low season, marks the market's lowest point. In this month, revenue might dip to $0, occupancy could drop to 0.0%, and ADRs may adjust down to $230.
- Understanding both the seasonal averages and these monthly peaks and troughs in revenue, occupancy, and ADR is crucial for maximizing your Airbnb profit potential in Ntomata.
Seasonal Strategies for Maximizing Profit
- Peak Season: Maximize revenue through premium pricing and potentially longer minimum stays. Ensure high availability.
- Low Season: Offer competitive pricing, special promotions (e.g., extended stay discounts), and flexible cancellation policies. Target off-season travelers like remote workers or budget-conscious guests.
- Shoulder Seasons: Implement dynamic pricing that balances peak and low rates. Target weekend travelers or specific events. Offer slightly more flexible terms than peak season.
- Regularly analyze your own performance against these Ntomata seasonality benchmarks and adjust your pricing and availability strategy accordingly.
Best Areas for Airbnb Investment in Ntomata (2026)
Exploring the top neighborhoods for short-term rentals in Ntomata? This section highlights key areas, outlining why they are attractive for hosts and guests, along with notable local attractions. Consider these locations based on your target guest profile and investment strategy.
| Neighborhood / Area | Why Host Here? (Target Guests & Appeal) | Key Attractions & Landmarks |
|---|---|---|
| Nafplio | Charming seaside town with rich history and stunning architecture. Popular for its picturesque old town, fortresses, and beautiful beaches, making it a top choice for tourists. | Palamidi Fortress, Bourtzi, Arvanitia Beach, Nafplio Old Town, Karathona Beach, Archaeological Museum of Nafplio |
| Kefalonia | Famous for its stunning landscapes, beautiful beaches, and vibrant local culture. A favorite among tourists looking for both relaxation and adventure. | Myrtos Beach, Melissani Cave, Assos Village, Drogarati Cave, Fiskardo, Kefalonia Wine Tour |
| Zante (Zakynthos) | Known for its dramatic coastlines and vibrant nightlife. Ideal for investors looking to tap into both relaxing family vacations and lively partying scenes. | Navagio Beach (Shipwreck Beach), Blue Caves, Laganas Beach, Keri Caves, Zakynthos Town, Turtle Island (Marathonisi) |
| Korinthia | Historical significance and close proximity to Athens. Offers a mix of culture, beaches, and activities for tourists interested in history and relaxation. | Ancient Corinth, Corinth Canal, Loutraki Beach, Acrocorinth, Heraion of Perachora |
| Tripoli | Central location in the Peloponnese, ideal for exploring the region. Less touristy yet offers historical sites and access to nature. | TEA (Theatre Odysseas), Tripoli Archaeological Museum, Mount Mainalon, Megalopolis Ancient Ruins |
| Gythio | Picturesque town known for its charming harbor and beaches. A gateway to exploring the Mani Peninsula and nearby ancient sites. | Gythio Town, Mavrovouni Beach, Diros Caves, Pavlopetri underwater city, Castle of Gythio |
| Monemvasia | Fascinating medieval town on a rock, known for its romantic setting and historical significance. A magnet for couples and history enthusiasts. | Monemvasia Castle, Church of Agia Sophia, Bourtzi, The Old Town, Plaka Beach |
| Patras | Greece's third-largest city with a vibrant cultural scene. A hub for business travelers and tourists visiting western Greece. | Patras Castle, Rio-Antirio Bridge, Saint Andrew's Cathedral, Patras Archaeological Museum, Patras Carnival |
Understanding Airbnb License Requirements & STR Laws in Ntomata (2026)
Yes, Ntomata, Peloponnese, Western Greece and the Ionian, Greece enforces high STR regulations. Obtaining a license and ensuring compliance is almost certainly required according to current 2026 STR laws. Always verify the latest short term rental regulations and Airbnb license requirements directly with local government authorities for Ntomata to ensure full compliance before hosting.
(Source: AirROI data, 2026, based on 86% licensed listings)
Top Performing Airbnb Properties in Ntomata (2026)
Benchmark your potential! Explore examples of top-performing Airbnb properties in Ntomatabased on Trailing Twelve Month (TTM) revenue. Analyze their characteristics, revenue, occupancy rate, and ADR to understand what drives success in this market.

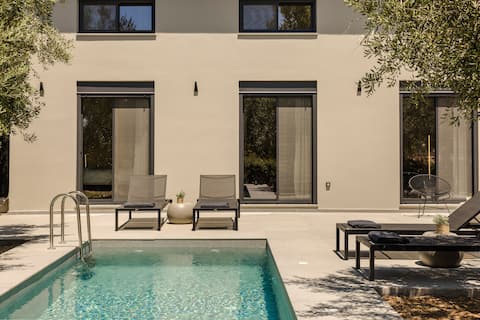
Villa Dimelisa
Entire Place • 2 bedrooms
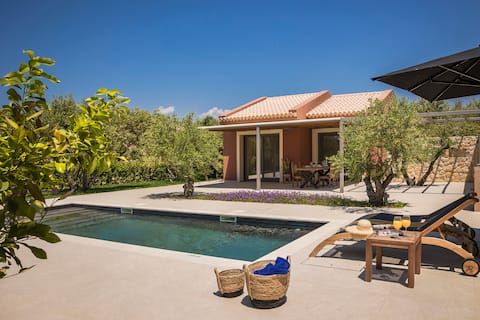
Aniso villa
Entire Place • 2 bedrooms
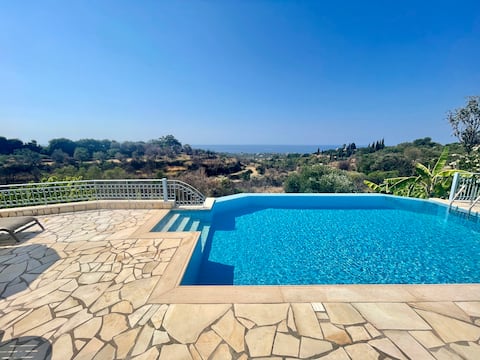
Villa Virginia
Entire Place • 1 bedroom
Lux Villa w Sea View + Heated Pool
Entire Place • 3 bedrooms
Villa Laoura
Entire Place • 1 bedroom

SeeTheSea Villa up to 8 guests
Entire Place • 3 bedrooms
Note: Performance varies based on location, size, amenities, seasonality, and management quality. Data reflects the past 12 months.
Top Performing Airbnb Hosts in Ntomata (2026)
Learn from the best! This table showcases top-performing Airbnb hosts in Ntomata based on the number of properties managed and estimated total revenue over the past year. Analyze their scale and performance metrics.
| Host Name | Properties | Grossing Revenue | Stay Reviews | Avg Rating |
|---|---|---|---|---|
| Moschato Estate | 2 | $88,106 | 45 | 5.00/5.0 |
| William | 1 | $57,823 | 24 | 5.00/5.0 |
| Grigorios | 1 | $55,061 | 10 | 5.00/5.0 |
| Connie | 2 | $53,616 | 40 | 4.96/5.0 |
| Julie | 1 | $42,624 | 55 | 5.00/5.0 |
| Konstantinos | 1 | $38,442 | 6 | 5.00/5.0 |
| V Property Solutions | 1 | $37,543 | 2 | Not Rated |
| Eva | 1 | $20,408 | 110 | 4.87/5.0 |
| Maria | 1 | $18,301 | 3 | 5.00/5.0 |
| Gerry | 1 | $14,852 | 18 | 4.83/5.0 |
Analyzing the strategies of top hosts, such as their property selection, pricing, and guest communication, can offer valuable lessons for optimizing your own Airbnb operations in Ntomata.
Dive Deeper: Advanced Ntomata STR Market Data (2026)
Ready to unlock more insights? AirROI provides access to advanced metrics and comprehensive Airbnb data for Ntomata. Explore detailed analytics beyond this report to refine your investment strategy, optimize pricing, and maximize your vacation rental profits.
Explore Advanced MetricsNtomata Short-Term Rental Market Composition (2026): Property & Room Types
Room Type Distribution
Property Type Distribution
Market Composition Insights for Ntomata
- The Ntomata Airbnb market composition is heavily skewed towards Entire Home/Apt listings, which make up 100% of the 22 active rentals. This indicates strong guest preference for privacy and space.
- Looking at the property type distribution in Ntomata, House properties are the most common (81.8%), reflecting the local real estate landscape.
- Houses represent a significant 81.8% portion, catering likely to families or larger groups.
- Smaller segments like unique stays (combined 4.5%) offer potential for unique stay experiences.
Ntomata Airbnb Room Capacity Analysis (2026): Bedroom Distribution
Distribution of Listings by Number of Bedrooms
Room Capacity Insights for Ntomata
- The dominant room capacity in Ntomata is 2 bedrooms listings, making up 40.9% of the market. This suggests a strong demand for properties suitable for couples or solo travelers.
- Together, 2 bedrooms and 1 bedroom properties represent 72.7% of the active Airbnb listings in Ntomata, indicating a high concentration in these sizes.
- A significant 27.3% of listings offer 3+ bedrooms, catering to larger groups and families seeking more space in Ntomata.
Ntomata Vacation Rental Guest Capacity Trends (2026)
Distribution of Listings by Guest Capacity
Guest Capacity Insights for Ntomata
- The most common guest capacity trend in Ntomata vacation rentals is listings accommodating 4 guests (40.9%). This suggests the primary traveler segment is likely small families or groups.
- Properties designed for 4 guests and 8+ guests dominate the Ntomata STR market, accounting for 54.5% of listings.
- 27.2% of properties accommodate 6+ guests, serving the market segment for larger families or group travel in Ntomata.
- On average, properties in Ntomata are equipped to host 4.5 guests.
Ntomata Airbnb Booking Patterns (2026): Available vs. Booked Days
Available Days Distribution
Booked Days Distribution
Booking Pattern Insights for Ntomata
- The most common availability pattern in Ntomata falls within the 271-366 days range, representing 68.2% of listings. This suggests many properties have significant open periods on their calendars.
- Approximately 90.9% of listings show high availability (181+ days open annually), indicating potential for increased bookings or specific owner usage patterns.
- For booked days, the 31-90 days range is most frequent in Ntomata (40.9%), reflecting common guest stay durations or potential owner blocking patterns.
- A notable 9.1% of properties secure long booking periods (181+ days booked per year), highlighting successful long-term rental strategies or significant owner usage.
Ntomata Airbnb Minimum Stay Requirements Analysis
Distribution of Listings by Minimum Night Requirement
2 Nights
1 listings
4.5% of total
3 Nights
5 listings
22.7% of total
4-6 Nights
5 listings
22.7% of total
30+ Nights
11 listings
50% of total
Key Insights
- The most prevalent minimum stay requirement in Ntomata is 30+ Nights, adopted by 50% of listings. This highlights the market's preference for longer commitments.
- Very short stays (1-2 nights) are less common (4.5%), suggesting hosts prefer slightly longer bookings to optimize turnover.
- A significant segment (50%) caters to monthly stays (30+ nights) in Ntomata, pointing to opportunities in the extended-stay market.
Recommendations
- Align with the market by considering a 30+ Nights minimum stay, as 50% of Ntomata hosts use this setting.
- Explore offering discounts for stays of 30+ nights to attract the 50% of the market seeking extended stays.
- Adjust minimum nights based on seasonality – potentially shorter during low season and longer during peak demand periods in Ntomata.
Ntomata Airbnb Cancellation Policy Trends Analysis (2026)
Limited
2 listings
9.1% of total
Super Strict 60 Days
1 listings
4.5% of total
Flexible
1 listings
4.5% of total
Moderate
3 listings
13.6% of total
Firm
12 listings
54.5% of total
Strict
3 listings
13.6% of total
Cancellation Policy Insights for Ntomata
- The prevailing Airbnb cancellation policy trend in Ntomata is Firm, used by 54.5% of listings.
- A majority (68.1%) of hosts in Ntomata utilize Firm or Strict policies, indicating a market where hosts prioritize booking security.
Recommendations for Hosts
- Consider adopting a Firm policy to align with the 54.5% market standard in Ntomata.
- Using a Strict policy might deter some guests, as only 13.6% of listings use it. Evaluate if potential revenue protection outweighs possible lower booking rates.
- Regularly review your cancellation policy against competitors and market demand shifts in Ntomata.
Ntomata STR Booking Lead Time Analysis (2026)
Average Booking Lead Time by Month
Booking Lead Time Insights for Ntomata
- The overall average booking lead time for vacation rentals in Ntomata is 113 days.
- Guests book furthest in advance for stays during March (average 183 days), likely coinciding with peak travel demand or local events.
- The shortest booking windows occur for stays in December (average 0 days), indicating more last-minute travel plans during this time.
- Seasonally, Spring (150 days avg.) sees the longest lead times, while Winter (30 days avg.) has the shortest, reflecting typical travel planning cycles.
Recommendations for Hosts
- Use the overall average lead time (113 days) as a baseline for your pricing and availability strategy in Ntomata.
- For March stays, consider implementing length-of-stay discounts or slightly higher rates for bookings made less than 183 days out to capitalize on advance planning.
- During December, focus on last-minute booking availability and promotions, as guests book with very short notice (0 days avg.).
- Target marketing efforts for the Spring season well in advance (at least 150 days) to capture early planners.
- Monitor your own booking lead times against these Ntomata averages to identify opportunities for dynamic pricing adjustments.
Popular & Essential Airbnb Amenities in Ntomata (2026)
Amenity Prevalence
Amenity Insights for Ntomata
- Essential amenities in Ntomata that guests expect include: TV, Wifi, Air conditioning, Kitchen. Lacking these (any) could significantly impact bookings.
- Popular amenities like Refrigerator, Oven, Free parking on premises are common but not universal. Offering these can provide a competitive edge.
Recommendations for Hosts
- Ensure your listing includes all essential amenities for Ntomata: TV, Wifi, Air conditioning, Kitchen.
- Consider adding popular differentiators like Refrigerator or Oven to increase appeal.
- Highlight unique or less common amenities you offer (e.g., hot tub, dedicated workspace, EV charger) in your listing description and photos.
- Regularly check competitor amenities in Ntomata to stay competitive.
Ntomata Airbnb Guest Demographics & Profile Analysis (2026)
Guest Profile Summary for Ntomata
- The typical guest profile for Airbnb in Ntomata consists of predominantly international visitors (100%), with top international origins including United States, typically belonging to the Post-2000s (Gen Z/Alpha) group (50%), primarily speaking English or German.
- Domestic travelers account for 0.0% of guests.
- Key international markets include United Kingdom (52.4%) and United States (11.1%).
- Top languages spoken are English (49%) followed by German (14.3%).
- A significant demographic segment is the Post-2000s (Gen Z/Alpha) group, representing 50% of guests.
Recommendations for Hosts
- Focus marketing internationally, particularly towards travelers from United States.
- Tailor amenities and listing descriptions to appeal to the dominant Post-2000s (Gen Z/Alpha) demographic (e.g., highlight fast WiFi, smart home features, local guides).
- Highlight unique local experiences or amenities relevant to the primary guest profile.
- Consider seasonal promotions aligned with peak travel times for key origin markets.
Nearby Short-Term Rental Market Comparison
How does the Ntomata Airbnb market stack up against its neighbors? Compare key performance metrics like average monthly revenue, ADR, and occupancy rates in surrounding areas to understand the broader regional STR landscape.
| Market | Active Properties | Monthly Revenue | Daily Rate | Avg. Occupancy |
|---|---|---|---|---|
| Kalipado | 17 | $2,929 | $395.13 | 45% |
| Varvara | 96 | $2,912 | $381.58 | 47% |
| Kassopaia Municipal Unit | 527 | $2,795 | $277.75 | 52% |
| Παντοκράτορας | 16 | $2,786 | $348.74 | 41% |
| Lithakia | 47 | $2,545 | $368.38 | 44% |
| Tragaki | 23 | $2,543 | $283.72 | 52% |
| Erisos Municipal Unit | 268 | $2,408 | $288.68 | 47% |
| Kipseli | 21 | $2,389 | $225.31 | 48% |
| Argostoli Municipality | 36 | $2,309 | $396.50 | 43% |
| Spartilas | 32 | $2,300 | $263.25 | 50% |