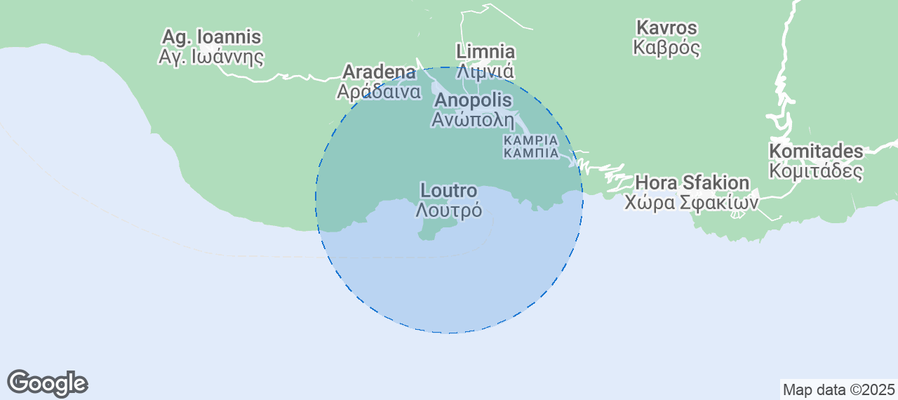
Loutro Airbnb Market Analysis 2026: Short Term Rental Data & Vacation Rental Statistics in Region of Crete, Greece
Is Airbnb profitable in Loutro in 2026? Explore comprehensive Airbnb analytics for Loutro, Region of Crete, Greece to uncover income potential. This 2026 STR market report for Loutro, based on AirROI data from February 2025 to January 2026, reveals key trends in the niche market of 28 active listings.
Whether you're considering an Airbnb investment in Loutro, optimizing your existing vacation rental, or exploring rental arbitrage opportunities, understanding the Loutro Airbnb data is crucial. Navigating the high regulation landscape is key to maximizing your short term rental income potential. Let's dive into the specifics.
Key Loutro Airbnb Performance Metrics Overview
Monthly Airbnb Revenue Variations & Income Potential in Loutro (2026)
Understanding the monthly revenue variations for Airbnb listings in Loutro is key to maximizing your short term rental income potential. Seasonality significantly impacts earnings. Our analysis, based on data from the past 12 months, shows that the peak revenue month for STRs in Loutro is typically August, while April often presents the lowest earnings, highlighting opportunities for strategic pricing adjustments during shoulder and low seasons. Explore the typical Airbnb income in Loutro across different performance tiers:
- Best-in-class properties (Top 10%) achieve $3,188+ monthly, often utilizing dynamic pricing and superior guest experiences.
- Strong performing properties (Top 25%) earn $2,429 or more, indicating effective management and desirable locations/amenities.
- Typical properties (Median) generate around $1,634 per month, representing the average market performance.
- Entry-level properties (Bottom 25%) see earnings around $1,126, often with potential for optimization.
Average Monthly Airbnb Earnings Trend in Loutro
Loutro Airbnb Occupancy Rate Trends (2026)
Maximize your bookings by understanding the Loutro STR occupancy trends. Seasonal demand shifts significantly influence how often properties are booked. Typically, Marchsees the highest demand (peak season occupancy), while October experiences the lowest (low season). Effective strategies, like adjusting minimum stays or offering promotions, can boost occupancy during slower periods. Here's how different property tiers perform in Loutro:
- Best-in-class properties (Top 10%) achieve 79%+ occupancy, indicating high desirability and potentially optimized availability.
- Strong performing properties (Top 25%) maintain 68% or higher occupancy, suggesting good market fit and guest satisfaction.
- Typical properties (Median) have an occupancy rate around 40%.
- Entry-level properties (Bottom 25%) average 26% occupancy, potentially facing higher vacancy.
Average Monthly Occupancy Rate Trend in Loutro
Average Daily Rate (ADR) Airbnb Trends in Loutro (2026)
Effective short term rental pricing strategy in Loutro involves understanding monthly ADR fluctuations. The Average Daily Rate (ADR) for Airbnb in Loutro typically peaks in October and dips lowest during April. Leveraging Airbnb dynamic pricing tools or strategies based on this seasonality can significantly boost revenue. Here's a look at the typical nightly rates achieved:
- Best-in-class properties (Top 10%) command rates of $176+ per night, often due to premium features or locations.
- Strong performing properties (Top 25%) achieve nightly rates of $157 or more.
- Typical properties (Median) charge around $142 per night.
- Entry-level properties (Bottom 25%) earn around $130 per night.
Average Daily Rate (ADR) Trend by Month in Loutro
Get Live Loutro Market Intelligence 👇
Explore Real-time Analytics
Airbnb Seasonality Analysis & Trends in Loutro (2026)
Peak Season (August, November, July)
- Revenue averages $2,708 per month
- Occupancy rates average 54.9%
- Daily rates average $139
Shoulder Season
- Revenue averages $1,545 per month
- Occupancy maintains around 45.3%
- Daily rates hold near $137
Low Season (February, April, December)
- Revenue drops to average $280 per month
- Occupancy decreases to average 11.1%
- Daily rates adjust to average $132
Seasonality Insights for Loutro
- The Airbnb seasonality in Loutro shows highly seasonal trends requiring careful strategy. While the sections above show seasonal averages, it's also insightful to look at the extremes:
- During the high season, the absolute peak month showcases Loutro's highest earning potential, with monthly revenues capable of climbing to $3,212, occupancy reaching a high of 77.4%, and ADRs peaking at $148.
- Conversely, the slowest single month of the year, typically falling within the low season, marks the market's lowest point. In this month, revenue might dip to $0, occupancy could drop to 0.0%, and ADRs may adjust down to $127.
- Understanding both the seasonal averages and these monthly peaks and troughs in revenue, occupancy, and ADR is crucial for maximizing your Airbnb profit potential in Loutro.
Seasonal Strategies for Maximizing Profit
- Peak Season: Maximize revenue through premium pricing and potentially longer minimum stays. Ensure high availability.
- Low Season: Offer competitive pricing, special promotions (e.g., extended stay discounts), and flexible cancellation policies. Target off-season travelers like remote workers or budget-conscious guests.
- Shoulder Seasons: Implement dynamic pricing that balances peak and low rates. Target weekend travelers or specific events. Offer slightly more flexible terms than peak season.
- Regularly analyze your own performance against these Loutro seasonality benchmarks and adjust your pricing and availability strategy accordingly.
Best Areas for Airbnb Investment in Loutro (2026)
Exploring the top neighborhoods for short-term rentals in Loutro? This section highlights key areas, outlining why they are attractive for hosts and guests, along with notable local attractions. Consider these locations based on your target guest profile and investment strategy.
| Neighborhood / Area | Why Host Here? (Target Guests & Appeal) | Key Attractions & Landmarks |
|---|---|---|
| Loutro Harbor | Picturesque harbor village accessible by boat or hike, popular for its calm waters and stunning sea views. A favorite spot for tourists seeking relaxation and natural beauty. | Loutro Beach, Sweet Water Beach, The ruins of Ancient Loutro, Hiking trails to Sfakia, Local taverns and restaurants |
| Agia Roumeli | Secluded village at the end of the Samaria Gorge, known for its beautiful beaches and hiking opportunities. Attracts adventure tourists and nature lovers. | Samaria Gorge National Park, Agia Roumeli Beach, Tavernas with fresh seafood, Hiking paths to nearby villages, Boat trips along the coast |
| Sfakia | Traditional village offering stunning views and access to remote beaches. Perfect for those wanting to experience authentic Cretan culture and natural wonders. | Frangokastello Castle, Plakias Beach, Agios Pavlos Beach, Hiking opportunities in the White Mountains, Local cultural events |
| Chora Sfakion | Bustling port town known for its vibrant atmosphere and proximity to hiking trails. A key departure point for adventures into the surrounding wilderness. | Sfakia Beach, Palace of the Ancient Sfakia, Nearby hiking trails, Local seafood restaurants, Scenic boat rides |
| Fragokastello | Known for its stunning beach and historical Venetian castle, attracting visitors keen on history and relaxation. | Fragokastello Beach, The Venetian castle, Local historical sites, Kalamitsi Beach, Café with sea views |
| Kreon | A serene spot with incredible cliffs and tranquil beaches, popular for those seeking peace in nature away from the crowds. | Kreon Beach, Surrounding cliffs and landscapes, Local hiking trails, Quiet taverns, Bird watching |
| Plakias | A popular tourist destination known for its beautiful sandy beaches and outdoor activities. Ideal for families and adventure seekers. | Plakias Beach, Diving opportunities, Local markets, Hiking in the surrounding mountains, Beachfront restaurants |
| Marble Beach (Marmara) | Renowned for its unique marble stones and clear waters. It attracts tourists looking for stunning landscapes and a unique beach experience. | Marmara Beach, Secluded coves, Scenic boat trips, Photography opportunities, Local nature hikes |
Understanding Airbnb License Requirements & STR Laws in Loutro (2026)
Yes, Loutro, Region of Crete, Greece enforces high STR regulations. Obtaining a license and ensuring compliance is almost certainly required according to current 2026 STR laws. Always verify the latest short term rental regulations and Airbnb license requirements directly with local government authorities for Loutro to ensure full compliance before hosting.
(Source: AirROI data, 2026, based on 89% licensed listings)
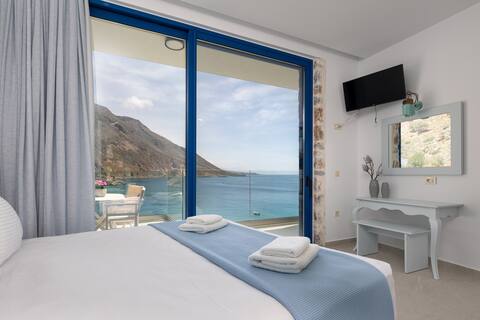
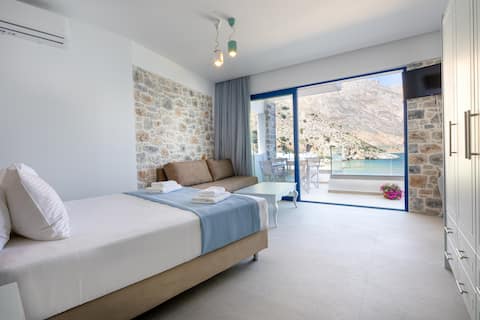
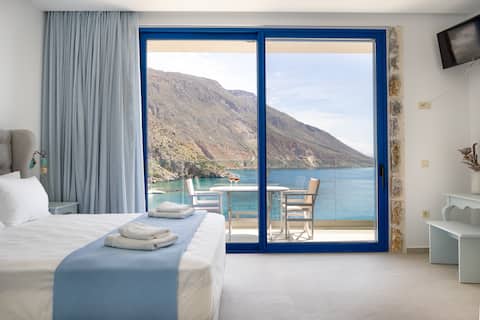
Top Performing Airbnb Properties in Loutro (2026)
Benchmark your potential! Explore examples of top-performing Airbnb properties in Loutrobased on Trailing Twelve Month (TTM) revenue. Analyze their characteristics, revenue, occupancy rate, and ADR to understand what drives success in this market.

Harito Loutro
Entire Place • 1 bedroom
Molos Apartments - Maistrali
Entire Place • 1 bedroom
Molos Apartments - Okeanos
Entire Place • 1 bedroom
Molos Apartments - Margaritari
Entire Place • 1 bedroom
John Akroyiali Room 2
Entire Place • 1 bedroom

Molos Apartments - Thalassa
Private Room • N/A
Note: Performance varies based on location, size, amenities, seasonality, and management quality. Data reflects the past 12 months.
Top Performing Airbnb Hosts in Loutro (2026)
Learn from the best! This table showcases top-performing Airbnb hosts in Loutro based on the number of properties managed and estimated total revenue over the past year. Analyze their scale and performance metrics.
| Host Name | Properties | Grossing Revenue | Stay Reviews | Avg Rating |
|---|---|---|---|---|
| Μανουσος | 19 | $151,660 | 168 | 4.72/5.0 |
| Alma | 2 | $31,578 | 93 | 4.67/5.0 |
| Katherine | 1 | $25,747 | 14 | 5.00/5.0 |
| Pavlos | 3 | $19,415 | 17 | 4.93/5.0 |
| Georgoshouse | 3 | $18,864 | 44 | 4.87/5.0 |
Analyzing the strategies of top hosts, such as their property selection, pricing, and guest communication, can offer valuable lessons for optimizing your own Airbnb operations in Loutro.
Dive Deeper: Advanced Loutro STR Market Data (2026)
Ready to unlock more insights? AirROI provides access to advanced metrics and comprehensive Airbnb data for Loutro. Explore detailed analytics beyond this report to refine your investment strategy, optimize pricing, and maximize your vacation rental profits.
Explore Advanced MetricsLoutro Short-Term Rental Market Composition (2026): Property & Room Types
Room Type Distribution
Property Type Distribution
Market Composition Insights for Loutro
- The Loutro Airbnb market composition is heavily skewed towards Private Room listings, which make up 60.7% of the 28 active rentals. This indicates strong guest preference for privacy and space.
- Looking at the property type distribution in Loutro, Apartment/Condo properties are the most common (82.1%), reflecting the local real estate landscape.
- The presence of 14.3% Hotel/Boutique listings indicates integration with traditional hospitality.
- Smaller segments like house (combined 3.6%) offer potential for unique stay experiences.
Loutro Airbnb Room Capacity Analysis (2026): Bedroom Distribution
Distribution of Listings by Number of Bedrooms
Room Capacity Insights for Loutro
- The dominant room capacity in Loutro is 1 bedroom listings, making up 64.3% of the market. This suggests a strong demand for properties suitable for couples or solo travelers.
- Together, 1 bedroom and 2 bedrooms properties represent 71.4% of the active Airbnb listings in Loutro, indicating a high concentration in these sizes.
- With over half the market (64.3%) consisting of studios or 1-bedroom units, Loutro is particularly well-suited for individuals or couples.
Loutro Vacation Rental Guest Capacity Trends (2026)
Distribution of Listings by Guest Capacity
Guest Capacity Insights for Loutro
- The most common guest capacity trend in Loutro vacation rentals is listings accommodating 4 guests (28.6%). This suggests the primary traveler segment is likely small families or groups.
- Properties designed for 4 guests and 2 guests dominate the Loutro STR market, accounting for 46.5% of listings.
- Listings for large groups (6+ guests) are relatively rare (3.6%), potentially indicating an opportunity for hosts targeting this segment in Loutro.
- On average, properties in Loutro are equipped to host 2.3 guests.
Loutro Airbnb Booking Patterns (2026): Available vs. Booked Days
Available Days Distribution
Booked Days Distribution
Booking Pattern Insights for Loutro
- The most common availability pattern in Loutro falls within the 271-366 days range, representing 67.9% of listings. This suggests many properties have significant open periods on their calendars.
- Approximately 89.3% of listings show high availability (181+ days open annually), indicating potential for increased bookings or specific owner usage patterns.
- For booked days, the 1-30 days range is most frequent in Loutro (42.9%), reflecting common guest stay durations or potential owner blocking patterns.
- A notable 10.7% of properties secure long booking periods (181+ days booked per year), highlighting successful long-term rental strategies or significant owner usage.
Loutro Airbnb Minimum Stay Requirements Analysis
Distribution of Listings by Minimum Night Requirement
1 Night
2 listings
7.1% of total
2 Nights
1 listings
3.6% of total
30+ Nights
25 listings
89.3% of total
Key Insights
- The most prevalent minimum stay requirement in Loutro is 30+ Nights, adopted by 89.3% of listings. This highlights the market's preference for longer commitments.
- Very short stays (1-2 nights) are less common (10.7%), suggesting hosts prefer slightly longer bookings to optimize turnover.
- A significant segment (89.3%) caters to monthly stays (30+ nights) in Loutro, pointing to opportunities in the extended-stay market.
Recommendations
- Align with the market by considering a 30+ Nights minimum stay, as 89.3% of Loutro hosts use this setting.
- If feasible, allowing 1-night stays, especially midweek or during low season, could capture last-minute bookings, as only 7.1% currently do.
- Explore offering discounts for stays of 30+ nights to attract the 89.3% of the market seeking extended stays.
- Adjust minimum nights based on seasonality – potentially shorter during low season and longer during peak demand periods in Loutro.
Loutro Airbnb Cancellation Policy Trends Analysis (2026)
Flexible
2 listings
7.1% of total
Moderate
2 listings
7.1% of total
Firm
18 listings
64.3% of total
Strict
6 listings
21.4% of total
Cancellation Policy Insights for Loutro
- The prevailing Airbnb cancellation policy trend in Loutro is Firm, used by 64.3% of listings.
- A majority (85.7%) of hosts in Loutro utilize Firm or Strict policies, indicating a market where hosts prioritize booking security.
Recommendations for Hosts
- Consider adopting a Firm policy to align with the 64.3% market standard in Loutro.
- Regularly review your cancellation policy against competitors and market demand shifts in Loutro.
Loutro STR Booking Lead Time Analysis (2026)
Average Booking Lead Time by Month
Booking Lead Time Insights for Loutro
- The overall average booking lead time for vacation rentals in Loutro is 67 days.
- Guests book furthest in advance for stays during October (average 103 days), likely coinciding with peak travel demand or local events.
- The shortest booking windows occur for stays in December (average 0 days), indicating more last-minute travel plans during this time.
- Seasonally, Fall (63 days avg.) sees the longest lead times, while Winter (0 days avg.) has the shortest, reflecting typical travel planning cycles.
Recommendations for Hosts
- Use the overall average lead time (67 days) as a baseline for your pricing and availability strategy in Loutro.
- For October stays, consider implementing length-of-stay discounts or slightly higher rates for bookings made less than 103 days out to capitalize on advance planning.
- During December, focus on last-minute booking availability and promotions, as guests book with very short notice (0 days avg.).
- Target marketing efforts for the Fall season well in advance (at least 63 days) to capture early planners.
- Monitor your own booking lead times against these Loutro averages to identify opportunities for dynamic pricing adjustments.
Popular & Essential Airbnb Amenities in Loutro (2026)
Amenity Prevalence
Amenity Insights for Loutro
- Essential amenities in Loutro that guests expect include: Wifi, Essentials, Air conditioning. Lacking these (any) could significantly impact bookings.
- Popular amenities like Hot water, Hangers, TV are common but not universal. Offering these can provide a competitive edge.
Recommendations for Hosts
- Ensure your listing includes all essential amenities for Loutro: Wifi, Essentials, Air conditioning.
- Prioritize adding missing essentials: Air conditioning.
- Consider adding popular differentiators like Hot water or Hangers to increase appeal.
- Highlight unique or less common amenities you offer (e.g., hot tub, dedicated workspace, EV charger) in your listing description and photos.
- Regularly check competitor amenities in Loutro to stay competitive.
Loutro Airbnb Guest Demographics & Profile Analysis (2026)
Guest Profile Summary for Loutro
- The typical guest profile for Airbnb in Loutro consists of predominantly international visitors (97%), with top international origins including United Kingdom, typically belonging to the Post-2000s (Gen Z/Alpha) group (50%), primarily speaking English or French.
- Domestic travelers account for 2.7% of guests.
- Key international markets include United States (18.9%) and United Kingdom (18.9%).
- Top languages spoken are English (50%) followed by French (16.7%).
- A significant demographic segment is the Post-2000s (Gen Z/Alpha) group, representing 50% of guests.
Recommendations for Hosts
- Focus marketing internationally, particularly towards travelers from United Kingdom.
- Tailor amenities and listing descriptions to appeal to the dominant Post-2000s (Gen Z/Alpha) demographic (e.g., highlight fast WiFi, smart home features, local guides).
- Highlight unique local experiences or amenities relevant to the primary guest profile.
- Consider seasonal promotions aligned with peak travel times for key origin markets.
Nearby Short-Term Rental Market Comparison
How does the Loutro Airbnb market stack up against its neighbors? Compare key performance metrics like average monthly revenue, ADR, and occupancy rates in surrounding areas to understand the broader regional STR landscape.
| Market | Active Properties | Monthly Revenue | Daily Rate | Avg. Occupancy |
|---|---|---|---|---|
| Violi Charaki | 21 | $7,037 | $480.16 | 55% |
| Amnatos | 15 | $5,946 | $730.78 | 48% |
| Skaleta | 57 | $5,258 | $581.34 | 48% |
| Viranepiskopi | 11 | $4,940 | $322.10 | 65% |
| Perama | 27 | $4,927 | $392.67 | 52% |
| Pithari | 22 | $4,920 | $412.56 | 55% |
| Xiro Chorio | 20 | $4,573 | $393.88 | 51% |
| Nea Magnisia | 22 | $4,332 | $392.45 | 52% |
| Municipality of Milopotamos | 20 | $3,882 | $348.22 | 51% |
| Ia Municipal Unit | 722 | $3,844 | $396.32 | 42% |