Marmari Airbnb Market Analysis 2026: Short Term Rental Data & Vacation Rental Statistics in Thessaly and Central Greece, Greece
Is Airbnb profitable in Marmari in 2026? Explore comprehensive Airbnb analytics for Marmari, Thessaly and Central Greece, Greece to uncover income potential. This 2026 STR market report for Marmari, based on AirROI data from February 2025 to January 2026, reveals key trends in the niche market of 20 active listings.
Whether you're considering an Airbnb investment in Marmari, optimizing your existing vacation rental, or exploring rental arbitrage opportunities, understanding the Marmari Airbnb data is crucial. Navigating the high regulation landscape is key to maximizing your short term rental income potential. Let's dive into the specifics.
Key Marmari Airbnb Performance Metrics Overview
Monthly Airbnb Revenue Variations & Income Potential in Marmari (2026)
Understanding the monthly revenue variations for Airbnb listings in Marmari is key to maximizing your short term rental income potential. Seasonality significantly impacts earnings. Our analysis, based on data from the past 12 months, shows that the peak revenue month for STRs in Marmari is typically August, while January often presents the lowest earnings, highlighting opportunities for strategic pricing adjustments during shoulder and low seasons. Explore the typical Airbnb income in Marmari across different performance tiers:
- Best-in-class properties (Top 10%) achieve $2,627+ monthly, often utilizing dynamic pricing and superior guest experiences.
- Strong performing properties (Top 25%) earn $1,512 or more, indicating effective management and desirable locations/amenities.
- Typical properties (Median) generate around $988 per month, representing the average market performance.
- Entry-level properties (Bottom 25%) see earnings around $571, often with potential for optimization.
Average Monthly Airbnb Earnings Trend in Marmari
Marmari Airbnb Occupancy Rate Trends (2026)
Maximize your bookings by understanding the Marmari STR occupancy trends. Seasonal demand shifts significantly influence how often properties are booked. Typically, Decembersees the highest demand (peak season occupancy), while January experiences the lowest (low season). Effective strategies, like adjusting minimum stays or offering promotions, can boost occupancy during slower periods. Here's how different property tiers perform in Marmari:
- Best-in-class properties (Top 10%) achieve 79%+ occupancy, indicating high desirability and potentially optimized availability.
- Strong performing properties (Top 25%) maintain 62% or higher occupancy, suggesting good market fit and guest satisfaction.
- Typical properties (Median) have an occupancy rate around 41%.
- Entry-level properties (Bottom 25%) average 21% occupancy, potentially facing higher vacancy.
Average Monthly Occupancy Rate Trend in Marmari
Average Daily Rate (ADR) Airbnb Trends in Marmari (2026)
Effective short term rental pricing strategy in Marmari involves understanding monthly ADR fluctuations. The Average Daily Rate (ADR) for Airbnb in Marmari typically peaks in August and dips lowest during January. Leveraging Airbnb dynamic pricing tools or strategies based on this seasonality can significantly boost revenue. Here's a look at the typical nightly rates achieved:
- Best-in-class properties (Top 10%) command rates of $157+ per night, often due to premium features or locations.
- Strong performing properties (Top 25%) achieve nightly rates of $130 or more.
- Typical properties (Median) charge around $99 per night.
- Entry-level properties (Bottom 25%) earn around $71 per night.
Average Daily Rate (ADR) Trend by Month in Marmari
Get Live Marmari Market Intelligence 👇

Explore Real-time Analytics
Airbnb Seasonality Analysis & Trends in Marmari (2026)
Peak Season (August, July, March)
- Revenue averages $2,114 per month
- Occupancy rates average 55.8%
- Daily rates average $113
Shoulder Season
- Revenue averages $1,125 per month
- Occupancy maintains around 48.6%
- Daily rates hold near $103
Low Season (January, February, October)
- Revenue drops to average $526 per month
- Occupancy decreases to average 27.5%
- Daily rates adjust to average $98
Seasonality Insights for Marmari
- The Airbnb seasonality in Marmari shows highly seasonal trends requiring careful strategy. While the sections above show seasonal averages, it's also insightful to look at the extremes:
- During the high season, the absolute peak month showcases Marmari's highest earning potential, with monthly revenues capable of climbing to $2,690, occupancy reaching a high of 71.0%, and ADRs peaking at $122.
- Conversely, the slowest single month of the year, typically falling within the low season, marks the market's lowest point. In this month, revenue might dip to $101, occupancy could drop to 9.7%, and ADRs may adjust down to $95.
- Understanding both the seasonal averages and these monthly peaks and troughs in revenue, occupancy, and ADR is crucial for maximizing your Airbnb profit potential in Marmari.
Seasonal Strategies for Maximizing Profit
- Peak Season: Maximize revenue through premium pricing and potentially longer minimum stays. Ensure high availability.
- Low Season: Offer competitive pricing, special promotions (e.g., extended stay discounts), and flexible cancellation policies. Target off-season travelers like remote workers or budget-conscious guests.
- Shoulder Seasons: Implement dynamic pricing that balances peak and low rates. Target weekend travelers or specific events. Offer slightly more flexible terms than peak season.
- Regularly analyze your own performance against these Marmari seasonality benchmarks and adjust your pricing and availability strategy accordingly.
Best Areas for Airbnb Investment in Marmari (2026)
Exploring the top neighborhoods for short-term rentals in Marmari? This section highlights key areas, outlining why they are attractive for hosts and guests, along with notable local attractions. Consider these locations based on your target guest profile and investment strategy.
| Neighborhood / Area | Why Host Here? (Target Guests & Appeal) | Key Attractions & Landmarks |
|---|---|---|
| Marmari Beach | A scenic beach destination popular for its stunning views and crystal-clear waters, ideal for beachgoers and families. The area attracts tourists looking for a relaxing vacation by the sea. | Marmari Beach, Wildlife Refuge of Kalloni, Local tavernas, Seaside promenades, Water sports activities |
| Evia Island | Known for its beautiful landscapes and rich history, Evia offers a mix of beach tourism and cultural attractions, making it appealing for diverse visitors. | Chalkida, Amarynthos Beach, Karystos, Evia's archaeological sites, Fabulous hiking trails |
| Kymi | A picturesque town with a charming harbor and traditional architecture, Kymi is ideal for visitors interested in local culture and exploring the beautiful countryside. | Kymi Port, Traditional stone houses, Kymi's local markets, Beaches, Museums showcasing local history |
| Karystos | A beautiful coastal town known for its stunning beaches and historical sites, attracting tourists interested in both relaxation and exploration. | Karystos beach, Ancient ruins, Local wine tasting, Seaside restaurants, Hiking opportunities |
| Agnondas Beach | A peaceful beach area that attracts tourists looking for serene escapes, known for its pristine waters and beautiful surroundings. | Agnondas Beach, Local fishing villages, Scenic hiking trails, Restaurants serving fresh seafood, Water activities |
| Volos | A vibrant city with a rich history and beautiful waterfront. It offers cultural attractions and access to nearby mountain and sea activities. | Argo-Saronic Gulf view, University of Thessaly, Outdoor cafes, Volos Promenade, Nearby mountain trails |
| Lichadonisia | A hidden gem comprising small islands known for their breathtaking beauty. Perfect for travelers seeking a unique and tranquil experience. | Lichadonisia Islands, Crystal-clear waters, Secluded beaches, Snorkeling and diving spots, Natural beauty and wildlife |
| Nea Stira | A charming coastal village that attracts visitors looking for authentic Greek experiences and beautiful sea views. Offers a laid-back atmosphere. | Nea Stira beaches, Local festivals, Taverna dining, Historical landmarks, Stunning sunsets |
Understanding Airbnb License Requirements & STR Laws in Marmari (2026)
Yes, Marmari, Thessaly and Central Greece, Greece enforces high STR regulations. Obtaining a license and ensuring compliance is almost certainly required according to current 2026 STR laws. Always verify the latest short term rental regulations and Airbnb license requirements directly with local government authorities for Marmari to ensure full compliance before hosting.
(Source: AirROI data, 2026, based on 100% licensed listings)
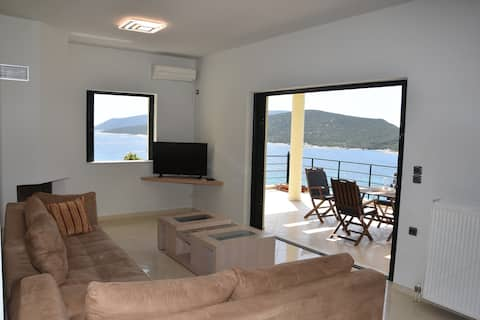
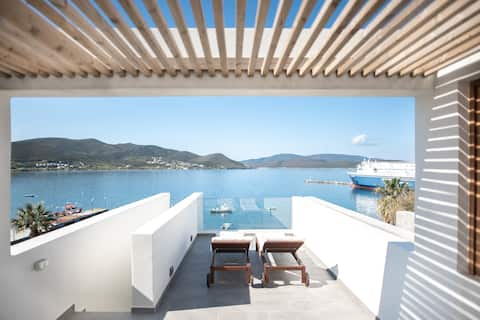
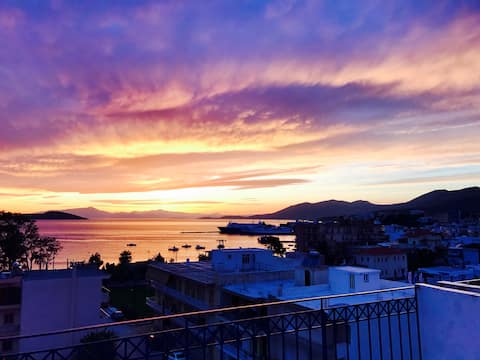
Top Performing Airbnb Properties in Marmari (2026)
Benchmark your potential! Explore examples of top-performing Airbnb properties in Marmaribased on Trailing Twelve Month (TTM) revenue. Analyze their characteristics, revenue, occupancy rate, and ADR to understand what drives success in this market.
Marmari Megali Ammos Maisonette
Entire Place • 3 bedrooms
Marmari Sea View House
Entire Place • 2 bedrooms

Manitsa Stone House Marmari Evia
Entire Place • 1 bedroom

Comfortable Sea front Apartment. Marmari - Evia
Entire Place • 1 bedroom
Sea View flat - Marmari village 1hour from Rafina
Entire Place • 2 bedrooms

Marmari vacation flat
Entire Place • 1 bedroom
Note: Performance varies based on location, size, amenities, seasonality, and management quality. Data reflects the past 12 months.
Top Performing Airbnb Hosts in Marmari (2026)
Learn from the best! This table showcases top-performing Airbnb hosts in Marmari based on the number of properties managed and estimated total revenue over the past year. Analyze their scale and performance metrics.
| Host Name | Properties | Grossing Revenue | Stay Reviews | Avg Rating |
|---|---|---|---|---|
| Αικατερίνη | 1 | $25,863 | 16 | 4.81/5.0 |
| Caroline Et Patrick | 1 | $21,296 | 5 | 5.00/5.0 |
| Eleftheria | 1 | $20,570 | 16 | 4.75/5.0 |
| Αντωνια | 1 | $13,718 | 20 | 4.80/5.0 |
| Angelika | 1 | $12,189 | 90 | 4.49/5.0 |
| Yiannis | 1 | $8,975 | 8 | 5.00/5.0 |
| Μάικ | 1 | $8,381 | 32 | 4.81/5.0 |
| Marios | 2 | $8,176 | 16 | 5.00/5.0 |
| Sofia | 1 | $7,502 | 32 | 4.97/5.0 |
| Αναστάσιος | 1 | $6,224 | 20 | 4.90/5.0 |
Analyzing the strategies of top hosts, such as their property selection, pricing, and guest communication, can offer valuable lessons for optimizing your own Airbnb operations in Marmari.
Dive Deeper: Advanced Marmari STR Market Data (2026)
Ready to unlock more insights? AirROI provides access to advanced metrics and comprehensive Airbnb data for Marmari. Explore detailed analytics beyond this report to refine your investment strategy, optimize pricing, and maximize your vacation rental profits.
Explore Advanced MetricsMarmari Short-Term Rental Market Composition (2026): Property & Room Types
Room Type Distribution
Property Type Distribution
Market Composition Insights for Marmari
- The Marmari Airbnb market composition is heavily skewed towards Entire Home/Apt listings, which make up 100% of the 20 active rentals. This indicates strong guest preference for privacy and space.
- Looking at the property type distribution in Marmari, Apartment/Condo properties are the most common (55%), reflecting the local real estate landscape.
- Houses represent a significant 45% portion, catering likely to families or larger groups.
Marmari Airbnb Room Capacity Analysis (2026): Bedroom Distribution
Distribution of Listings by Number of Bedrooms
Room Capacity Insights for Marmari
- The dominant room capacity in Marmari is 2 bedrooms listings, making up 30% of the market. This suggests a strong demand for properties suitable for couples or solo travelers.
- Together, 2 bedrooms and 1 bedroom properties represent 60.0% of the active Airbnb listings in Marmari, indicating a high concentration in these sizes.
Marmari Vacation Rental Guest Capacity Trends (2026)
Distribution of Listings by Guest Capacity
Guest Capacity Insights for Marmari
- The most common guest capacity trend in Marmari vacation rentals is listings accommodating 4 guests (35%). This suggests the primary traveler segment is likely small families or groups.
- Properties designed for 4 guests and 5 guests dominate the Marmari STR market, accounting for 55.0% of listings.
- 25.0% of properties accommodate 6+ guests, serving the market segment for larger families or group travel in Marmari.
- On average, properties in Marmari are equipped to host 4.7 guests.
Marmari Airbnb Booking Patterns (2026): Available vs. Booked Days
Available Days Distribution
Booked Days Distribution
Booking Pattern Insights for Marmari
- The most common availability pattern in Marmari falls within the 271-366 days range, representing 70% of listings. This suggests many properties have significant open periods on their calendars.
- Approximately 90.0% of listings show high availability (181+ days open annually), indicating potential for increased bookings or specific owner usage patterns.
- For booked days, the 1-30 days range is most frequent in Marmari (40%), reflecting common guest stay durations or potential owner blocking patterns.
- A notable 10.0% of properties secure long booking periods (181+ days booked per year), highlighting successful long-term rental strategies or significant owner usage.
Marmari Airbnb Minimum Stay Requirements Analysis
Distribution of Listings by Minimum Night Requirement
2 Nights
4 listings
20% of total
3 Nights
3 listings
15% of total
4-6 Nights
6 listings
30% of total
7-29 Nights
1 listings
5% of total
30+ Nights
6 listings
30% of total
Key Insights
- The most prevalent minimum stay requirement in Marmari is 4-6 Nights, adopted by 30% of listings. This highlights the market's preference for longer commitments.
- A significant segment (30%) caters to monthly stays (30+ nights) in Marmari, pointing to opportunities in the extended-stay market.
Recommendations
- Align with the market by considering a 4-6 Nights minimum stay, as 30% of Marmari hosts use this setting.
- Explore offering discounts for stays of 30+ nights to attract the 30% of the market seeking extended stays.
- Adjust minimum nights based on seasonality – potentially shorter during low season and longer during peak demand periods in Marmari.
Marmari Airbnb Cancellation Policy Trends Analysis (2026)
Limited
1 listings
5% of total
Flexible
2 listings
10% of total
Moderate
4 listings
20% of total
Firm
13 listings
65% of total
Cancellation Policy Insights for Marmari
- The prevailing Airbnb cancellation policy trend in Marmari is Firm, used by 65% of listings.
- A majority (65.0%) of hosts in Marmari utilize Firm or Strict policies, indicating a market where hosts prioritize booking security.
Recommendations for Hosts
- Consider adopting a Firm policy to align with the 65% market standard in Marmari.
- Regularly review your cancellation policy against competitors and market demand shifts in Marmari.
Marmari STR Booking Lead Time Analysis (2026)
Average Booking Lead Time by Month
Booking Lead Time Insights for Marmari
- The overall average booking lead time for vacation rentals in Marmari is 65 days.
- Guests book furthest in advance for stays during January (average 297 days), likely coinciding with peak travel demand or local events.
- The shortest booking windows occur for stays in February (average 3 days), indicating more last-minute travel plans during this time.
- Seasonally, Winter (136 days avg.) sees the longest lead times, while Summer (69 days avg.) has the shortest, reflecting typical travel planning cycles.
Recommendations for Hosts
- Use the overall average lead time (65 days) as a baseline for your pricing and availability strategy in Marmari.
- For January stays, consider implementing length-of-stay discounts or slightly higher rates for bookings made less than 297 days out to capitalize on advance planning.
- During February, focus on last-minute booking availability and promotions, as guests book with very short notice (3 days avg.).
- Target marketing efforts for the Winter season well in advance (at least 136 days) to capture early planners.
- Monitor your own booking lead times against these Marmari averages to identify opportunities for dynamic pricing adjustments.
Popular & Essential Airbnb Amenities in Marmari (2026)
Amenity Prevalence
Amenity Insights for Marmari
- Essential amenities in Marmari that guests expect include: Air conditioning, Kitchen, TV, Wifi, Hangers, Hair dryer. Lacking these (any) could significantly impact bookings.
- Popular amenities like Dishes and silverware, Hot water, Cooking basics are common but not universal. Offering these can provide a competitive edge.
Recommendations for Hosts
- Ensure your listing includes all essential amenities for Marmari: Air conditioning, Kitchen, TV, Wifi, Hangers, Hair dryer.
- Prioritize adding missing essentials: Kitchen, TV, Wifi, Hangers, Hair dryer.
- Consider adding popular differentiators like Dishes and silverware or Hot water to increase appeal.
- Highlight unique or less common amenities you offer (e.g., hot tub, dedicated workspace, EV charger) in your listing description and photos.
- Regularly check competitor amenities in Marmari to stay competitive.
Marmari Airbnb Guest Demographics & Profile Analysis (2026)
Guest Profile Summary for Marmari
- The typical guest profile for Airbnb in Marmari consists of predominantly international visitors (86%), with top international origins including Greece, typically belonging to the Post-2000s (Gen Z/Alpha) group (50%), primarily speaking English or Italian.
- Domestic travelers account for 13.8% of guests.
- Key international markets include Italy (17.2%) and Greece (13.8%).
- Top languages spoken are English (34.5%) followed by Italian (12.1%).
- A significant demographic segment is the Post-2000s (Gen Z/Alpha) group, representing 50% of guests.
Recommendations for Hosts
- Focus marketing internationally, particularly towards travelers from Greece.
- Tailor amenities and listing descriptions to appeal to the dominant Post-2000s (Gen Z/Alpha) demographic (e.g., highlight fast WiFi, smart home features, local guides).
- Highlight unique local experiences or amenities relevant to the primary guest profile.
- Consider seasonal promotions aligned with peak travel times for key origin markets.
Nearby Short-Term Rental Market Comparison
How does the Marmari Airbnb market stack up against its neighbors? Compare key performance metrics like average monthly revenue, ADR, and occupancy rates in surrounding areas to understand the broader regional STR landscape.
| Market | Active Properties | Monthly Revenue | Daily Rate | Avg. Occupancy |
|---|---|---|---|---|
| Faros Armenistis | 119 | $4,791 | $715.43 | 41% |
| Agios Ioannis Diakoftis | 159 | $3,592 | $590.02 | 39% |
| Orkos | 90 | $3,536 | $419.32 | 46% |
| Municipality of Mykonos | 330 | $3,535 | $688.35 | 35% |
| Psarou | 114 | $3,339 | $721.78 | 36% |
| Plintri | 146 | $3,195 | $575.49 | 38% |
| Platys Gialos | 221 | $3,129 | $408.65 | 46% |
| Ano Mera | 117 | $3,009 | $639.21 | 38% |
| Ornos | 266 | $2,971 | $373.81 | 44% |
| Naousa | 612 | $2,886 | $327.88 | 50% |