Municipal Unit of Mouresi Airbnb Market Analysis 2026: Short Term Rental Data & Vacation Rental Statistics in Thessaly and Central Greece, Greece
Is Airbnb profitable in Municipal Unit of Mouresi in 2026? Explore comprehensive Airbnb analytics for Municipal Unit of Mouresi, Thessaly and Central Greece, Greece to uncover income potential. This 2026 STR market report for Municipal Unit of Mouresi, based on AirROI data from February 2025 to January 2026, reveals key trends in the market of 258 active listings.
Whether you're considering an Airbnb investment in Municipal Unit of Mouresi, optimizing your existing vacation rental, or exploring rental arbitrage opportunities, understanding the Municipal Unit of Mouresi Airbnb data is crucial. Navigating the high regulation landscape is key to maximizing your short term rental income potential. Let's dive into the specifics.
Key Municipal Unit of Mouresi Airbnb Performance Metrics Overview
Monthly Airbnb Revenue Variations & Income Potential in Municipal Unit of Mouresi (2026)
Understanding the monthly revenue variations for Airbnb listings in Municipal Unit of Mouresi is key to maximizing your short term rental income potential. Seasonality significantly impacts earnings. Our analysis, based on data from the past 12 months, shows that the peak revenue month for STRs in Municipal Unit of Mouresi is typically August, while February often presents the lowest earnings, highlighting opportunities for strategic pricing adjustments during shoulder and low seasons. Explore the typical Airbnb income in Municipal Unit of Mouresi across different performance tiers:
- Best-in-class properties (Top 10%) achieve $3,211+ monthly, often utilizing dynamic pricing and superior guest experiences.
- Strong performing properties (Top 25%) earn $1,818 or more, indicating effective management and desirable locations/amenities.
- Typical properties (Median) generate around $916 per month, representing the average market performance.
- Entry-level properties (Bottom 25%) see earnings around $443, often with potential for optimization.
Average Monthly Airbnb Earnings Trend in Municipal Unit of Mouresi
Municipal Unit of Mouresi Airbnb Occupancy Rate Trends (2026)
Maximize your bookings by understanding the Municipal Unit of Mouresi STR occupancy trends. Seasonal demand shifts significantly influence how often properties are booked. Typically, Augustsees the highest demand (peak season occupancy), while February experiences the lowest (low season). Effective strategies, like adjusting minimum stays or offering promotions, can boost occupancy during slower periods. Here's how different property tiers perform in Municipal Unit of Mouresi:
- Best-in-class properties (Top 10%) achieve 58%+ occupancy, indicating high desirability and potentially optimized availability.
- Strong performing properties (Top 25%) maintain 38% or higher occupancy, suggesting good market fit and guest satisfaction.
- Typical properties (Median) have an occupancy rate around 22%.
- Entry-level properties (Bottom 25%) average 11% occupancy, potentially facing higher vacancy.
Average Monthly Occupancy Rate Trend in Municipal Unit of Mouresi
Average Daily Rate (ADR) Airbnb Trends in Municipal Unit of Mouresi (2026)
Effective short term rental pricing strategy in Municipal Unit of Mouresi involves understanding monthly ADR fluctuations. The Average Daily Rate (ADR) for Airbnb in Municipal Unit of Mouresi typically peaks in August and dips lowest during February. Leveraging Airbnb dynamic pricing tools or strategies based on this seasonality can significantly boost revenue. Here's a look at the typical nightly rates achieved:
- Best-in-class properties (Top 10%) command rates of $345+ per night, often due to premium features or locations.
- Strong performing properties (Top 25%) achieve nightly rates of $201 or more.
- Typical properties (Median) charge around $124 per night.
- Entry-level properties (Bottom 25%) earn around $90 per night.
Average Daily Rate (ADR) Trend by Month in Municipal Unit of Mouresi
Get Live Municipal Unit of Mouresi Market Intelligence 👇

Explore Real-time Analytics
Airbnb Seasonality Analysis & Trends in Municipal Unit of Mouresi (2026)
Peak Season (August, July, September)
- Revenue averages $2,222 per month
- Occupancy rates average 42.5%
- Daily rates average $178
Shoulder Season
- Revenue averages $1,243 per month
- Occupancy maintains around 22.4%
- Daily rates hold near $174
Low Season (February, April, May)
- Revenue drops to average $832 per month
- Occupancy decreases to average 19.7%
- Daily rates adjust to average $167
Seasonality Insights for Municipal Unit of Mouresi
- The Airbnb seasonality in Municipal Unit of Mouresi shows highly seasonal trends requiring careful strategy. While the sections above show seasonal averages, it's also insightful to look at the extremes:
- During the high season, the absolute peak month showcases Municipal Unit of Mouresi's highest earning potential, with monthly revenues capable of climbing to $3,026, occupancy reaching a high of 54.9%, and ADRs peaking at $182.
- Conversely, the slowest single month of the year, typically falling within the low season, marks the market's lowest point. In this month, revenue might dip to $573, occupancy could drop to 11.9%, and ADRs may adjust down to $165.
- Understanding both the seasonal averages and these monthly peaks and troughs in revenue, occupancy, and ADR is crucial for maximizing your Airbnb profit potential in Municipal Unit of Mouresi.
Seasonal Strategies for Maximizing Profit
- Peak Season: Maximize revenue through premium pricing and potentially longer minimum stays. Ensure high availability.
- Low Season: Offer competitive pricing, special promotions (e.g., extended stay discounts), and flexible cancellation policies. Target off-season travelers like remote workers or budget-conscious guests.
- Shoulder Seasons: Implement dynamic pricing that balances peak and low rates. Target weekend travelers or specific events. Offer slightly more flexible terms than peak season.
- Regularly analyze your own performance against these Municipal Unit of Mouresi seasonality benchmarks and adjust your pricing and availability strategy accordingly.
Best Areas for Airbnb Investment in Municipal Unit of Mouresi (2026)
Exploring the top neighborhoods for short-term rentals in Municipal Unit of Mouresi? This section highlights key areas, outlining why they are attractive for hosts and guests, along with notable local attractions. Consider these locations based on your target guest profile and investment strategy.
| Neighborhood / Area | Why Host Here? (Target Guests & Appeal) | Key Attractions & Landmarks |
|---|---|---|
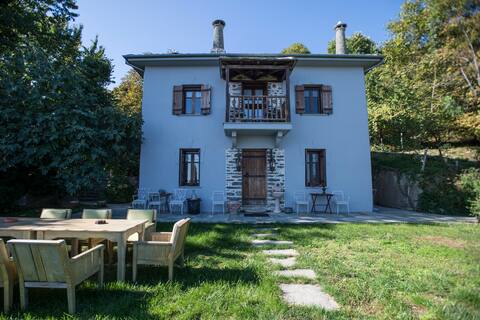
| Mouresi Village | Charming traditional village set in the lush green hills of Pelion, known for its stunning views and rich cultural heritage. Ideal for those seeking an authentic Greek experience close to nature and history. | Agioi Saranta Beach, Damouchari Beach, Pelion hiking trails, Ancient Tsagarada, Local tavernas and artisans |
| Agios Ioannis | Popular beach destination within Pelion, famous for its beautiful sandy beaches and vibrant nightlife. A hotspot for tourists in the summer, offering various water sports and beach activities. | Papa Nero Beach, Plaka Beach, Local seafood restaurants, Seafront bars, Water sports activities |
| Tsagarada | Known for its beautiful architecture and the famous 1000-year-old plane tree, Tsagarada offers stunning views and a peaceful atmosphere, ideal for visitors looking for tranquility and nature. | The Plane Tree of Tsagarada, Chapel of St. John, Local hiking trails, Traditional cafes, Cultural festivals |
| Agrielia | A lesser-known area that offers secluded beaches and a serene environment, perfect for those wanting to escape the crowds and enjoy nature away from the busier tourist spots. | Quiet beaches, Natural landscapes, Hiking opportunities, Seaside tavernas |
| Kalamaki Beach | A beautiful spot with crystal clear waters, popular with families and couples, featuring calm sea conditions and sunbeds for relaxation. | Crystal clear beaches, Family-friendly amenities, Nearby cafes, Beach bars |
| Pounta | A scenic area that boasts some of the most picturesque views of the Aegean Sea and is known for its laid-back atmosphere, making it a perfect getaway for artists and writers. | Panoramic coastal views, Artistic retreats, Secluded beaches |
| Chorto | A quaint fishing village offering a more tranquil experience, known for its tasty local cuisine and beautiful waterfront, attracting visitors seeking relaxation by the sea. | Traditional fishing port, Local fish tavernas, Calm beaches, Walking paths by the seafront |
| Damouchari | Famous for its picturesque harbor and remarkable stone architecture, Damouchari is a must-visit destination for those interested in the history and culture of Pelion. | Historical harbor, Local shops, Pelion architecture, Secluded swimming spots |
Understanding Airbnb License Requirements & STR Laws in Municipal Unit of Mouresi (2026)
Yes, Municipal Unit of Mouresi, Thessaly and Central Greece, Greece enforces high STR regulations. Obtaining a license and ensuring compliance is almost certainly required according to current 2026 STR laws. Always verify the latest short term rental regulations and Airbnb license requirements directly with local government authorities for Municipal Unit of Mouresi to ensure full compliance before hosting.
(Source: AirROI data, 2026, based on 82% licensed listings)
Top Performing Airbnb Properties in Municipal Unit of Mouresi (2026)
Benchmark your potential! Explore examples of top-performing Airbnb properties in Municipal Unit of Mouresibased on Trailing Twelve Month (TTM) revenue. Analyze their characteristics, revenue, occupancy rate, and ADR to understand what drives success in this market.
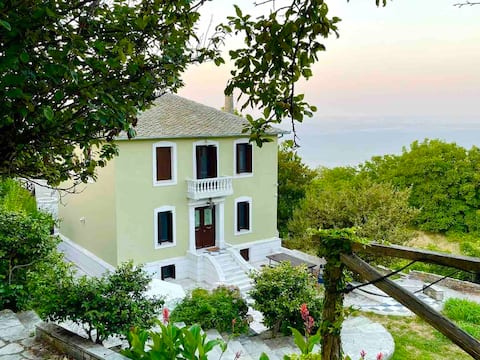
Mountainside Villa with Sea Views
Entire Place • 6 bedrooms

Kymothoe, a cottage with a yard, next to the sea.
Entire Place • 2 bedrooms

Pelionbnb.1 VILLA AZALEA | "private" beach @Pilio
Entire Place • 4 bedrooms
Eudora Mansion with sea view
Entire Place • 6 bedrooms

Pelionbnb.2 VILLA KAMELIA | "private beach @Pilio
Entire Place • 4 bedrooms

Valeria Sunrise Tsagkarada
Entire Place • 3 bedrooms
Note: Performance varies based on location, size, amenities, seasonality, and management quality. Data reflects the past 12 months.
Top Performing Airbnb Hosts in Municipal Unit of Mouresi (2026)
Learn from the best! This table showcases top-performing Airbnb hosts in Municipal Unit of Mouresi based on the number of properties managed and estimated total revenue over the past year. Analyze their scale and performance metrics.
| Host Name | Properties | Grossing Revenue | Stay Reviews | Avg Rating |
|---|---|---|---|---|
| Korina | 3 | $93,278 | 32 | 4.88/5.0 |
| Kin | 4 | $85,152 | 26 | 4.95/5.0 |
| Παύλος & Έρη | 3 | $79,592 | 63 | 4.94/5.0 |
| Xara | 3 | $58,549 | 90 | 4.85/5.0 |
| Claire And Andriana | 1 | $55,904 | 19 | 5.00/5.0 |
| Παναγιώτης | 1 | $53,183 | 21 | 4.95/5.0 |
| Stamatia | 2 | $36,080 | 96 | 4.97/5.0 |
| Kostas | 2 | $35,721 | 14 | 5.00/5.0 |
| Katerina | 3 | $33,066 | 229 | 4.95/5.0 |
| Om | 2 | $29,441 | 8 | 4.83/5.0 |
Analyzing the strategies of top hosts, such as their property selection, pricing, and guest communication, can offer valuable lessons for optimizing your own Airbnb operations in Municipal Unit of Mouresi.
Dive Deeper: Advanced Municipal Unit of Mouresi STR Market Data (2026)
Ready to unlock more insights? AirROI provides access to advanced metrics and comprehensive Airbnb data for Municipal Unit of Mouresi. Explore detailed analytics beyond this report to refine your investment strategy, optimize pricing, and maximize your vacation rental profits.
Explore Advanced MetricsMunicipal Unit of Mouresi Short-Term Rental Market Composition (2026): Property & Room Types
Room Type Distribution
Property Type Distribution
Market Composition Insights for Municipal Unit of Mouresi
- The Municipal Unit of Mouresi Airbnb market composition is heavily skewed towards Entire Home/Apt listings, which make up 87.2% of the 258 active rentals. This indicates strong guest preference for privacy and space.
- Looking at the property type distribution in Municipal Unit of Mouresi, House properties are the most common (68.6%), reflecting the local real estate landscape.
- Houses represent a significant 68.6% portion, catering likely to families or larger groups.
- The presence of 5.8% Hotel/Boutique listings indicates integration with traditional hospitality.
- Smaller segments like others (combined 1.9%) offer potential for unique stay experiences.
Municipal Unit of Mouresi Airbnb Room Capacity Analysis (2026): Bedroom Distribution
Distribution of Listings by Number of Bedrooms
Room Capacity Insights for Municipal Unit of Mouresi
- The dominant room capacity in Municipal Unit of Mouresi is 1 bedroom listings, making up 35.7% of the market. This suggests a strong demand for properties suitable for couples or solo travelers.
- Together, 1 bedroom and 2 bedrooms properties represent 67.5% of the active Airbnb listings in Municipal Unit of Mouresi, indicating a high concentration in these sizes.
- A significant 22.5% of listings offer 3+ bedrooms, catering to larger groups and families seeking more space in Municipal Unit of Mouresi.
Municipal Unit of Mouresi Vacation Rental Guest Capacity Trends (2026)
Distribution of Listings by Guest Capacity
Guest Capacity Insights for Municipal Unit of Mouresi
- The most common guest capacity trend in Municipal Unit of Mouresi vacation rentals is listings accommodating 4 guests (21.7%). This suggests the primary traveler segment is likely small families or groups.
- Properties designed for 4 guests and 2 guests dominate the Municipal Unit of Mouresi STR market, accounting for 36.4% of listings.
- 32.5% of properties accommodate 6+ guests, serving the market segment for larger families or group travel in Municipal Unit of Mouresi.
- On average, properties in Municipal Unit of Mouresi are equipped to host 4.4 guests.
Municipal Unit of Mouresi Airbnb Booking Patterns (2026): Available vs. Booked Days
Available Days Distribution
Booked Days Distribution
Booking Pattern Insights for Municipal Unit of Mouresi
- The most common availability pattern in Municipal Unit of Mouresi falls within the 271-366 days range, representing 84.5% of listings. This suggests many properties have significant open periods on their calendars.
- Approximately 98.5% of listings show high availability (181+ days open annually), indicating potential for increased bookings or specific owner usage patterns.
- For booked days, the 31-90 days range is most frequent in Municipal Unit of Mouresi (41.9%), reflecting common guest stay durations or potential owner blocking patterns.
- A notable 1.6% of properties secure long booking periods (181+ days booked per year), highlighting successful long-term rental strategies or significant owner usage.
Municipal Unit of Mouresi Airbnb Minimum Stay Requirements Analysis
Distribution of Listings by Minimum Night Requirement
1 Night
23 listings
8.9% of total
2 Nights
69 listings
26.7% of total
3 Nights
39 listings
15.1% of total
4-6 Nights
35 listings
13.6% of total
7-29 Nights
1 listings
0.4% of total
30+ Nights
91 listings
35.3% of total
Key Insights
- The most prevalent minimum stay requirement in Municipal Unit of Mouresi is 30+ Nights, adopted by 35.3% of listings. This highlights the market's preference for longer commitments.
- A significant segment (35.3%) caters to monthly stays (30+ nights) in Municipal Unit of Mouresi, pointing to opportunities in the extended-stay market.
Recommendations
- Align with the market by considering a 30+ Nights minimum stay, as 35.3% of Municipal Unit of Mouresi hosts use this setting.
- If feasible, allowing 1-night stays, especially midweek or during low season, could capture last-minute bookings, as only 8.9% currently do.
- Explore offering discounts for stays of 30+ nights to attract the 35.3% of the market seeking extended stays.
- Adjust minimum nights based on seasonality – potentially shorter during low season and longer during peak demand periods in Municipal Unit of Mouresi.
Municipal Unit of Mouresi Airbnb Cancellation Policy Trends Analysis (2026)
Limited
4 listings
1.6% of total
Super Strict 60 Days
16 listings
6.2% of total
Super Strict 30 Days
10 listings
3.9% of total
Flexible
17 listings
6.6% of total
Moderate
35 listings
13.6% of total
Firm
106 listings
41.1% of total
Strict
70 listings
27.1% of total
Cancellation Policy Insights for Municipal Unit of Mouresi
- The prevailing Airbnb cancellation policy trend in Municipal Unit of Mouresi is Firm, used by 41.1% of listings.
- A majority (68.2%) of hosts in Municipal Unit of Mouresi utilize Firm or Strict policies, indicating a market where hosts prioritize booking security.
Recommendations for Hosts
- Consider adopting a Firm policy to align with the 41.1% market standard in Municipal Unit of Mouresi.
- Regularly review your cancellation policy against competitors and market demand shifts in Municipal Unit of Mouresi.
Municipal Unit of Mouresi STR Booking Lead Time Analysis (2026)
Average Booking Lead Time by Month
Booking Lead Time Insights for Municipal Unit of Mouresi
- The overall average booking lead time for vacation rentals in Municipal Unit of Mouresi is 51 days.
- Guests book furthest in advance for stays during August (average 71 days), likely coinciding with peak travel demand or local events.
- The shortest booking windows occur for stays in February (average 20 days), indicating more last-minute travel plans during this time.
- Seasonally, Summer (54 days avg.) sees the longest lead times, while Winter (34 days avg.) has the shortest, reflecting typical travel planning cycles.
Recommendations for Hosts
- Use the overall average lead time (51 days) as a baseline for your pricing and availability strategy in Municipal Unit of Mouresi.
- For August stays, consider implementing length-of-stay discounts or slightly higher rates for bookings made less than 71 days out to capitalize on advance planning.
- Target marketing efforts for the Summer season well in advance (at least 54 days) to capture early planners.
- Monitor your own booking lead times against these Municipal Unit of Mouresi averages to identify opportunities for dynamic pricing adjustments.
Popular & Essential Airbnb Amenities in Municipal Unit of Mouresi (2026)
Amenity Prevalence
Amenity Insights for Municipal Unit of Mouresi
- Essential amenities in Municipal Unit of Mouresi that guests expect include: Wifi. Lacking these (this) could significantly impact bookings.
- Popular amenities like Essentials, Hangers, Hot water are common but not universal. Offering these can provide a competitive edge.
Recommendations for Hosts
- Ensure your listing includes all essential amenities for Municipal Unit of Mouresi: Wifi.
- Prioritize adding missing essentials: Wifi.
- Consider adding popular differentiators like Essentials or Hangers to increase appeal.
- Highlight unique or less common amenities you offer (e.g., hot tub, dedicated workspace, EV charger) in your listing description and photos.
- Regularly check competitor amenities in Municipal Unit of Mouresi to stay competitive.
Municipal Unit of Mouresi Airbnb Guest Demographics & Profile Analysis (2026)
Guest Profile Summary for Municipal Unit of Mouresi
- The typical guest profile for Airbnb in Municipal Unit of Mouresi consists of predominantly international visitors (76%), with top international origins including France, typically belonging to the Post-2000s (Gen Z/Alpha) group (50%), primarily speaking English or Greek.
- Domestic travelers account for 24.4% of guests.
- Key international markets include Greece (24.4%) and France (12%).
- Top languages spoken are English (41.2%) followed by Greek (12%).
- A significant demographic segment is the Post-2000s (Gen Z/Alpha) group, representing 50% of guests.
Recommendations for Hosts
- Focus marketing internationally, particularly towards travelers from France.
- Tailor amenities and listing descriptions to appeal to the dominant Post-2000s (Gen Z/Alpha) demographic (e.g., highlight fast WiFi, smart home features, local guides).
- Highlight unique local experiences or amenities relevant to the primary guest profile.
- Consider seasonal promotions aligned with peak travel times for key origin markets.
Nearby Short-Term Rental Market Comparison
How does the Municipal Unit of Mouresi Airbnb market stack up against its neighbors? Compare key performance metrics like average monthly revenue, ADR, and occupancy rates in surrounding areas to understand the broader regional STR landscape.
| Market | Active Properties | Monthly Revenue | Daily Rate | Avg. Occupancy |
|---|---|---|---|---|
| Skiathos Municipality | 68 | $2,488 | $456.24 | 48% |
| Achladias | 92 | $2,443 | $360.50 | 47% |
| Sporades | 22 | $2,433 | $326.24 | 53% |
| Nerotrivia | 15 | $2,060 | $209.06 | 47% |
| Klima | 20 | $2,023 | $348.92 | 40% |
| Magoula | 13 | $1,902 | $286.78 | 33% |
| Municipality of Marathonas | 79 | $1,802 | $286.80 | 31% |
| Panorama Municipal Unit | 11 | $1,735 | $285.42 | 36% |
| Kalyvia | 23 | $1,642 | $248.74 | 42% |
| Mourtero | 16 | $1,623 | $226.09 | 46% |