Myli Airbnb Market Analysis 2026: Short Term Rental Data & Vacation Rental Statistics in Thessaly and Central Greece, Greece
Is Airbnb profitable in Myli in 2026? Explore comprehensive Airbnb analytics for Myli, Thessaly and Central Greece, Greece to uncover income potential. This 2026 STR market report for Myli, based on AirROI data from February 2025 to January 2026, reveals key trends in the niche market of 52 active listings.
Whether you're considering an Airbnb investment in Myli, optimizing your existing vacation rental, or exploring rental arbitrage opportunities, understanding the Myli Airbnb data is crucial. Navigating the high regulation landscape is key to maximizing your short term rental income potential. Let's dive into the specifics.
Key Myli Airbnb Performance Metrics Overview
Monthly Airbnb Revenue Variations & Income Potential in Myli (2026)
Understanding the monthly revenue variations for Airbnb listings in Myli is key to maximizing your short term rental income potential. Seasonality significantly impacts earnings. Our analysis, based on data from the past 12 months, shows that the peak revenue month for STRs in Myli is typically November, while February often presents the lowest earnings, highlighting opportunities for strategic pricing adjustments during shoulder and low seasons. Explore the typical Airbnb income in Myli across different performance tiers:
- Best-in-class properties (Top 10%) achieve $6,644+ monthly, often utilizing dynamic pricing and superior guest experiences.
- Strong performing properties (Top 25%) earn $4,411 or more, indicating effective management and desirable locations/amenities.
- Typical properties (Median) generate around $2,584 per month, representing the average market performance.
- Entry-level properties (Bottom 25%) see earnings around $1,863, often with potential for optimization.
Average Monthly Airbnb Earnings Trend in Myli
Myli Airbnb Occupancy Rate Trends (2026)
Maximize your bookings by understanding the Myli STR occupancy trends. Seasonal demand shifts significantly influence how often properties are booked. Typically, Novembersees the highest demand (peak season occupancy), while February experiences the lowest (low season). Effective strategies, like adjusting minimum stays or offering promotions, can boost occupancy during slower periods. Here's how different property tiers perform in Myli:
- Best-in-class properties (Top 10%) achieve 61%+ occupancy, indicating high desirability and potentially optimized availability.
- Strong performing properties (Top 25%) maintain 49% or higher occupancy, suggesting good market fit and guest satisfaction.
- Typical properties (Median) have an occupancy rate around 34%.
- Entry-level properties (Bottom 25%) average 24% occupancy, potentially facing higher vacancy.
Average Monthly Occupancy Rate Trend in Myli
Average Daily Rate (ADR) Airbnb Trends in Myli (2026)
Effective short term rental pricing strategy in Myli involves understanding monthly ADR fluctuations. The Average Daily Rate (ADR) for Airbnb in Myli typically peaks in August and dips lowest during May. Leveraging Airbnb dynamic pricing tools or strategies based on this seasonality can significantly boost revenue. Here's a look at the typical nightly rates achieved:
- Best-in-class properties (Top 10%) command rates of $401+ per night, often due to premium features or locations.
- Strong performing properties (Top 25%) achieve nightly rates of $290 or more.
- Typical properties (Median) charge around $184 per night.
- Entry-level properties (Bottom 25%) earn around $109 per night.
Average Daily Rate (ADR) Trend by Month in Myli
Get Live Myli Market Intelligence 👇

Explore Real-time Analytics
Airbnb Seasonality Analysis & Trends in Myli (2026)
Peak Season (November, August, July)
- Revenue averages $8,126 per month
- Occupancy rates average 69.6%
- Daily rates average $244
Shoulder Season
- Revenue averages $2,542 per month
- Occupancy maintains around 30.8%
- Daily rates hold near $211
Low Season (January, February, October)
- Revenue drops to average $995 per month
- Occupancy decreases to average 16.8%
- Daily rates adjust to average $213
Seasonality Insights for Myli
- The Airbnb seasonality in Myli shows highly seasonal trends requiring careful strategy. While the sections above show seasonal averages, it's also insightful to look at the extremes:
- During the high season, the absolute peak month showcases Myli's highest earning potential, with monthly revenues capable of climbing to $11,319, occupancy reaching a high of 73.3%, and ADRs peaking at $270.
- Conversely, the slowest single month of the year, typically falling within the low season, marks the market's lowest point. In this month, revenue might dip to $271, occupancy could drop to 11.9%, and ADRs may adjust down to $189.
- Understanding both the seasonal averages and these monthly peaks and troughs in revenue, occupancy, and ADR is crucial for maximizing your Airbnb profit potential in Myli.
Seasonal Strategies for Maximizing Profit
- Peak Season: Maximize revenue through premium pricing and potentially longer minimum stays. Ensure high availability.
- Low Season: Offer competitive pricing, special promotions (e.g., extended stay discounts), and flexible cancellation policies. Target off-season travelers like remote workers or budget-conscious guests.
- Shoulder Seasons: Implement dynamic pricing that balances peak and low rates. Target weekend travelers or specific events. Offer slightly more flexible terms than peak season.
- Regularly analyze your own performance against these Myli seasonality benchmarks and adjust your pricing and availability strategy accordingly.
Best Areas for Airbnb Investment in Myli (2026)
Exploring the top neighborhoods for short-term rentals in Myli? This section highlights key areas, outlining why they are attractive for hosts and guests, along with notable local attractions. Consider these locations based on your target guest profile and investment strategy.
| Neighborhood / Area | Why Host Here? (Target Guests & Appeal) | Key Attractions & Landmarks |
|---|---|---|
| Meteora | A UNESCO World Heritage site famous for its stunning rock formations and monasteries. It attracts tourists seeking both spiritual experiences and breathtaking views. | Meteora Monasteries, Kalambaka, Agios Nikolaos Anapausas Monastery, St. Stephen's Monastery, Holy Trinity Monastery |
| Thessaloniki | Greece's second-largest city, known for its rich history, vibrant nightlife, and cultural landmarks. A popular destination for both leisure and business travelers. | White Tower, Ano Poli, Aristotelous Square, Rotunda, Thessaloniki International Film Festival |
| Pelion | A scenic mountain peninsula known for its picturesque villages and beautiful beaches. Ideal for those looking for a mix of nature and culture. | Mouresi, Tsagarada, Damouchari Beach, Agios Ioannis Beach, Pelion Hiking Trails |
| Karditsa | An up-and-coming destination with a charming town center and access to the beautiful Lake Plastira, attracting outdoor enthusiasts and tranquility seekers. | Lake Plastira, Karditsa Town Square, Pindos National Park, St. George's Monastery |
| Galaxidi | A quaint seaside village known for its maritime past and natural beauty. Popular for visitors wanting a peaceful coastal escape. | Galaxidi Harbor, Maritime Museum of Galaxidi, St. Nicholas Church, Local beaches, Nearby Delphi |
| Arachova | A picturesque mountain town known for its skiing in winter. Popular with tourists for winter sports and its charming architecture. | Parnassos Ski Resort, Arachova Village, Ancient Delphi, The New Museum of Delphi |
| Delphi | An ancient site known as the center of the world in Greek mythology, attracting history lovers and tourists eager to explore archaeological wonders. | Delphi Archaeological Site, Delphi Museum, Temple of Apollo, Tholos of Delphi, Castalian Spring |
| Chalkida | The capital of Euboea, known for its unique tidal phenomenon and lively waterfront. A great location for those looking for a seaside getaway close to Athens. | Chalkida Bridge, Eretria, Karababa Castle, Archaeological Museum of Chalkida, Active beach bars and restaurants |
Understanding Airbnb License Requirements & STR Laws in Myli (2026)
Yes, Myli, Thessaly and Central Greece, Greece enforces high STR regulations. Obtaining a license and ensuring compliance is almost certainly required according to current 2026 STR laws. Always verify the latest short term rental regulations and Airbnb license requirements directly with local government authorities for Myli to ensure full compliance before hosting.
(Source: AirROI data, 2026, based on 94% licensed listings)
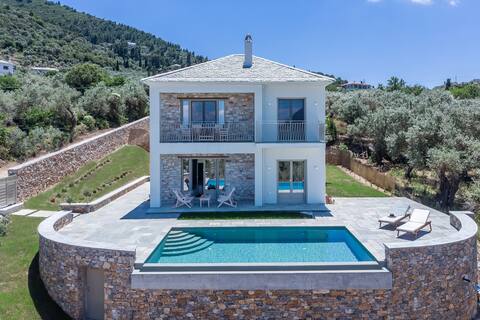
Top Performing Airbnb Properties in Myli (2026)
Benchmark your potential! Explore examples of top-performing Airbnb properties in Mylibased on Trailing Twelve Month (TTM) revenue. Analyze their characteristics, revenue, occupancy rate, and ADR to understand what drives success in this market.

Pasithea Skopelos Retreat
Entire Place • 2 bedrooms

Sunshine Pool Villa
Entire Place • 3 bedrooms

Villa Almond
Entire Place • 2 bedrooms

Karavos Sea View Apartment- Plori
Entire Place • 1 bedroom
Villa Kingstone
Entire Place • 2 bedrooms

Villa Kingstone 2
Entire Place • 3 bedrooms
Note: Performance varies based on location, size, amenities, seasonality, and management quality. Data reflects the past 12 months.
Top Performing Airbnb Hosts in Myli (2026)
Learn from the best! This table showcases top-performing Airbnb hosts in Myli based on the number of properties managed and estimated total revenue over the past year. Analyze their scale and performance metrics.
| Host Name | Properties | Grossing Revenue | Stay Reviews | Avg Rating |
|---|---|---|---|---|
| Κατερίνα | 2 | $99,811 | 41 | 5.00/5.0 |
| Ioannis | 3 | $96,715 | 30 | 4.79/5.0 |
| Manos | 3 | $95,121 | 22 | 5.00/5.0 |
| Dimitris K. | 4 | $91,740 | 72 | 4.95/5.0 |
| Vasilis | 1 | $70,671 | 15 | 5.00/5.0 |
| Stelios | 2 | $64,711 | 18 | 5.00/5.0 |
| Κέρη | 1 | $47,325 | 6 | 5.00/5.0 |
| Richard | 1 | $34,640 | 5 | 5.00/5.0 |
| Manolis | 1 | $33,577 | 17 | 5.00/5.0 |
| Kostas | 1 | $32,377 | 11 | 4.91/5.0 |
Analyzing the strategies of top hosts, such as their property selection, pricing, and guest communication, can offer valuable lessons for optimizing your own Airbnb operations in Myli.
Dive Deeper: Advanced Myli STR Market Data (2026)
Ready to unlock more insights? AirROI provides access to advanced metrics and comprehensive Airbnb data for Myli. Explore detailed analytics beyond this report to refine your investment strategy, optimize pricing, and maximize your vacation rental profits.
Explore Advanced MetricsMyli Short-Term Rental Market Composition (2026): Property & Room Types
Room Type Distribution
Property Type Distribution
Market Composition Insights for Myli
- The Myli Airbnb market composition is heavily skewed towards Entire Home/Apt listings, which make up 100% of the 52 active rentals. This indicates strong guest preference for privacy and space.
- Looking at the property type distribution in Myli, Apartment/Condo properties are the most common (48.1%), reflecting the local real estate landscape.
- Houses represent a significant 48.1% portion, catering likely to families or larger groups.
- Smaller segments like others, unique stays (combined 3.8%) offer potential for unique stay experiences.
Myli Airbnb Room Capacity Analysis (2026): Bedroom Distribution
Distribution of Listings by Number of Bedrooms
Room Capacity Insights for Myli
- The dominant room capacity in Myli is 2 bedrooms listings, making up 40.4% of the market. This suggests a strong demand for properties suitable for couples or solo travelers.
- Together, 2 bedrooms and 1 bedroom properties represent 78.9% of the active Airbnb listings in Myli, indicating a high concentration in these sizes.
Myli Vacation Rental Guest Capacity Trends (2026)
Distribution of Listings by Guest Capacity
Guest Capacity Insights for Myli
- The most common guest capacity trend in Myli vacation rentals is listings accommodating 4 guests (32.7%). This suggests the primary traveler segment is likely small families or groups.
- Properties designed for 4 guests and 6 guests dominate the Myli STR market, accounting for 55.8% of listings.
- 26.9% of properties accommodate 6+ guests, serving the market segment for larger families or group travel in Myli.
- On average, properties in Myli are equipped to host 4.3 guests.
Myli Airbnb Booking Patterns (2026): Available vs. Booked Days
Available Days Distribution
Booked Days Distribution
Booking Pattern Insights for Myli
- The most common availability pattern in Myli falls within the 271-366 days range, representing 75% of listings. This suggests many properties have significant open periods on their calendars.
- Approximately 96.2% of listings show high availability (181+ days open annually), indicating potential for increased bookings or specific owner usage patterns.
- For booked days, the 31-90 days range is most frequent in Myli (50%), reflecting common guest stay durations or potential owner blocking patterns.
- A notable 3.8% of properties secure long booking periods (181+ days booked per year), highlighting successful long-term rental strategies or significant owner usage.
Myli Airbnb Minimum Stay Requirements Analysis
Distribution of Listings by Minimum Night Requirement
1 Night
2 listings
3.8% of total
2 Nights
5 listings
9.6% of total
3 Nights
10 listings
19.2% of total
4-6 Nights
14 listings
26.9% of total
30+ Nights
21 listings
40.4% of total
Key Insights
- The most prevalent minimum stay requirement in Myli is 30+ Nights, adopted by 40.4% of listings. This highlights the market's preference for longer commitments.
- Very short stays (1-2 nights) are less common (13.4%), suggesting hosts prefer slightly longer bookings to optimize turnover.
- A significant segment (40.4%) caters to monthly stays (30+ nights) in Myli, pointing to opportunities in the extended-stay market.
Recommendations
- Align with the market by considering a 30+ Nights minimum stay, as 40.4% of Myli hosts use this setting.
- If feasible, allowing 1-night stays, especially midweek or during low season, could capture last-minute bookings, as only 3.8% currently do.
- Explore offering discounts for stays of 30+ nights to attract the 40.4% of the market seeking extended stays.
- Adjust minimum nights based on seasonality – potentially shorter during low season and longer during peak demand periods in Myli.
Myli Airbnb Cancellation Policy Trends Analysis (2026)
Super Strict 30 Days
4 listings
7.7% of total
Super Strict 60 Days
1 listings
1.9% of total
Moderate
6 listings
11.5% of total
Firm
32 listings
61.5% of total
Strict
9 listings
17.3% of total
Cancellation Policy Insights for Myli
- The prevailing Airbnb cancellation policy trend in Myli is Firm, used by 61.5% of listings.
- A majority (78.8%) of hosts in Myli utilize Firm or Strict policies, indicating a market where hosts prioritize booking security.
Recommendations for Hosts
- Consider adopting a Firm policy to align with the 61.5% market standard in Myli.
- Regularly review your cancellation policy against competitors and market demand shifts in Myli.
Myli STR Booking Lead Time Analysis (2026)
Average Booking Lead Time by Month
Booking Lead Time Insights for Myli
- The overall average booking lead time for vacation rentals in Myli is 79 days.
- Guests book furthest in advance for stays during November (average 248 days), likely coinciding with peak travel demand or local events.
- The shortest booking windows occur for stays in December (average 1 days), indicating more last-minute travel plans during this time.
- Seasonally, Fall (146 days avg.) sees the longest lead times, while Winter (8 days avg.) has the shortest, reflecting typical travel planning cycles.
Recommendations for Hosts
- Use the overall average lead time (79 days) as a baseline for your pricing and availability strategy in Myli.
- For November stays, consider implementing length-of-stay discounts or slightly higher rates for bookings made less than 248 days out to capitalize on advance planning.
- During December, focus on last-minute booking availability and promotions, as guests book with very short notice (1 days avg.).
- Target marketing efforts for the Fall season well in advance (at least 146 days) to capture early planners.
- Monitor your own booking lead times against these Myli averages to identify opportunities for dynamic pricing adjustments.
Popular & Essential Airbnb Amenities in Myli (2026)
Amenity Prevalence
Amenity Insights for Myli
- Essential amenities in Myli that guests expect include: Wifi, Hair dryer, Air conditioning. Lacking these (any) could significantly impact bookings.
- Popular amenities like Kitchen, Hangers, Free parking on premises are common but not universal. Offering these can provide a competitive edge.
Recommendations for Hosts
- Ensure your listing includes all essential amenities for Myli: Wifi, Hair dryer, Air conditioning.
- Prioritize adding missing essentials: Air conditioning.
- Consider adding popular differentiators like Kitchen or Hangers to increase appeal.
- Highlight unique or less common amenities you offer (e.g., hot tub, dedicated workspace, EV charger) in your listing description and photos.
- Regularly check competitor amenities in Myli to stay competitive.
Myli Airbnb Guest Demographics & Profile Analysis (2026)
Guest Profile Summary for Myli
- The typical guest profile for Airbnb in Myli consists of predominantly international visitors (97%), with top international origins including France, typically belonging to the Post-2000s (Gen Z/Alpha) group (50%), primarily speaking English or German.
- Domestic travelers account for 3.4% of guests.
- Key international markets include United Kingdom (33.3%) and France (13.8%).
- Top languages spoken are English (44.6%) followed by German (16.2%).
- A significant demographic segment is the Post-2000s (Gen Z/Alpha) group, representing 50% of guests.
Recommendations for Hosts
- Focus marketing internationally, particularly towards travelers from France.
- Tailor amenities and listing descriptions to appeal to the dominant Post-2000s (Gen Z/Alpha) demographic (e.g., highlight fast WiFi, smart home features, local guides).
- Highlight unique local experiences or amenities relevant to the primary guest profile.
- Consider seasonal promotions aligned with peak travel times for key origin markets.
Nearby Short-Term Rental Market Comparison
How does the Myli Airbnb market stack up against its neighbors? Compare key performance metrics like average monthly revenue, ADR, and occupancy rates in surrounding areas to understand the broader regional STR landscape.
| Market | Active Properties | Monthly Revenue | Daily Rate | Avg. Occupancy |
|---|---|---|---|---|
| Skiathos Municipality | 68 | $2,488 | $456.24 | 48% |
| Achladias | 92 | $2,443 | $360.50 | 47% |
| Sporades | 22 | $2,433 | $326.24 | 53% |
| Nerotrivia | 15 | $2,060 | $209.06 | 47% |
| Klima | 20 | $2,023 | $348.92 | 40% |
| Magoula | 13 | $1,902 | $286.78 | 33% |
| Municipality of Marathonas | 79 | $1,802 | $286.80 | 31% |
| Panorama Municipal Unit | 11 | $1,735 | $285.42 | 36% |
| Kalyvia | 23 | $1,642 | $248.74 | 42% |
| Mourtero | 16 | $1,623 | $226.09 | 46% |