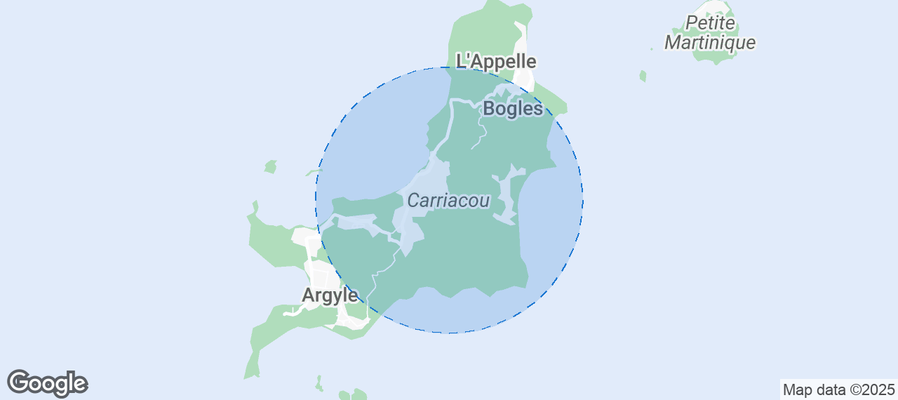
Hillsborough Airbnb Market Analysis 2026: Short Term Rental Data & Vacation Rental Statistics in Carriacou and Petite Martinique, Grenada
Is Airbnb profitable in Hillsborough in 2026? Explore comprehensive Airbnb analytics for Hillsborough, Carriacou and Petite Martinique, Grenada to uncover income potential. This 2026 STR market report for Hillsborough, based on AirROI data from July 2024 to June 2025, reveals key trends in the niche market of 18 active listings.
Whether you're considering an Airbnb investment in Hillsborough, optimizing your existing vacation rental, or exploring rental arbitrage opportunities, understanding the Hillsborough Airbnb data is crucial. Leveraging the low regulation environment is key to maximizing your short term rental income potential. Let's dive into the specifics.
Key Hillsborough Airbnb Performance Metrics Overview
Monthly Airbnb Revenue Variations & Income Potential in Hillsborough (2026)
Understanding the monthly revenue variations for Airbnb listings in Hillsborough is key to maximizing your short term rental income potential. Seasonality significantly impacts earnings. Our analysis, based on data from the past 12 months, shows that the peak revenue month for STRs in Hillsborough is typically February, while November often presents the lowest earnings, highlighting opportunities for strategic pricing adjustments during shoulder and low seasons. Explore the typical Airbnb income in Hillsborough across different performance tiers:
- Best-in-class properties (Top 10%) achieve $2,524+ monthly, often utilizing dynamic pricing and superior guest experiences.
- Strong performing properties (Top 25%) earn $1,647 or more, indicating effective management and desirable locations/amenities.
- Typical properties (Median) generate around $959 per month, representing the average market performance.
- Entry-level properties (Bottom 25%) see earnings around $432, often with potential for optimization.
Average Monthly Airbnb Earnings Trend in Hillsborough
Hillsborough Airbnb Occupancy Rate Trends (2026)
Maximize your bookings by understanding the Hillsborough STR occupancy trends. Seasonal demand shifts significantly influence how often properties are booked. Typically, Februarysees the highest demand (peak season occupancy), while September experiences the lowest (low season). Effective strategies, like adjusting minimum stays or offering promotions, can boost occupancy during slower periods. Here's how different property tiers perform in Hillsborough:
- Best-in-class properties (Top 10%) achieve 51%+ occupancy, indicating high desirability and potentially optimized availability.
- Strong performing properties (Top 25%) maintain 34% or higher occupancy, suggesting good market fit and guest satisfaction.
- Typical properties (Median) have an occupancy rate around 18%.
- Entry-level properties (Bottom 25%) average 11% occupancy, potentially facing higher vacancy.
Average Monthly Occupancy Rate Trend in Hillsborough
Average Daily Rate (ADR) Airbnb Trends in Hillsborough (2026)
Effective short term rental pricing strategy in Hillsborough involves understanding monthly ADR fluctuations. The Average Daily Rate (ADR) for Airbnb in Hillsborough typically peaks in May and dips lowest during November. Leveraging Airbnb dynamic pricing tools or strategies based on this seasonality can significantly boost revenue. Here's a look at the typical nightly rates achieved:
- Best-in-class properties (Top 10%) command rates of $311+ per night, often due to premium features or locations.
- Strong performing properties (Top 25%) achieve nightly rates of $197 or more.
- Typical properties (Median) charge around $118 per night.
- Entry-level properties (Bottom 25%) earn around $81 per night.
Average Daily Rate (ADR) Trend by Month in Hillsborough
Get Live Hillsborough Market Intelligence 👇
Explore Real-time Analytics
Airbnb Seasonality Analysis & Trends in Hillsborough (2025)
Peak Season (February, March, May)
- Revenue averages $1,860 per month
- Occupancy rates average 38.3%
- Daily rates average $185
Shoulder Season
- Revenue averages $1,121 per month
- Occupancy maintains around 24.4%
- Daily rates hold near $161
Low Season (July, September, November)
- Revenue drops to average $606 per month
- Occupancy decreases to average 8.7%
- Daily rates adjust to average $148
Seasonality Insights for Hillsborough
- The Airbnb seasonality in Hillsborough shows highly seasonal trends requiring careful strategy. While the sections above show seasonal averages, it's also insightful to look at the extremes:
- During the high season, the absolute peak month showcases Hillsborough's highest earning potential, with monthly revenues capable of climbing to $2,047, occupancy reaching a high of 43.6%, and ADRs peaking at $188.
- Conversely, the slowest single month of the year, typically falling within the low season, marks the market's lowest point. In this month, revenue might dip to $430, occupancy could drop to 3.3%, and ADRs may adjust down to $147.
- Understanding both the seasonal averages and these monthly peaks and troughs in revenue, occupancy, and ADR is crucial for maximizing your Airbnb profit potential in Hillsborough.
Seasonal Strategies for Maximizing Profit
- Peak Season: Maximize revenue through premium pricing and potentially longer minimum stays. Ensure high availability.
- Low Season: Offer competitive pricing, special promotions (e.g., extended stay discounts), and flexible cancellation policies. Target off-season travelers like remote workers or budget-conscious guests.
- Shoulder Seasons: Implement dynamic pricing that balances peak and low rates. Target weekend travelers or specific events. Offer slightly more flexible terms than peak season.
- Regularly analyze your own performance against these Hillsborough seasonality benchmarks and adjust your pricing and availability strategy accordingly.
Best Areas for Airbnb Investment in Hillsborough (2026)
Exploring the top neighborhoods for short-term rentals in Hillsborough? This section highlights key areas, outlining why they are attractive for hosts and guests, along with notable local attractions. Consider these locations based on your target guest profile and investment strategy.
| Neighborhood / Area | Why Host Here? (Target Guests & Appeal) | Key Attractions & Landmarks |
|---|---|---|
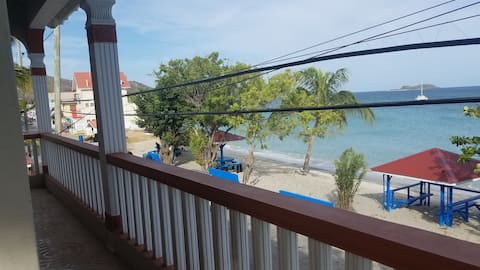
| Hillsborough | The capital of Carriacou, Hillsborough offers a charming atmosphere with access to beautiful beaches and local culture. It's a great spot for travelers looking to experience true Grenadian island life. | Bayside Beach, Hillsborough Bay, Local markets, Carriacou Museum, Isle de Ronde, Nearby snorkeling spots |
| Sandy Island | A stunning small island near Carriacou, Sandy Island is a perfect getaway for those looking for beautiful beaches and excellent snorkeling opportunities. An ideal spot for beach lovers. | Sandy Island Beach, Snorkeling, Relaxation spots, Clear turquoise waters |
| Anse La Roche | Known for its secluded and pristine beach, Anse La Roche is a high-demand location for those seeking tranquility and nature. Ideal for couples or solo travelers looking for a peaceful retreat. | Anse La Roche Beach, Hiking trails, Secluded atmosphere |
| Windward | Windward is a picturesque village with beautiful views and a more laid-back atmosphere. Popular for those who enjoy fishing and local culture, offering an authentic island experience. | Windward Beach, Local fish market, Cultural experiences, Community events |
| Petit Martinique | This small, lesser-known island offers a serene escape with stunning landscapes and local charm. Perfect for travelers seeking a unique experience away from the more touristy areas. | Local beaches, Quiet atmosphere, Water sports, Fishing spots |
| Tyrell Bay | Tyrell Bay is known for its beautiful harbor and is a hub for yachting tourists. It provides a vibrant atmosphere with various restaurants and water activities, making it a good choice for visitors. | Tyrell Bay Beach, Yacht watching, Restaurants and bars, Water sports activities |
| Grand Anse Beach | Though technically not in Carriacou, Grand Anse Beach is one of Grenada's most famous beaches, attracting tourists from all over. Hosting an Airbnb here could yield significant returns due to high demand. | Grand Anse Beach, Water sports, Shopping and dining nearby, Beach bars |
| Scotts Head | Located on the southern tip of Carriacou, Scotts Head offers stunning views and great opportunities for diving and snorkeling. It is perfect for adventurous tourists looking to explore marine life. | Scuba diving, Snorkeling spots, Panoramic views, Local eateries |
Understanding Airbnb License Requirements & STR Laws in Hillsborough (2026)
While Hillsborough, Carriacou and Petite Martinique, Grenada currently shows low STR regulations, specific Airbnb license requirements might still exist or change. Always verify the latest short term rental regulations and Airbnb license requirements directly with local government authorities for Hillsborough to ensure full compliance before hosting.
(Source: AirROI data, 2026, finding no licensed listings among those analyzed)
Top Performing Airbnb Properties in Hillsborough (2026)
Benchmark your potential! Explore examples of top-performing Airbnb properties in Hillsboroughbased on Trailing Twelve Month (TTM) revenue. Analyze their characteristics, revenue, occupancy rate, and ADR to understand what drives success in this market.

Rosa Guesthouse Seascape
Entire Place • 2 bedrooms
Rosa Guesthouse Regatta
Entire Place • 2 bedrooms

2 Bedroom with Incredible Sea View
Entire Place • 2 bedrooms
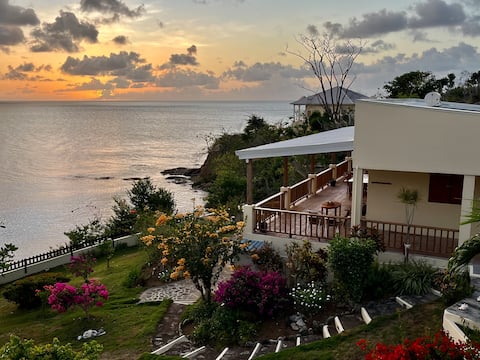
Beachfront Villa, Peaceful Paradise Retreat
Entire Place • 3 bedrooms

Stylish new luxury villa with expansive views
Entire Place • 2 bedrooms
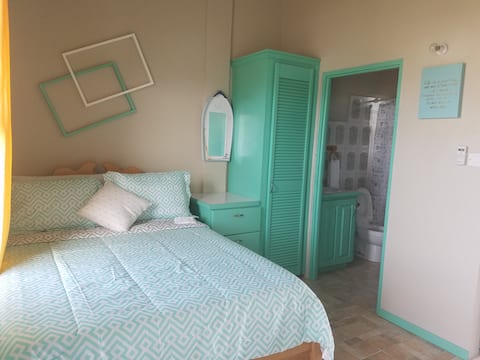
Rosa Guesthouse Studio
Entire Place • N/A
Note: Performance varies based on location, size, amenities, seasonality, and management quality. Data reflects the past 12 months.
Top Performing Airbnb Hosts in Hillsborough (2026)
Learn from the best! This table showcases top-performing Airbnb hosts in Hillsborough based on the number of properties managed and estimated total revenue over the past year. Analyze their scale and performance metrics.
| Host Name | Properties | Grossing Revenue | Stay Reviews | Avg Rating |
|---|---|---|---|---|
| Beverley | 4 | $46,012 | 71 | 4.90/5.0 |
| Chris | 1 | $13,500 | 29 | 4.90/5.0 |
| Sally | 1 | $12,777 | 14 | 4.93/5.0 |
| Alan | 1 | $12,491 | 10 | 5.00/5.0 |
| Roxanne | 1 | $10,470 | 8 | 4.88/5.0 |
| Jenny And Adam | 1 | $9,196 | 13 | 5.00/5.0 |
| Wilma | 1 | $6,581 | 4 | 4.75/5.0 |
| Corine | 2 | $6,185 | 13 | 4.64/5.0 |
| Bryan | 1 | $5,707 | 8 | 4.88/5.0 |
| Francois | 1 | $2,258 | 16 | 5.00/5.0 |
Analyzing the strategies of top hosts, such as their property selection, pricing, and guest communication, can offer valuable lessons for optimizing your own Airbnb operations in Hillsborough.
Dive Deeper: Advanced Hillsborough STR Market Data (2026)
Ready to unlock more insights? AirROI provides access to advanced metrics and comprehensive Airbnb data for Hillsborough. Explore detailed analytics beyond this report to refine your investment strategy, optimize pricing, and maximize your vacation rental profits.
Explore Advanced MetricsHillsborough Short-Term Rental Market Composition (2026): Property & Room Types
Room Type Distribution
Property Type Distribution
Market Composition Insights for Hillsborough
- The Hillsborough Airbnb market composition is heavily skewed towards Entire Home/Apt listings, which make up 94.4% of the 18 active rentals. This indicates strong guest preference for privacy and space.
- Looking at the property type distribution in Hillsborough, Apartment/Condo properties are the most common (61.1%), reflecting the local real estate landscape.
- Houses represent a significant 33.3% portion, catering likely to families or larger groups.
- The presence of 5.6% Hotel/Boutique listings indicates integration with traditional hospitality.
Hillsborough Airbnb Room Capacity Analysis (2026): Bedroom Distribution
Distribution of Listings by Number of Bedrooms
Room Capacity Insights for Hillsborough
- The dominant room capacity in Hillsborough is 2 bedrooms listings, making up 44.4% of the market. This suggests a strong demand for properties suitable for couples or solo travelers.
- Together, 2 bedrooms and 1 bedroom properties represent 72.2% of the active Airbnb listings in Hillsborough, indicating a high concentration in these sizes.
Hillsborough Vacation Rental Guest Capacity Trends (2026)
Distribution of Listings by Guest Capacity
Guest Capacity Insights for Hillsborough
- The most common guest capacity trend in Hillsborough vacation rentals is listings accommodating 4 guests (38.9%). This suggests the primary traveler segment is likely small families or groups.
- Properties designed for 4 guests and 6 guests dominate the Hillsborough STR market, accounting for 61.1% of listings.
- 22.2% of properties accommodate 6+ guests, serving the market segment for larger families or group travel in Hillsborough.
- On average, properties in Hillsborough are equipped to host 3.8 guests.
Hillsborough Airbnb Booking Patterns (2026): Available vs. Booked Days
Available Days Distribution
Booked Days Distribution
Booking Pattern Insights for Hillsborough
- The most common availability pattern in Hillsborough falls within the 271-366 days range, representing 83.3% of listings. This suggests many properties have significant open periods on their calendars.
- Approximately 100.0% of listings show high availability (181+ days open annually), indicating potential for increased bookings or specific owner usage patterns.
- For booked days, the 1-30 days range is most frequent in Hillsborough (50%), reflecting common guest stay durations or potential owner blocking patterns.
Hillsborough Airbnb Minimum Stay Requirements Analysis
Distribution of Listings by Minimum Night Requirement
1 Night
6 listings
37.5% of total
2 Nights
6 listings
37.5% of total
4-6 Nights
2 listings
12.5% of total
30+ Nights
2 listings
12.5% of total
Key Insights
- The most prevalent minimum stay requirement in Hillsborough is 1 Night, adopted by 37.5% of listings. This highlights the market's preference for shorter, flexible bookings.
- A strong majority (75.0%) of the Hillsborough Airbnb data shows acceptance of very short stays (1-2 nights), indicating a dynamic, high-turnover market.
- A significant segment (12.5%) caters to monthly stays (30+ nights) in Hillsborough, pointing to opportunities in the extended-stay market.
Recommendations
- Align with the market by considering a 1 Night minimum stay, as 37.5% of Hillsborough hosts use this setting.
- Explore offering discounts for stays of 30+ nights to attract the 12.5% of the market seeking extended stays.
- Adjust minimum nights based on seasonality – potentially shorter during low season and longer during peak demand periods in Hillsborough.
Hillsborough Airbnb Cancellation Policy Trends Analysis (2026)
Flexible
6 listings
33.3% of total
Moderate
11 listings
61.1% of total
Firm
1 listings
5.6% of total
Cancellation Policy Insights for Hillsborough
- The prevailing Airbnb cancellation policy trend in Hillsborough is Moderate, used by 61.1% of listings.
- The market strongly favors guest-friendly terms, with 94.4% of listings offering Flexible or Moderate policies. This suggests guests in Hillsborough may expect booking flexibility.
Recommendations for Hosts
- Consider adopting a Moderate policy to align with the 61.1% market standard in Hillsborough.
- Regularly review your cancellation policy against competitors and market demand shifts in Hillsborough.
Hillsborough STR Booking Lead Time Analysis (2026)
Average Booking Lead Time by Month
Booking Lead Time Insights for Hillsborough
- The overall average booking lead time for vacation rentals in Hillsborough is 70 days.
- Guests book furthest in advance for stays during February (average 121 days), likely coinciding with peak travel demand or local events.
- The shortest booking windows occur for stays in September (average 1 days), indicating more last-minute travel plans during this time.
- Seasonally, Winter (97 days avg.) sees the longest lead times, while Spring (51 days avg.) has the shortest, reflecting typical travel planning cycles.
Recommendations for Hosts
- Use the overall average lead time (70 days) as a baseline for your pricing and availability strategy in Hillsborough.
- For February stays, consider implementing length-of-stay discounts or slightly higher rates for bookings made less than 121 days out to capitalize on advance planning.
- During September, focus on last-minute booking availability and promotions, as guests book with very short notice (1 days avg.).
- Target marketing efforts for the Winter season well in advance (at least 97 days) to capture early planners.
- Monitor your own booking lead times against these Hillsborough averages to identify opportunities for dynamic pricing adjustments.
Popular & Essential Airbnb Amenities in Hillsborough (2026)
Amenity data is currently unavailable for Hillsborough.
Hillsborough Airbnb Guest Demographics & Profile Analysis (2026)
Guest Profile Summary for Hillsborough
- The typical guest profile for Airbnb in Hillsborough consists of predominantly international visitors (89%), with top international origins including United Kingdom, typically belonging to the Post-2000s (Gen Z/Alpha) group (50%), primarily speaking English or French.
- Domestic travelers account for 11.5% of guests.
- Key international markets include United States (34.6%) and United Kingdom (19.2%).
- Top languages spoken are English (45.5%) followed by French (18.2%).
- A significant demographic segment is the Post-2000s (Gen Z/Alpha) group, representing 50% of guests.
Recommendations for Hosts
- Focus marketing internationally, particularly towards travelers from United Kingdom.
- Tailor amenities and listing descriptions to appeal to the dominant Post-2000s (Gen Z/Alpha) demographic (e.g., highlight fast WiFi, smart home features, local guides).
- Highlight unique local experiences or amenities relevant to the primary guest profile.
- Consider seasonal promotions aligned with peak travel times for key origin markets.
Nearby Short-Term Rental Market Comparison
How does the Hillsborough Airbnb market stack up against its neighbors? Compare key performance metrics like average monthly revenue, ADR, and occupancy rates in surrounding areas to understand the broader regional STR landscape.
| Market | Active Properties | Monthly Revenue | Daily Rate | Avg. Occupancy |
|---|---|---|---|---|
| Soufrière | 104 | $3,680 | $309.19 | 49% |
| Belvedere | 14 | $3,285 | $235.67 | 56% |
| Coolie Town | 99 | $2,998 | $329.94 | 41% |
| Mount Irvine | 14 | $2,562 | $297.70 | 38% |
| Old Grange | 18 | $2,249 | $291.27 | 37% |
| Morne Rouge | 13 | $2,032 | $190.91 | 41% |
| Piaye | 20 | $2,031 | $187.69 | 38% |
| Lance Aux Epines | 70 | $1,982 | $307.95 | 36% |
| Buccoo | 96 | $1,873 | $222.19 | 32% |
| Scarborough | 155 | $1,815 | $251.51 | 30% |