Frequente Airbnb Market Analysis 2026: Short Term Rental Data & Vacation Rental Statistics in Saint George, Grenada
Is Airbnb profitable in Frequente in 2026? Explore comprehensive Airbnb analytics for Frequente, Saint George, Grenada to uncover income potential. This 2026 STR market report for Frequente, based on AirROI data from February 2025 to January 2026, reveals key trends in the niche market of 31 active listings.
Whether you're considering an Airbnb investment in Frequente, optimizing your existing vacation rental, or exploring rental arbitrage opportunities, understanding the Frequente Airbnb data is crucial. Leveraging the low regulation environment is key to maximizing your short term rental income potential. Let's dive into the specifics.
Key Frequente Airbnb Performance Metrics Overview
Monthly Airbnb Revenue Variations & Income Potential in Frequente (2026)
Understanding the monthly revenue variations for Airbnb listings in Frequente is key to maximizing your short term rental income potential. Seasonality significantly impacts earnings. Our analysis, based on data from the past 12 months, shows that the peak revenue month for STRs in Frequente is typically July, while January often presents the lowest earnings, highlighting opportunities for strategic pricing adjustments during shoulder and low seasons. Explore the typical Airbnb income in Frequente across different performance tiers:
- Best-in-class properties (Top 10%) achieve $2,844+ monthly, often utilizing dynamic pricing and superior guest experiences.
- Strong performing properties (Top 25%) earn $1,798 or more, indicating effective management and desirable locations/amenities.
- Typical properties (Median) generate around $1,070 per month, representing the average market performance.
- Entry-level properties (Bottom 25%) see earnings around $552, often with potential for optimization.
Average Monthly Airbnb Earnings Trend in Frequente
Frequente Airbnb Occupancy Rate Trends (2026)
Maximize your bookings by understanding the Frequente STR occupancy trends. Seasonal demand shifts significantly influence how often properties are booked. Typically, Augustsees the highest demand (peak season occupancy), while January experiences the lowest (low season). Effective strategies, like adjusting minimum stays or offering promotions, can boost occupancy during slower periods. Here's how different property tiers perform in Frequente:
- Best-in-class properties (Top 10%) achieve 82%+ occupancy, indicating high desirability and potentially optimized availability.
- Strong performing properties (Top 25%) maintain 64% or higher occupancy, suggesting good market fit and guest satisfaction.
- Typical properties (Median) have an occupancy rate around 43%.
- Entry-level properties (Bottom 25%) average 21% occupancy, potentially facing higher vacancy.
Average Monthly Occupancy Rate Trend in Frequente
Average Daily Rate (ADR) Airbnb Trends in Frequente (2026)
Effective short term rental pricing strategy in Frequente involves understanding monthly ADR fluctuations. The Average Daily Rate (ADR) for Airbnb in Frequente typically peaks in August and dips lowest during January. Leveraging Airbnb dynamic pricing tools or strategies based on this seasonality can significantly boost revenue. Here's a look at the typical nightly rates achieved:
- Best-in-class properties (Top 10%) command rates of $158+ per night, often due to premium features or locations.
- Strong performing properties (Top 25%) achieve nightly rates of $124 or more.
- Typical properties (Median) charge around $91 per night.
- Entry-level properties (Bottom 25%) earn around $72 per night.
Average Daily Rate (ADR) Trend by Month in Frequente
Get Live Frequente Market Intelligence 👇

Explore Real-time Analytics
Airbnb Seasonality Analysis & Trends in Frequente (2026)
Peak Season (July, August, March)
- Revenue averages $1,788 per month
- Occupancy rates average 47.0%
- Daily rates average $113
Shoulder Season
- Revenue averages $1,326 per month
- Occupancy maintains around 46.4%
- Daily rates hold near $106
Low Season (January, May, June)
- Revenue drops to average $1,062 per month
- Occupancy decreases to average 35.4%
- Daily rates adjust to average $107
Seasonality Insights for Frequente
- The Airbnb seasonality in Frequente shows highly seasonal trends requiring careful strategy. While the sections above show seasonal averages, it's also insightful to look at the extremes:
- During the high season, the absolute peak month showcases Frequente's highest earning potential, with monthly revenues capable of climbing to $2,011, occupancy reaching a high of 52.4%, and ADRs peaking at $119.
- Conversely, the slowest single month of the year, typically falling within the low season, marks the market's lowest point. In this month, revenue might dip to $955, occupancy could drop to 30.6%, and ADRs may adjust down to $100.
- Understanding both the seasonal averages and these monthly peaks and troughs in revenue, occupancy, and ADR is crucial for maximizing your Airbnb profit potential in Frequente.
Seasonal Strategies for Maximizing Profit
- Peak Season: Maximize revenue through premium pricing and potentially longer minimum stays. Ensure high availability.
- Low Season: Offer competitive pricing, special promotions (e.g., extended stay discounts), and flexible cancellation policies. Target off-season travelers like remote workers or budget-conscious guests.
- Shoulder Seasons: Implement dynamic pricing that balances peak and low rates. Target weekend travelers or specific events. Offer slightly more flexible terms than peak season.
- Regularly analyze your own performance against these Frequente seasonality benchmarks and adjust your pricing and availability strategy accordingly.
Best Areas for Airbnb Investment in Frequente (2026)
Exploring the top neighborhoods for short-term rentals in Frequente? This section highlights key areas, outlining why they are attractive for hosts and guests, along with notable local attractions. Consider these locations based on your target guest profile and investment strategy.
| Neighborhood / Area | Why Host Here? (Target Guests & Appeal) | Key Attractions & Landmarks |
|---|---|---|
| Grand Anse Beach | Famous for its beautiful sandy beach and crystal-clear waters, Grand Anse is a top destination for tourists seeking relaxation and water activities. Its proximity to amenities and hotels makes it ideal for hosting Airbnb guests. | Grand Anse Beach, Spice Market, Aquatic Sports, Diving Spots, BBQ Beach Nights |
| St. George's | The capital city of Grenada, St. George's is rich in history and offers stunning views of the harbor. It is an attractive location for tourists interested in culture, dining, and historical sites. | Fort George, St. George's Harbor, National Museum, Market Square, Grenada Post Office |
| Trousseau | A quaint hillside neighborhood offering panoramic views of the Caribbean Sea and lush landscapes. It’s perfect for travelers seeking tranquility away from the busy tourist spots. | Hiking Trails, Local Restaurants, Scenic Views |
| Carriacou | An island that is part of Grenada, known for its beautiful beaches and vibrant local culture. It attracts visitors looking for a more authentic and less commercial experience. | Anse La Roche Beach, Carriacou Museum, Snorkeling Areas, Local Festivals |
| Levera National Park | A pristine natural area famous for hiking and wildlife. It is appealing to tourists who enjoy nature and outdoor activities, making it a good option for unique stays. | Levera Beach, Hiking Trails, Wildlife Viewing, Coral Reefs |
| Morne Rouge | A quieter beach area located next to Grand Anse, Morne Rouge is known for its calm waters and family-friendly atmosphere, making it appealing for family holiday stays. | Morne Rouge Beach, Water Sports, Beachfront Dining |
| Sauteurs | A charming fishing village known for its rich history and warm local community. Ideal for visitors looking to experience Grenada's authentic lifestyle and local cuisine. | Sauteurs Bay, Local Fish Markets, Historical sites, Community Events |
| Grenville | A true representation of Grenada's culture with its market and community feel. It's a great area for visitors interested in local life and products, complementing traditional hotel stays. | Grenville Market, Local Shops, Cultural Events, Historical Landmarks |
Understanding Airbnb License Requirements & STR Laws in Frequente (2026)
While Frequente, Saint George, Grenada currently shows low STR regulations, specific Airbnb license requirements might still exist or change. Always verify the latest short term rental regulations and Airbnb license requirements directly with local government authorities for Frequente to ensure full compliance before hosting.
(Source: AirROI data, 2026, finding no licensed listings among those analyzed)
Top Performing Airbnb Properties in Frequente (2026)
Benchmark your potential! Explore examples of top-performing Airbnb properties in Frequentebased on Trailing Twelve Month (TTM) revenue. Analyze their characteristics, revenue, occupancy rate, and ADR to understand what drives success in this market.

Sargasso Stone House-Rustic Charm & Stunning Views
Entire Place • 3 bedrooms
Artist's house with breezy balcony and lush garden
Entire Place • 2 bedrooms
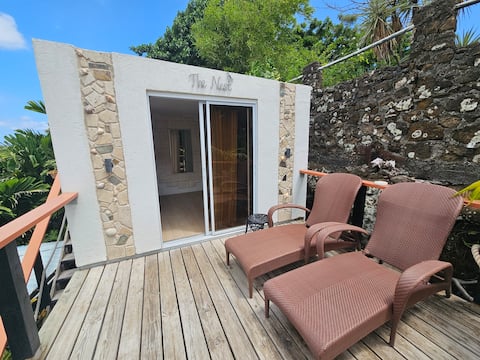
Modern breezy honeymoon hideaway
Entire Place • 1 bedroom
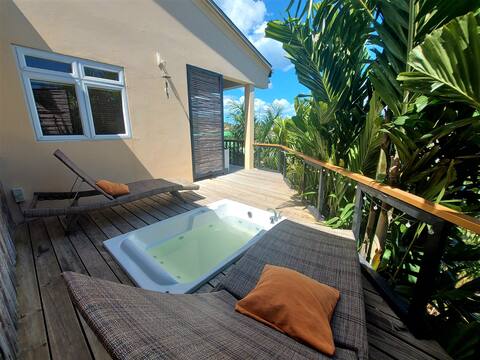
Unique Stay, Pool, Garden, FREE Airport Pickup!
Entire Place • 1 bedroom
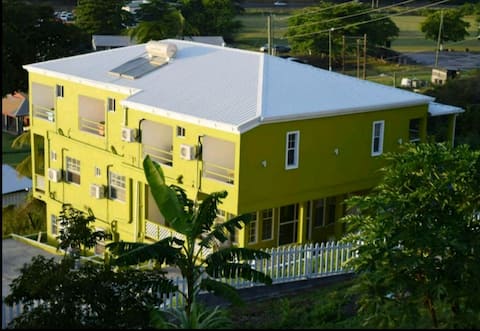
Jinja Isle Apartment, Airport View
Entire Place • 4 bedrooms

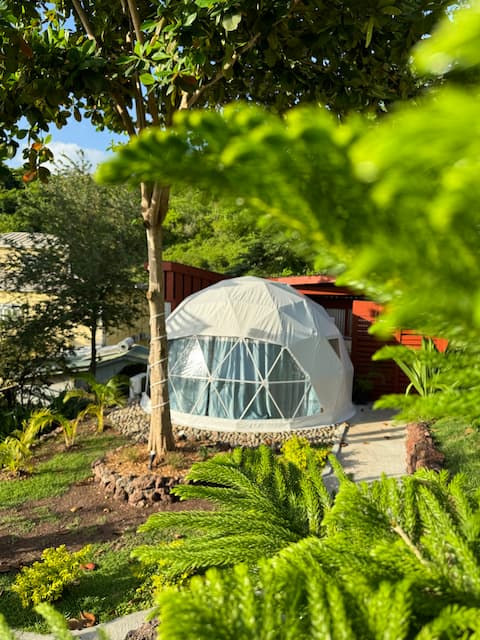
"The Tiny House" located at Frequente, Grand Anse
Entire Place • N/A
Note: Performance varies based on location, size, amenities, seasonality, and management quality. Data reflects the past 12 months.
Top Performing Airbnb Hosts in Frequente (2026)
Learn from the best! This table showcases top-performing Airbnb hosts in Frequente based on the number of properties managed and estimated total revenue over the past year. Analyze their scale and performance metrics.
| Host Name | Properties | Grossing Revenue | Stay Reviews | Avg Rating |
|---|---|---|---|---|
| Shannon | 3 | $63,670 | 109 | 4.84/5.0 |
| Rebecca | 2 | $49,620 | 278 | 4.86/5.0 |
| Angelo | 2 | $24,026 | 29 | 4.86/5.0 |
| Rebekah Kasha | 1 | $20,642 | 29 | 5.00/5.0 |
| Carla | 2 | $20,131 | 105 | 4.92/5.0 |
| Ameda | 1 | $17,857 | 56 | 4.95/5.0 |
| Dick | 1 | $16,067 | 95 | 4.84/5.0 |
| Tonia | 3 | $13,939 | 47 | 4.10/5.0 |
| Finch | 2 | $12,417 | 5 | 5.00/5.0 |
| Glenda | 1 | $6,638 | 26 | 4.92/5.0 |
Analyzing the strategies of top hosts, such as their property selection, pricing, and guest communication, can offer valuable lessons for optimizing your own Airbnb operations in Frequente.
Dive Deeper: Advanced Frequente STR Market Data (2026)
Ready to unlock more insights? AirROI provides access to advanced metrics and comprehensive Airbnb data for Frequente. Explore detailed analytics beyond this report to refine your investment strategy, optimize pricing, and maximize your vacation rental profits.
Explore Advanced MetricsFrequente Short-Term Rental Market Composition (2026): Property & Room Types
Room Type Distribution
Property Type Distribution
Market Composition Insights for Frequente
- The Frequente Airbnb market composition is heavily skewed towards Entire Home/Apt listings, which make up 96.8% of the 31 active rentals. This indicates strong guest preference for privacy and space.
- Looking at the property type distribution in Frequente, Apartment/Condo properties are the most common (67.7%), reflecting the local real estate landscape.
- Houses represent a significant 25.8% portion, catering likely to families or larger groups.
- Smaller segments like unique stays, hotel/boutique (combined 6.4%) offer potential for unique stay experiences.
Frequente Airbnb Room Capacity Analysis (2026): Bedroom Distribution
Distribution of Listings by Number of Bedrooms
Room Capacity Insights for Frequente
- The dominant room capacity in Frequente is 1 bedroom listings, making up 54.8% of the market. This suggests a strong demand for properties suitable for couples or solo travelers.
- Together, 1 bedroom and 3 bedrooms properties represent 74.2% of the active Airbnb listings in Frequente, indicating a high concentration in these sizes.
- With over half the market (54.8%) consisting of studios or 1-bedroom units, Frequente is particularly well-suited for individuals or couples.
- A significant 22.6% of listings offer 3+ bedrooms, catering to larger groups and families seeking more space in Frequente.
Frequente Vacation Rental Guest Capacity Trends (2026)
Distribution of Listings by Guest Capacity
Guest Capacity Insights for Frequente
- The most common guest capacity trend in Frequente vacation rentals is listings accommodating 2 guests (58.1%). This suggests the primary traveler segment is likely couples or solo travelers.
- Properties designed for 2 guests and 4 guests dominate the Frequente STR market, accounting for 83.9% of listings.
- A significant 58.1% of listings cater specifically to 1-2 guests, highlighting strong demand from couples and solo travelers in Frequente.
- On average, properties in Frequente are equipped to host 3.2 guests.
Frequente Airbnb Booking Patterns (2026): Available vs. Booked Days
Available Days Distribution
Booked Days Distribution
Booking Pattern Insights for Frequente
- The most common availability pattern in Frequente falls within the 271-366 days range, representing 64.5% of listings. This suggests many properties have significant open periods on their calendars.
- Approximately 80.6% of listings show high availability (181+ days open annually), indicating potential for increased bookings or specific owner usage patterns.
- For booked days, the 31-90 days range is most frequent in Frequente (38.7%), reflecting common guest stay durations or potential owner blocking patterns.
- A notable 19.4% of properties secure long booking periods (181+ days booked per year), highlighting successful long-term rental strategies or significant owner usage.
Frequente Airbnb Minimum Stay Requirements Analysis
Distribution of Listings by Minimum Night Requirement
1 Night
13 listings
41.9% of total
2 Nights
3 listings
9.7% of total
3 Nights
5 listings
16.1% of total
4-6 Nights
3 listings
9.7% of total
30+ Nights
7 listings
22.6% of total
Key Insights
- The most prevalent minimum stay requirement in Frequente is 1 Night, adopted by 41.9% of listings. This highlights the market's preference for shorter, flexible bookings.
- A significant segment (22.6%) caters to monthly stays (30+ nights) in Frequente, pointing to opportunities in the extended-stay market.
Recommendations
- Align with the market by considering a 1 Night minimum stay, as 41.9% of Frequente hosts use this setting.
- Explore offering discounts for stays of 30+ nights to attract the 22.6% of the market seeking extended stays.
- Adjust minimum nights based on seasonality – potentially shorter during low season and longer during peak demand periods in Frequente.
Frequente Airbnb Cancellation Policy Trends Analysis (2026)
Limited
1 listings
3.2% of total
Flexible
17 listings
54.8% of total
Moderate
6 listings
19.4% of total
Firm
7 listings
22.6% of total
Cancellation Policy Insights for Frequente
- The prevailing Airbnb cancellation policy trend in Frequente is Flexible, used by 54.8% of listings.
- The market strongly favors guest-friendly terms, with 74.2% of listings offering Flexible or Moderate policies. This suggests guests in Frequente may expect booking flexibility.
Recommendations for Hosts
- Consider adopting a Flexible policy to align with the 54.8% market standard in Frequente.
- Given the high prevalence of Flexible policies (54.8%), offering this can enhance booking appeal, especially during shoulder seasons.
- Regularly review your cancellation policy against competitors and market demand shifts in Frequente.
Frequente STR Booking Lead Time Analysis (2026)
Average Booking Lead Time by Month
Booking Lead Time Insights for Frequente
- The overall average booking lead time for vacation rentals in Frequente is 63 days.
- Guests book furthest in advance for stays during August (average 129 days), likely coinciding with peak travel demand or local events.
- The shortest booking windows occur for stays in June (average 24 days), indicating more last-minute travel plans during this time.
- Seasonally, Summer (71 days avg.) sees the longest lead times, while Fall (35 days avg.) has the shortest, reflecting typical travel planning cycles.
Recommendations for Hosts
- Use the overall average lead time (63 days) as a baseline for your pricing and availability strategy in Frequente.
- For August stays, consider implementing length-of-stay discounts or slightly higher rates for bookings made less than 129 days out to capitalize on advance planning.
- Target marketing efforts for the Summer season well in advance (at least 71 days) to capture early planners.
- Monitor your own booking lead times against these Frequente averages to identify opportunities for dynamic pricing adjustments.
Popular & Essential Airbnb Amenities in Frequente (2026)
Amenity Prevalence
Amenity Insights for Frequente
- Essential amenities in Frequente that guests expect include: Wifi, Free parking on premises, Air conditioning, Kitchen. Lacking these (any) could significantly impact bookings.
- Popular amenities like Washer, Refrigerator, TV are common but not universal. Offering these can provide a competitive edge.
Recommendations for Hosts
- Ensure your listing includes all essential amenities for Frequente: Wifi, Free parking on premises, Air conditioning, Kitchen.
- Prioritize adding missing essentials: Free parking on premises, Air conditioning, Kitchen.
- Consider adding popular differentiators like Washer or Refrigerator to increase appeal.
- Highlight unique or less common amenities you offer (e.g., hot tub, dedicated workspace, EV charger) in your listing description and photos.
- Regularly check competitor amenities in Frequente to stay competitive.
Frequente Airbnb Guest Demographics & Profile Analysis (2026)
Guest Profile Summary for Frequente
- The typical guest profile for Airbnb in Frequente consists of predominantly international visitors (99%), with top international origins including United Kingdom, typically belonging to the Post-2000s (Gen Z/Alpha) group (50%), primarily speaking English or Spanish.
- Domestic travelers account for 1.4% of guests.
- Key international markets include United States (58.9%) and United Kingdom (11%).
- Top languages spoken are English (69.1%) followed by Spanish (9.1%).
- A significant demographic segment is the Post-2000s (Gen Z/Alpha) group, representing 50% of guests.
Recommendations for Hosts
- Focus marketing internationally, particularly towards travelers from United Kingdom.
- Tailor amenities and listing descriptions to appeal to the dominant Post-2000s (Gen Z/Alpha) demographic (e.g., highlight fast WiFi, smart home features, local guides).
- Highlight unique local experiences or amenities relevant to the primary guest profile.
- Consider seasonal promotions aligned with peak travel times for key origin markets.
Nearby Short-Term Rental Market Comparison
How does the Frequente Airbnb market stack up against its neighbors? Compare key performance metrics like average monthly revenue, ADR, and occupancy rates in surrounding areas to understand the broader regional STR landscape.
| Market | Active Properties | Monthly Revenue | Daily Rate | Avg. Occupancy |
|---|---|---|---|---|
| Westerhall Point | 10 | $4,431 | $483.83 | 38% |
| Belvedere | 13 | $3,156 | $238.08 | 52% |
| Soufrière | 121 | $2,909 | $261.54 | 44% |
| Coolie Town | 99 | $2,812 | $330.98 | 37% |
| Piaye | 17 | $2,761 | $208.00 | 41% |
| Mount Irvine | 14 | $2,573 | $322.13 | 36% |
| Buccoo | 102 | $1,916 | $213.50 | 34% |
| Scarborough | 154 | $1,807 | $248.32 | 29% |
| Old Grange | 21 | $1,798 | $261.29 | 32% |
| Crown Point | 187 | $1,727 | $186.93 | 34% |