Tornabe Airbnb Market Analysis 2026: Short Term Rental Data & Vacation Rental Statistics in Atlántida, Honduras
Is Airbnb profitable in Tornabe in 2026? Explore comprehensive Airbnb analytics for Tornabe, Atlántida, Honduras to uncover income potential. This 2026 STR market report for Tornabe, based on AirROI data from February 2025 to January 2026, reveals key trends in the niche market of 26 active listings.
Whether you're considering an Airbnb investment in Tornabe, optimizing your existing vacation rental, or exploring rental arbitrage opportunities, understanding the Tornabe Airbnb data is crucial. Leveraging the low regulation environment is key to maximizing your short term rental income potential. Let's dive into the specifics.
Key Tornabe Airbnb Performance Metrics Overview
Monthly Airbnb Revenue Variations & Income Potential in Tornabe (2026)
Understanding the monthly revenue variations for Airbnb listings in Tornabe is key to maximizing your short term rental income potential. Seasonality significantly impacts earnings. Our analysis, based on data from the past 12 months, shows that the peak revenue month for STRs in Tornabe is typically April, while February often presents the lowest earnings, highlighting opportunities for strategic pricing adjustments during shoulder and low seasons. Explore the typical Airbnb income in Tornabe across different performance tiers:
- Best-in-class properties (Top 10%) achieve $4,516+ monthly, often utilizing dynamic pricing and superior guest experiences.
- Strong performing properties (Top 25%) earn $2,564 or more, indicating effective management and desirable locations/amenities.
- Typical properties (Median) generate around $1,254 per month, representing the average market performance.
- Entry-level properties (Bottom 25%) see earnings around $651, often with potential for optimization.
Average Monthly Airbnb Earnings Trend in Tornabe
Tornabe Airbnb Occupancy Rate Trends (2026)
Maximize your bookings by understanding the Tornabe STR occupancy trends. Seasonal demand shifts significantly influence how often properties are booked. Typically, Aprilsees the highest demand (peak season occupancy), while January experiences the lowest (low season). Effective strategies, like adjusting minimum stays or offering promotions, can boost occupancy during slower periods. Here's how different property tiers perform in Tornabe:
- Best-in-class properties (Top 10%) achieve 40%+ occupancy, indicating high desirability and potentially optimized availability.
- Strong performing properties (Top 25%) maintain 28% or higher occupancy, suggesting good market fit and guest satisfaction.
- Typical properties (Median) have an occupancy rate around 17%.
- Entry-level properties (Bottom 25%) average 10% occupancy, potentially facing higher vacancy.
Average Monthly Occupancy Rate Trend in Tornabe
Average Daily Rate (ADR) Airbnb Trends in Tornabe (2026)
Effective short term rental pricing strategy in Tornabe involves understanding monthly ADR fluctuations. The Average Daily Rate (ADR) for Airbnb in Tornabe typically peaks in April and dips lowest during November. Leveraging Airbnb dynamic pricing tools or strategies based on this seasonality can significantly boost revenue. Here's a look at the typical nightly rates achieved:
- Best-in-class properties (Top 10%) command rates of $469+ per night, often due to premium features or locations.
- Strong performing properties (Top 25%) achieve nightly rates of $334 or more.
- Typical properties (Median) charge around $238 per night.
- Entry-level properties (Bottom 25%) earn around $179 per night.
Average Daily Rate (ADR) Trend by Month in Tornabe
Get Live Tornabe Market Intelligence 👇

Explore Real-time Analytics
Airbnb Seasonality Analysis & Trends in Tornabe (2026)
Peak Season (April, July, August)
- Revenue averages $2,535 per month
- Occupancy rates average 28.5%
- Daily rates average $278
Shoulder Season
- Revenue averages $1,864 per month
- Occupancy maintains around 19.8%
- Daily rates hold near $276
Low Season (January, February, November)
- Revenue drops to average $1,267 per month
- Occupancy decreases to average 15.2%
- Daily rates adjust to average $273
Seasonality Insights for Tornabe
- The Airbnb seasonality in Tornabe shows highly seasonal trends requiring careful strategy. While the sections above show seasonal averages, it's also insightful to look at the extremes:
- During the high season, the absolute peak month showcases Tornabe's highest earning potential, with monthly revenues capable of climbing to $2,896, occupancy reaching a high of 31.5%, and ADRs peaking at $285.
- Conversely, the slowest single month of the year, typically falling within the low season, marks the market's lowest point. In this month, revenue might dip to $1,138, occupancy could drop to 14.3%, and ADRs may adjust down to $264.
- Understanding both the seasonal averages and these monthly peaks and troughs in revenue, occupancy, and ADR is crucial for maximizing your Airbnb profit potential in Tornabe.
Seasonal Strategies for Maximizing Profit
- Peak Season: Maximize revenue through premium pricing and potentially longer minimum stays. Ensure high availability.
- Low Season: Offer competitive pricing, special promotions (e.g., extended stay discounts), and flexible cancellation policies. Target off-season travelers like remote workers or budget-conscious guests.
- Shoulder Seasons: Implement dynamic pricing that balances peak and low rates. Target weekend travelers or specific events. Offer slightly more flexible terms than peak season.
- Regularly analyze your own performance against these Tornabe seasonality benchmarks and adjust your pricing and availability strategy accordingly.
Best Areas for Airbnb Investment in Tornabe (2026)
Exploring the top neighborhoods for short-term rentals in Tornabe? This section highlights key areas, outlining why they are attractive for hosts and guests, along with notable local attractions. Consider these locations based on your target guest profile and investment strategy.
| Neighborhood / Area | Why Host Here? (Target Guests & Appeal) | Key Attractions & Landmarks |
|---|---|---|
| La Ceiba | A vibrant coastal city known for its beaches, tourism, and ecological parks. Popular among travelers for its proximity to the Bay Islands and natural beauty. | Cayos Cochinos, La Ceiba Waterfront, Cangrejal River, Pico Bonito National Park, Central Market |
| Tegucigalpa | The capital city of Honduras offers a variety of cultural experiences and historical sites, making it a key destination for business and tourism. | National Identity Museum, La Tigra National Park, Central Cathedral, Los Proceres Memorial, Cerro Juarez |
| Utila | Known for its diving spots and laid-back atmosphere, Utila attracts backpackers and tourists looking for water activities and an island experience. | Shark Diving, Utila Cays, Chepes Beach, Tree-Nature Park, Pumpkin Hill |
| Roatan | A popular tourist destination known for its stunning beaches and diving locations. Roatan has a thriving tourism industry and offers excellent rental opportunities. | West Bay Beach, Gumbalimba Park, Roatan Institute of Marine Sciences, Carambola Botanical Gardens, Little French Key |
| Copán Ruinas | Famous for the Mayan ruins and rich history, Copán attracts many tourists interested in archaeology and cultural heritage. | Copán Archaeological Site, Macaw Mountain Bird Park, Santa Rosa de Copán, The Octagonal Plaza, Los Sapos |
| Santa Rosa de Copán | A charming town known for its coffee, cultural sites, and proximity to historical ruins, appealing to tourists interested in local culture. | Café de Specialidad, Santa Rosa Cathedral, Arco de Santa Rosa, Pueblo de Santa Rosa, Nuestras Raíces |
| La Esperanza | A quiet mountain town with a mix of indigenous culture and natural beauty, catering to eco-tourism and those seeking tranquility. | Parque Nacional La Esperanza, Indigenous Communities, Coffee Plantations, Natural Springs, Local Markets |
| Jutiapa | A lesser-known destination with beautiful landscapes and outdoor activities, offering tourists a glimpse into rural Honduran life. | Local Rivers, Hiking Trails, Cultural Festivals, Scenic Views, Wildlife Watching |
Understanding Airbnb License Requirements & STR Laws in Tornabe (2026)
While Tornabe, Atlántida, Honduras currently shows low STR regulations, specific Airbnb license requirements might still exist or change. Always verify the latest short term rental regulations and Airbnb license requirements directly with local government authorities for Tornabe to ensure full compliance before hosting.
(Source: AirROI data, 2026, finding no licensed listings among those analyzed)
Top Performing Airbnb Properties in Tornabe (2026)
Benchmark your potential! Explore examples of top-performing Airbnb properties in Tornabebased on Trailing Twelve Month (TTM) revenue. Analyze their characteristics, revenue, occupancy rate, and ADR to understand what drives success in this market.
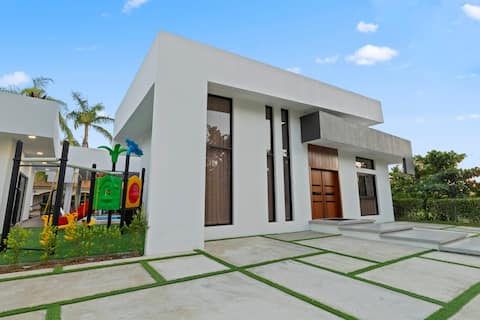
+14Tela Luxury Beach House Private Pool Playground
Entire Place • 5 bedrooms
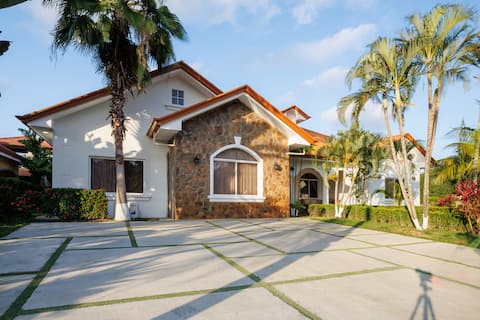
+25 Beach House Tela with Private Pool and Games
Entire Place • 5 bedrooms

Villa Valentina
Entire Place • 8 bedrooms

Casa Mariposa - 4BR w/ Private Pool & pool table
Entire Place • 4 bedrooms

Laguna Castle with Private Dock 8 bedrooms
Entire Place • 8 bedrooms

Casa playa Tela
Entire Place • 4 bedrooms
Note: Performance varies based on location, size, amenities, seasonality, and management quality. Data reflects the past 12 months.
Top Performing Airbnb Hosts in Tornabe (2026)
Learn from the best! This table showcases top-performing Airbnb hosts in Tornabe based on the number of properties managed and estimated total revenue over the past year. Analyze their scale and performance metrics.
| Host Name | Properties | Grossing Revenue | Stay Reviews | Avg Rating |
|---|---|---|---|---|
| Gloria | 3 | $112,283 | 255 | 4.86/5.0 |
| Charlotte | 2 | $58,965 | 141 | 4.84/5.0 |
| Marlene | 3 | $52,227 | 281 | 4.75/5.0 |
| Deisy | 1 | $46,854 | 25 | 4.88/5.0 |
| Inmobiliaria Jacarí | 2 | $30,828 | 56 | 4.71/5.0 |
| Eli | 1 | $25,806 | 97 | 4.62/5.0 |
| Jose | 1 | $24,838 | 48 | 4.77/5.0 |
| Kelly | 1 | $18,797 | 51 | 4.69/5.0 |
| Juan Antonio | 1 | $16,103 | 6 | 4.83/5.0 |
| Victoria | 1 | $11,863 | 70 | 4.43/5.0 |
Analyzing the strategies of top hosts, such as their property selection, pricing, and guest communication, can offer valuable lessons for optimizing your own Airbnb operations in Tornabe.
Dive Deeper: Advanced Tornabe STR Market Data (2026)
Ready to unlock more insights? AirROI provides access to advanced metrics and comprehensive Airbnb data for Tornabe. Explore detailed analytics beyond this report to refine your investment strategy, optimize pricing, and maximize your vacation rental profits.
Explore Advanced MetricsTornabe Short-Term Rental Market Composition (2026): Property & Room Types
Room Type Distribution
Property Type Distribution
Market Composition Insights for Tornabe
- The Tornabe Airbnb market composition is heavily skewed towards Entire Home/Apt listings, which make up 96.2% of the 26 active rentals. This indicates strong guest preference for privacy and space.
- Looking at the property type distribution in Tornabe, House properties are the most common (80.8%), reflecting the local real estate landscape.
- Houses represent a significant 80.8% portion, catering likely to families or larger groups.
Tornabe Airbnb Room Capacity Analysis (2026): Bedroom Distribution
Distribution of Listings by Number of Bedrooms
Room Capacity Insights for Tornabe
- The dominant room capacity in Tornabe is 3 bedrooms listings, making up 26.9% of the market. This suggests a strong demand for properties suitable for families or small groups.
- Together, 3 bedrooms and 2 bedrooms properties represent 46.1% of the active Airbnb listings in Tornabe, indicating a high concentration in these sizes.
- A significant 65.3% of listings offer 3+ bedrooms, catering to larger groups and families seeking more space in Tornabe.
Tornabe Vacation Rental Guest Capacity Trends (2026)
Distribution of Listings by Guest Capacity
Guest Capacity Insights for Tornabe
- The most common guest capacity trend in Tornabe vacation rentals is listings accommodating 8+ guests (73.1%). This suggests the primary traveler segment is likely larger groups.
- Properties designed for 8+ guests and 6 guests dominate the Tornabe STR market, accounting for 84.6% of listings.
- 84.6% of properties accommodate 6+ guests, serving the market segment for larger families or group travel in Tornabe.
- On average, properties in Tornabe are equipped to host 7.0 guests.
Tornabe Airbnb Booking Patterns (2026): Available vs. Booked Days
Available Days Distribution
Booked Days Distribution
Booking Pattern Insights for Tornabe
- The most common availability pattern in Tornabe falls within the 271-366 days range, representing 88.5% of listings. This suggests many properties have significant open periods on their calendars.
- Approximately 100.0% of listings show high availability (181+ days open annually), indicating potential for increased bookings or specific owner usage patterns.
- For booked days, the 31-90 days range is most frequent in Tornabe (61.5%), reflecting common guest stay durations or potential owner blocking patterns.
Tornabe Airbnb Minimum Stay Requirements Analysis
Distribution of Listings by Minimum Night Requirement
1 Night
10 listings
38.5% of total
2 Nights
9 listings
34.6% of total
3 Nights
1 listings
3.8% of total
30+ Nights
6 listings
23.1% of total
Key Insights
- The most prevalent minimum stay requirement in Tornabe is 1 Night, adopted by 38.5% of listings. This highlights the market's preference for shorter, flexible bookings.
- A strong majority (73.1%) of the Tornabe Airbnb data shows acceptance of very short stays (1-2 nights), indicating a dynamic, high-turnover market.
- A significant segment (23.1%) caters to monthly stays (30+ nights) in Tornabe, pointing to opportunities in the extended-stay market.
Recommendations
- Align with the market by considering a 1 Night minimum stay, as 38.5% of Tornabe hosts use this setting.
- Explore offering discounts for stays of 30+ nights to attract the 23.1% of the market seeking extended stays.
- Adjust minimum nights based on seasonality – potentially shorter during low season and longer during peak demand periods in Tornabe.
Tornabe Airbnb Cancellation Policy Trends Analysis (2026)
Flexible
8 listings
30.8% of total
Moderate
11 listings
42.3% of total
Firm
4 listings
15.4% of total
Strict
3 listings
11.5% of total
Cancellation Policy Insights for Tornabe
- The prevailing Airbnb cancellation policy trend in Tornabe is Moderate, used by 42.3% of listings.
- The market strongly favors guest-friendly terms, with 73.1% of listings offering Flexible or Moderate policies. This suggests guests in Tornabe may expect booking flexibility.
Recommendations for Hosts
- Consider adopting a Moderate policy to align with the 42.3% market standard in Tornabe.
- Using a Strict policy might deter some guests, as only 11.5% of listings use it. Evaluate if potential revenue protection outweighs possible lower booking rates.
- Regularly review your cancellation policy against competitors and market demand shifts in Tornabe.
Tornabe STR Booking Lead Time Analysis (2026)
Average Booking Lead Time by Month
Booking Lead Time Insights for Tornabe
- The overall average booking lead time for vacation rentals in Tornabe is 27 days.
- Guests book furthest in advance for stays during April (average 59 days), likely coinciding with peak travel demand or local events.
- The shortest booking windows occur for stays in February (average 13 days), indicating more last-minute travel plans during this time.
- Seasonally, Spring (36 days avg.) sees the longest lead times, while Winter (17 days avg.) has the shortest, reflecting typical travel planning cycles.
Recommendations for Hosts
- Use the overall average lead time (27 days) as a baseline for your pricing and availability strategy in Tornabe.
- For April stays, consider implementing length-of-stay discounts or slightly higher rates for bookings made less than 59 days out to capitalize on advance planning.
- During February, focus on last-minute booking availability and promotions, as guests book with very short notice (13 days avg.).
- Target marketing efforts for the Spring season well in advance (at least 36 days) to capture early planners.
- Monitor your own booking lead times against these Tornabe averages to identify opportunities for dynamic pricing adjustments.
Popular & Essential Airbnb Amenities in Tornabe (2026)
Amenity Prevalence
Amenity Insights for Tornabe
- Essential amenities in Tornabe that guests expect include: Air conditioning, Kitchen. Lacking these (any) could significantly impact bookings.
- Popular amenities like Free parking on premises, TV, Wifi are common but not universal. Offering these can provide a competitive edge.
- A pool is a highly desired but not standard amenity, making it a key feature for attracting guests seeking leisure in Tornabe.
- Warning: Wifi is not universally provided but is considered essential globally. Ensure reliable Wifi is offered.
Recommendations for Hosts
- Ensure your listing includes all essential amenities for Tornabe: Air conditioning, Kitchen.
- Prioritize adding missing essentials: Kitchen.
- Consider adding popular differentiators like Free parking on premises or TV to increase appeal.
- Highlight unique or less common amenities you offer (e.g., hot tub, dedicated workspace, EV charger) in your listing description and photos.
- Regularly check competitor amenities in Tornabe to stay competitive.
Tornabe Airbnb Guest Demographics & Profile Analysis (2026)
Guest Profile Summary for Tornabe
- The typical guest profile for Airbnb in Tornabe consists of primarily domestic travelers (71%), often arriving from nearby Tegucigalpa, typically belonging to the Post-2000s (Gen Z/Alpha) group (50%), primarily speaking Spanish or English.
- Domestic travelers account for 71.0% of guests.
- Key international markets include Honduras (71%) and United States (27.4%).
- Top languages spoken are Spanish (57.7%) followed by English (36.6%).
- A significant demographic segment is the Post-2000s (Gen Z/Alpha) group, representing 50% of guests.
Recommendations for Hosts
- Target domestic marketing efforts towards travelers from Tegucigalpa and San Pedro Sula.
- Tailor amenities and listing descriptions to appeal to the dominant Post-2000s (Gen Z/Alpha) demographic (e.g., highlight fast WiFi, smart home features, local guides).
- Highlight unique local experiences or amenities relevant to the primary guest profile.
- Consider seasonal promotions aligned with peak travel times for key origin markets.
Nearby Short-Term Rental Market Comparison
How does the Tornabe Airbnb market stack up against its neighbors? Compare key performance metrics like average monthly revenue, ADR, and occupancy rates in surrounding areas to understand the broader regional STR landscape.
| Market | Active Properties | Monthly Revenue | Daily Rate | Avg. Occupancy |
|---|---|---|---|---|
| Maya Beach | 76 | $4,346 | $421.40 | 38% |
| Seine Bight | 26 | $3,700 | $413.82 | 38% |
| Caribbean Way | 26 | $3,083 | $361.55 | 37% |
| Hopkins Village | 67 | $2,814 | $300.89 | 35% |
| Aldea de San Juan | 27 | $2,404 | $364.33 | 26% |
| Placencia | 297 | $2,167 | $296.42 | 34% |
| West Bay | 42 | $2,130 | $374.23 | 31% |
| Roatán | 799 | $1,554 | $230.07 | 33% |
| Hopkins | 90 | $1,547 | $193.17 | 33% |
| Triunfo de la Cruz | 22 | $1,426 | $277.04 | 21% |