Balatonboglár Airbnb Market Analysis 2026: Short Term Rental Data & Vacation Rental Statistics in Transdanubia, Hungary
Is Airbnb profitable in Balatonboglár in 2026? Explore comprehensive Airbnb analytics for Balatonboglár, Transdanubia, Hungary to uncover income potential. This 2026 STR market report for Balatonboglár, based on AirROI data from February 2025 to January 2026, reveals key trends in the niche market of 49 active listings.
Whether you're considering an Airbnb investment in Balatonboglár, optimizing your existing vacation rental, or exploring rental arbitrage opportunities, understanding the Balatonboglár Airbnb data is crucial. Navigating the high regulation landscape is key to maximizing your short term rental income potential. Let's dive into the specifics.
Key Balatonboglár Airbnb Performance Metrics Overview
Monthly Airbnb Revenue Variations & Income Potential in Balatonboglár (2026)
Understanding the monthly revenue variations for Airbnb listings in Balatonboglár is key to maximizing your short term rental income potential. Seasonality significantly impacts earnings. Our analysis, based on data from the past 12 months, shows that the peak revenue month for STRs in Balatonboglár is typically July, while December often presents the lowest earnings, highlighting opportunities for strategic pricing adjustments during shoulder and low seasons. Explore the typical Airbnb income in Balatonboglár across different performance tiers:
- Best-in-class properties (Top 10%) achieve $2,518+ monthly, often utilizing dynamic pricing and superior guest experiences.
- Strong performing properties (Top 25%) earn $1,637 or more, indicating effective management and desirable locations/amenities.
- Typical properties (Median) generate around $874 per month, representing the average market performance.
- Entry-level properties (Bottom 25%) see earnings around $395, often with potential for optimization.
Average Monthly Airbnb Earnings Trend in Balatonboglár
Balatonboglár Airbnb Occupancy Rate Trends (2026)
Maximize your bookings by understanding the Balatonboglár STR occupancy trends. Seasonal demand shifts significantly influence how often properties are booked. Typically, Julysees the highest demand (peak season occupancy), while December experiences the lowest (low season). Effective strategies, like adjusting minimum stays or offering promotions, can boost occupancy during slower periods. Here's how different property tiers perform in Balatonboglár:
- Best-in-class properties (Top 10%) achieve 52%+ occupancy, indicating high desirability and potentially optimized availability.
- Strong performing properties (Top 25%) maintain 37% or higher occupancy, suggesting good market fit and guest satisfaction.
- Typical properties (Median) have an occupancy rate around 24%.
- Entry-level properties (Bottom 25%) average 11% occupancy, potentially facing higher vacancy.
Average Monthly Occupancy Rate Trend in Balatonboglár
Average Daily Rate (ADR) Airbnb Trends in Balatonboglár (2026)
Effective short term rental pricing strategy in Balatonboglár involves understanding monthly ADR fluctuations. The Average Daily Rate (ADR) for Airbnb in Balatonboglár typically peaks in August and dips lowest during February. Leveraging Airbnb dynamic pricing tools or strategies based on this seasonality can significantly boost revenue. Here's a look at the typical nightly rates achieved:
- Best-in-class properties (Top 10%) command rates of $259+ per night, often due to premium features or locations.
- Strong performing properties (Top 25%) achieve nightly rates of $187 or more.
- Typical properties (Median) charge around $128 per night.
- Entry-level properties (Bottom 25%) earn around $90 per night.
Average Daily Rate (ADR) Trend by Month in Balatonboglár
Get Live Balatonboglár Market Intelligence 👇

Explore Real-time Analytics
Airbnb Seasonality Analysis & Trends in Balatonboglár (2026)
Peak Season (July, August, June)
- Revenue averages $2,103 per month
- Occupancy rates average 46.0%
- Daily rates average $157
Shoulder Season
- Revenue averages $1,038 per month
- Occupancy maintains around 23.2%
- Daily rates hold near $146
Low Season (February, November, December)
- Revenue drops to average $531 per month
- Occupancy decreases to average 14.8%
- Daily rates adjust to average $144
Seasonality Insights for Balatonboglár
- The Airbnb seasonality in Balatonboglár shows highly seasonal trends requiring careful strategy. While the sections above show seasonal averages, it's also insightful to look at the extremes:
- During the high season, the absolute peak month showcases Balatonboglár's highest earning potential, with monthly revenues capable of climbing to $2,596, occupancy reaching a high of 55.4%, and ADRs peaking at $159.
- Conversely, the slowest single month of the year, typically falling within the low season, marks the market's lowest point. In this month, revenue might dip to $342, occupancy could drop to 7.8%, and ADRs may adjust down to $133.
- Understanding both the seasonal averages and these monthly peaks and troughs in revenue, occupancy, and ADR is crucial for maximizing your Airbnb profit potential in Balatonboglár.
Seasonal Strategies for Maximizing Profit
- Peak Season: Maximize revenue through premium pricing and potentially longer minimum stays. Ensure high availability.
- Low Season: Offer competitive pricing, special promotions (e.g., extended stay discounts), and flexible cancellation policies. Target off-season travelers like remote workers or budget-conscious guests.
- Shoulder Seasons: Implement dynamic pricing that balances peak and low rates. Target weekend travelers or specific events. Offer slightly more flexible terms than peak season.
- Regularly analyze your own performance against these Balatonboglár seasonality benchmarks and adjust your pricing and availability strategy accordingly.
Best Areas for Airbnb Investment in Balatonboglár (2026)
Exploring the top neighborhoods for short-term rentals in Balatonboglár? This section highlights key areas, outlining why they are attractive for hosts and guests, along with notable local attractions. Consider these locations based on your target guest profile and investment strategy.
| Neighborhood / Area | Why Host Here? (Target Guests & Appeal) | Key Attractions & Landmarks |
|---|---|---|
| Kis-Balaton | A serene nature reserve offering opportunities for eco-tourism and bird watching. This region attracts nature lovers and families looking to enjoy quiet weekends away from city life. | Kis-Balaton Visitor Center, Birdwatching Lookouts, Lake Balaton, Bicycle Trails, Nature Walking Paths |
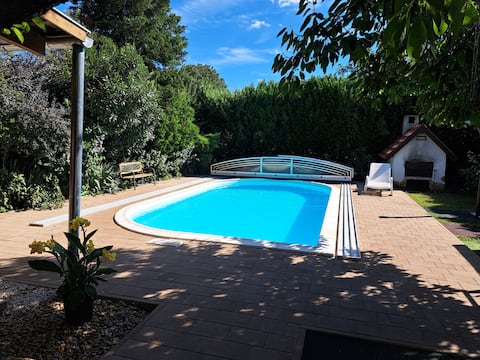
| Balatonboglár Beach | A picturesque location known for its family-friendly beaches and vibrant summer atmosphere. Ideal for tourists looking for water activities and relaxation by the lake. | Main Beach, Balatonboglár Wine Festival, Sailing and Water Sports, Local Restaurants, Parks |
| Balatonlelle Waterfront | A bustling area with a lively promenade, perfect for those wanting entertainment and social interactions. It's a great spot for families and young travelers alike. | Balatonlelle Beach, Promenade, Boat Rentals, Dining Shops, Events and Concerts |
| Balatonföldvár Harbor | A charming harbor town with a variety of boating activities. It's appealing to those interested in sailing and water sports while enjoying scenic views. | Sailing Schools, Yacht Rental, Waterfront Restaurants, Local Market, Historic Buildings |
| Tihany Peninsula | Known for its stunning views and cultural heritage, Tihany attracts visitors interested in hiking and exploring historical sites, providing unique Airbnb experiences. | Tihany Abbey, Lavender Fields, Hiking Trails, Scenic Lookouts, Local Artisans |
| Siófok | Often referred to as the 'capital' of Lake Balaton, Siófok features a vibrant nightlife, making it attractive for partygoers and young pairs looking for excitement. | Beach Clubs, Nightlife Venues, Siófok Water Park, Cultural Festivals, Historic Main Square |
| Keszthely | Home to beautiful parks and historical sites, this town is favored by tourists interested in culture and exploration, providing a rich experience during stays. | Festetics Palace, Helikon Park, Museum of Balaton, Local Cafés, Boat Tours |
| Fonyód | A peaceful small town that offers a relaxing environment by the lake, perfect for families seeking a slower pace and connection to nature. | Fonyód Beach, Walking Trails, Family-friendly Parks, Scenic Picnic Areas, Fishing Spots |
Understanding Airbnb License Requirements & STR Laws in Balatonboglár (2026)
Yes, Balatonboglár, Transdanubia, Hungary enforces high STR regulations. Obtaining a license and ensuring compliance is almost certainly required according to current 2026 STR laws. Always verify the latest short term rental regulations and Airbnb license requirements directly with local government authorities for Balatonboglár to ensure full compliance before hosting.
(Source: AirROI data, 2026, based on 80% licensed listings)
Top Performing Airbnb Properties in Balatonboglár (2026)
Benchmark your potential! Explore examples of top-performing Airbnb properties in Balatonboglárbased on Trailing Twelve Month (TTM) revenue. Analyze their characteristics, revenue, occupancy rate, and ADR to understand what drives success in this market.
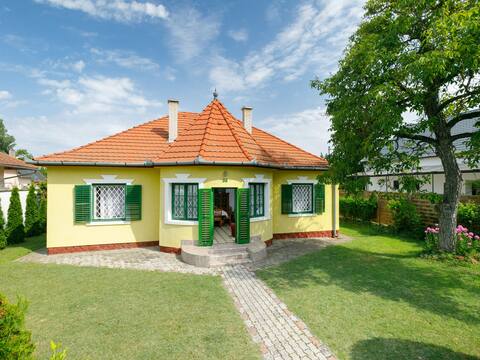
Borostyán Guesthouse Balatonboglár
Entire Place • 5 bedrooms

Charming Holiday Home with Pool & Garden
Entire Place • 4 bedrooms
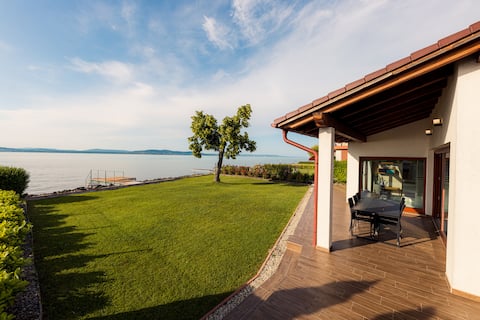
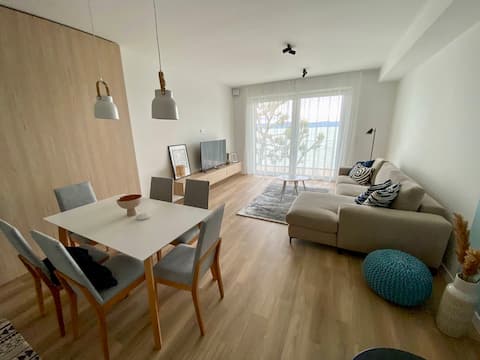
Balaton View Apartment
Entire Place • 3 bedrooms
Platan Garden Beach 101
Entire Place • 3 bedrooms
Stella by Interhome
Entire Place • 4 bedrooms

Lupo by Interhome
Entire Place • 2 bedrooms
Note: Performance varies based on location, size, amenities, seasonality, and management quality. Data reflects the past 12 months.
Top Performing Airbnb Hosts in Balatonboglár (2026)
Learn from the best! This table showcases top-performing Airbnb hosts in Balatonboglár based on the number of properties managed and estimated total revenue over the past year. Analyze their scale and performance metrics.
| Host Name | Properties | Grossing Revenue | Stay Reviews | Avg Rating |
|---|---|---|---|---|
| Tibor - Interhome | 6 | $40,461 | 12 | 4.21/5.0 |
| Viktória | 4 | $35,261 | 295 | 4.98/5.0 |
| Vajda | 1 | $34,812 | 11 | 5.00/5.0 |
| Vali | 1 | $20,981 | 133 | 4.92/5.0 |
| Tamás | 2 | $20,564 | 11 | 4.83/5.0 |
| Éva & Péter | 3 | $20,152 | 207 | 4.88/5.0 |
| Bltn | 4 | $19,492 | 9 | 4.75/5.0 |
| Firtos | 1 | $19,102 | 17 | 4.71/5.0 |
| Domán | 1 | $17,669 | 1 | Not Rated |
| English | 1 | $14,187 | 2 | Not Rated |
Analyzing the strategies of top hosts, such as their property selection, pricing, and guest communication, can offer valuable lessons for optimizing your own Airbnb operations in Balatonboglár.
Dive Deeper: Advanced Balatonboglár STR Market Data (2026)
Ready to unlock more insights? AirROI provides access to advanced metrics and comprehensive Airbnb data for Balatonboglár. Explore detailed analytics beyond this report to refine your investment strategy, optimize pricing, and maximize your vacation rental profits.
Explore Advanced MetricsBalatonboglár Short-Term Rental Market Composition (2026): Property & Room Types
Room Type Distribution
Property Type Distribution
Market Composition Insights for Balatonboglár
- The Balatonboglár Airbnb market composition is heavily skewed towards Entire Home/Apt listings, which make up 93.9% of the 49 active rentals. This indicates strong guest preference for privacy and space.
- Looking at the property type distribution in Balatonboglár, Apartment/Condo properties are the most common (53.1%), reflecting the local real estate landscape.
- Houses represent a significant 44.9% portion, catering likely to families or larger groups.
- Smaller segments like hotel/boutique (combined 2.0%) offer potential for unique stay experiences.
Balatonboglár Airbnb Room Capacity Analysis (2026): Bedroom Distribution
Distribution of Listings by Number of Bedrooms
Room Capacity Insights for Balatonboglár
- The dominant room capacity in Balatonboglár is 2 bedrooms listings, making up 36.7% of the market. This suggests a strong demand for properties suitable for couples or solo travelers.
- Together, 2 bedrooms and 3 bedrooms properties represent 61.2% of the active Airbnb listings in Balatonboglár, indicating a high concentration in these sizes.
- A significant 38.8% of listings offer 3+ bedrooms, catering to larger groups and families seeking more space in Balatonboglár.
Balatonboglár Vacation Rental Guest Capacity Trends (2026)
Distribution of Listings by Guest Capacity
Guest Capacity Insights for Balatonboglár
- The most common guest capacity trend in Balatonboglár vacation rentals is listings accommodating 5 guests (22.4%). This suggests the primary traveler segment is likely larger groups.
- Properties designed for 5 guests and 8+ guests dominate the Balatonboglár STR market, accounting for 44.8% of listings.
- 46.9% of properties accommodate 6+ guests, serving the market segment for larger families or group travel in Balatonboglár.
- On average, properties in Balatonboglár are equipped to host 5.1 guests.
Balatonboglár Airbnb Booking Patterns (2026): Available vs. Booked Days
Available Days Distribution
Booked Days Distribution
Booking Pattern Insights for Balatonboglár
- The most common availability pattern in Balatonboglár falls within the 271-366 days range, representing 83.7% of listings. This suggests many properties have significant open periods on their calendars.
- Approximately 100.0% of listings show high availability (181+ days open annually), indicating potential for increased bookings or specific owner usage patterns.
- For booked days, the 31-90 days range is most frequent in Balatonboglár (53.1%), reflecting common guest stay durations or potential owner blocking patterns.
Balatonboglár Airbnb Minimum Stay Requirements Analysis
Distribution of Listings by Minimum Night Requirement
1 Night
8 listings
16.3% of total
2 Nights
3 listings
6.1% of total
3 Nights
1 listings
2% of total
4-6 Nights
9 listings
18.4% of total
30+ Nights
28 listings
57.1% of total
Key Insights
- The most prevalent minimum stay requirement in Balatonboglár is 30+ Nights, adopted by 57.1% of listings. This highlights the market's preference for longer commitments.
- A significant segment (57.1%) caters to monthly stays (30+ nights) in Balatonboglár, pointing to opportunities in the extended-stay market.
Recommendations
- Align with the market by considering a 30+ Nights minimum stay, as 57.1% of Balatonboglár hosts use this setting.
- If feasible, allowing 1-night stays, especially midweek or during low season, could capture last-minute bookings, as only 16.3% currently do.
- Explore offering discounts for stays of 30+ nights to attract the 57.1% of the market seeking extended stays.
- Adjust minimum nights based on seasonality – potentially shorter during low season and longer during peak demand periods in Balatonboglár.
Balatonboglár Airbnb Cancellation Policy Trends Analysis (2026)
Flexible
6 listings
12.2% of total
Moderate
9 listings
18.4% of total
Firm
32 listings
65.3% of total
Strict
2 listings
4.1% of total
Cancellation Policy Insights for Balatonboglár
- The prevailing Airbnb cancellation policy trend in Balatonboglár is Firm, used by 65.3% of listings.
- A majority (69.4%) of hosts in Balatonboglár utilize Firm or Strict policies, indicating a market where hosts prioritize booking security.
- Strict cancellation policies are quite rare (4.1%), potentially making listings with this policy less competitive unless justified by high demand or property type.
Recommendations for Hosts
- Consider adopting a Firm policy to align with the 65.3% market standard in Balatonboglár.
- Using a Strict policy might deter some guests, as only 4.1% of listings use it. Evaluate if potential revenue protection outweighs possible lower booking rates.
- Regularly review your cancellation policy against competitors and market demand shifts in Balatonboglár.
Balatonboglár STR Booking Lead Time Analysis (2026)
Average Booking Lead Time by Month
Booking Lead Time Insights for Balatonboglár
- The overall average booking lead time for vacation rentals in Balatonboglár is 60 days.
- Guests book furthest in advance for stays during November (average 144 days), likely coinciding with peak travel demand or local events.
- The shortest booking windows occur for stays in January (average 11 days), indicating more last-minute travel plans during this time.
- Seasonally, Fall (76 days avg.) sees the longest lead times, while Winter (23 days avg.) has the shortest, reflecting typical travel planning cycles.
Recommendations for Hosts
- Use the overall average lead time (60 days) as a baseline for your pricing and availability strategy in Balatonboglár.
- For November stays, consider implementing length-of-stay discounts or slightly higher rates for bookings made less than 144 days out to capitalize on advance planning.
- During January, focus on last-minute booking availability and promotions, as guests book with very short notice (11 days avg.).
- Target marketing efforts for the Fall season well in advance (at least 76 days) to capture early planners.
- Monitor your own booking lead times against these Balatonboglár averages to identify opportunities for dynamic pricing adjustments.
Popular & Essential Airbnb Amenities in Balatonboglár (2026)
Amenity Prevalence
Amenity Insights for Balatonboglár
- Essential amenities in Balatonboglár that guests expect include: TV, Kitchen. Lacking these (any) could significantly impact bookings.
- Popular amenities like Wifi, Free parking on premises, Dishes and silverware are common but not universal. Offering these can provide a competitive edge.
- Warning: Wifi is not universally provided but is considered essential globally. Ensure reliable Wifi is offered.
Recommendations for Hosts
- Ensure your listing includes all essential amenities for Balatonboglár: TV, Kitchen.
- Prioritize adding missing essentials: Kitchen.
- Consider adding popular differentiators like Wifi or Free parking on premises to increase appeal.
- Highlight unique or less common amenities you offer (e.g., hot tub, dedicated workspace, EV charger) in your listing description and photos.
- Regularly check competitor amenities in Balatonboglár to stay competitive.
Balatonboglár Airbnb Guest Demographics & Profile Analysis (2026)
Guest Profile Summary for Balatonboglár
- The typical guest profile for Airbnb in Balatonboglár consists of predominantly international visitors (66%), with top international origins including Germany, typically belonging to the Post-2000s (Gen Z/Alpha) group (50%), primarily speaking English or German.
- Domestic travelers account for 34.3% of guests.
- Key international markets include Hungary (34.3%) and Germany (12.9%).
- Top languages spoken are English (38.1%) followed by German (20.6%).
- A significant demographic segment is the Post-2000s (Gen Z/Alpha) group, representing 50% of guests.
Recommendations for Hosts
- Focus marketing internationally, particularly towards travelers from Germany.
- Tailor amenities and listing descriptions to appeal to the dominant Post-2000s (Gen Z/Alpha) demographic (e.g., highlight fast WiFi, smart home features, local guides).
- Highlight unique local experiences or amenities relevant to the primary guest profile.
- Consider seasonal promotions aligned with peak travel times for key origin markets.
Nearby Short-Term Rental Market Comparison
How does the Balatonboglár Airbnb market stack up against its neighbors? Compare key performance metrics like average monthly revenue, ADR, and occupancy rates in surrounding areas to understand the broader regional STR landscape.
| Market | Active Properties | Monthly Revenue | Daily Rate | Avg. Occupancy |
|---|---|---|---|---|
| Balatonakarattya | 24 | $2,500 | $374.96 | 34% |
| Paloznak | 11 | $1,827 | $271.04 | 44% |
| Općina Gornji Kneginec | 10 | $1,799 | $378.91 | 32% |
| Neusiedl am See | 25 | $1,605 | $267.10 | 36% |
| Bad Waltersdorf | 15 | $1,598 | $174.77 | 35% |
| Balatonszepezd | 25 | $1,585 | $161.72 | 46% |
| Zebegény | 22 | $1,578 | $149.21 | 41% |
| Balatonakali | 18 | $1,553 | $201.67 | 28% |
| Nagymaros | 49 | $1,485 | $128.57 | 44% |
| Lendava / Lendva | 12 | $1,456 | $193.21 | 30% |