Ábrahámhegy Airbnb Market Analysis 2026: Short Term Rental Data & Vacation Rental Statistics in Transdanubia, Hungary
Is Airbnb profitable in Ábrahámhegy in 2026? Explore comprehensive Airbnb analytics for Ábrahámhegy, Transdanubia, Hungary to uncover income potential. This 2026 STR market report for Ábrahámhegy, based on AirROI data from February 2025 to January 2026, reveals key trends in the niche market of 21 active listings.
Whether you're considering an Airbnb investment in Ábrahámhegy, optimizing your existing vacation rental, or exploring rental arbitrage opportunities, understanding the Ábrahámhegy Airbnb data is crucial. Navigating the high regulation landscape is key to maximizing your short term rental income potential. Let's dive into the specifics.
Key Ábrahámhegy Airbnb Performance Metrics Overview
Monthly Airbnb Revenue Variations & Income Potential in Ábrahámhegy (2026)
Understanding the monthly revenue variations for Airbnb listings in Ábrahámhegy is key to maximizing your short term rental income potential. Seasonality significantly impacts earnings. Our analysis, based on data from the past 12 months, shows that the peak revenue month for STRs in Ábrahámhegy is typically July, while November often presents the lowest earnings, highlighting opportunities for strategic pricing adjustments during shoulder and low seasons. Explore the typical Airbnb income in Ábrahámhegy across different performance tiers:
- Best-in-class properties (Top 10%) achieve $5,908+ monthly, often utilizing dynamic pricing and superior guest experiences.
- Strong performing properties (Top 25%) earn $2,494 or more, indicating effective management and desirable locations/amenities.
- Typical properties (Median) generate around $1,351 per month, representing the average market performance.
- Entry-level properties (Bottom 25%) see earnings around $690, often with potential for optimization.
Average Monthly Airbnb Earnings Trend in Ábrahámhegy
Ábrahámhegy Airbnb Occupancy Rate Trends (2026)
Maximize your bookings by understanding the Ábrahámhegy STR occupancy trends. Seasonal demand shifts significantly influence how often properties are booked. Typically, Augustsees the highest demand (peak season occupancy), while November experiences the lowest (low season). Effective strategies, like adjusting minimum stays or offering promotions, can boost occupancy during slower periods. Here's how different property tiers perform in Ábrahámhegy:
- Best-in-class properties (Top 10%) achieve 62%+ occupancy, indicating high desirability and potentially optimized availability.
- Strong performing properties (Top 25%) maintain 39% or higher occupancy, suggesting good market fit and guest satisfaction.
- Typical properties (Median) have an occupancy rate around 25%.
- Entry-level properties (Bottom 25%) average 16% occupancy, potentially facing higher vacancy.
Average Monthly Occupancy Rate Trend in Ábrahámhegy
Average Daily Rate (ADR) Airbnb Trends in Ábrahámhegy (2026)
Effective short term rental pricing strategy in Ábrahámhegy involves understanding monthly ADR fluctuations. The Average Daily Rate (ADR) for Airbnb in Ábrahámhegy typically peaks in August and dips lowest during October. Leveraging Airbnb dynamic pricing tools or strategies based on this seasonality can significantly boost revenue. Here's a look at the typical nightly rates achieved:
- Best-in-class properties (Top 10%) command rates of $356+ per night, often due to premium features or locations.
- Strong performing properties (Top 25%) achieve nightly rates of $271 or more.
- Typical properties (Median) charge around $137 per night.
- Entry-level properties (Bottom 25%) earn around $97 per night.
Average Daily Rate (ADR) Trend by Month in Ábrahámhegy
Get Live Ábrahámhegy Market Intelligence 👇

Explore Real-time Analytics
Airbnb Seasonality Analysis & Trends in Ábrahámhegy (2026)
Peak Season (July, August, May)
- Revenue averages $4,209 per month
- Occupancy rates average 57.5%
- Daily rates average $208
Shoulder Season
- Revenue averages $1,847 per month
- Occupancy maintains around 24.8%
- Daily rates hold near $194
Low Season (January, October, November)
- Revenue drops to average $713 per month
- Occupancy decreases to average 15.3%
- Daily rates adjust to average $189
Seasonality Insights for Ábrahámhegy
- The Airbnb seasonality in Ábrahámhegy shows highly seasonal trends requiring careful strategy. While the sections above show seasonal averages, it's also insightful to look at the extremes:
- During the high season, the absolute peak month showcases Ábrahámhegy's highest earning potential, with monthly revenues capable of climbing to $4,693, occupancy reaching a high of 68.9%, and ADRs peaking at $213.
- Conversely, the slowest single month of the year, typically falling within the low season, marks the market's lowest point. In this month, revenue might dip to $474, occupancy could drop to 11.1%, and ADRs may adjust down to $187.
- Understanding both the seasonal averages and these monthly peaks and troughs in revenue, occupancy, and ADR is crucial for maximizing your Airbnb profit potential in Ábrahámhegy.
Seasonal Strategies for Maximizing Profit
- Peak Season: Maximize revenue through premium pricing and potentially longer minimum stays. Ensure high availability.
- Low Season: Offer competitive pricing, special promotions (e.g., extended stay discounts), and flexible cancellation policies. Target off-season travelers like remote workers or budget-conscious guests.
- Shoulder Seasons: Implement dynamic pricing that balances peak and low rates. Target weekend travelers or specific events. Offer slightly more flexible terms than peak season.
- Regularly analyze your own performance against these Ábrahámhegy seasonality benchmarks and adjust your pricing and availability strategy accordingly.
Best Areas for Airbnb Investment in Ábrahámhegy (2026)
Exploring the top neighborhoods for short-term rentals in Ábrahámhegy? This section highlights key areas, outlining why they are attractive for hosts and guests, along with notable local attractions. Consider these locations based on your target guest profile and investment strategy.
| Neighborhood / Area | Why Host Here? (Target Guests & Appeal) | Key Attractions & Landmarks |
|---|---|---|
| Balaton Lake Shore | A picturesque area known for its scenic views, water activities, and charming village atmosphere. Ideal for tourists looking to relax by the lake and enjoy nature. | Lake Balaton, Badacsony Wine Region, Balaton Uplands National Park, Tihany Abbey, Fonyód Beach, Keszthely Castle |
| Zamárdi | Famous for its beaches and lively summer atmosphere, Zamárdi attracts families and young people who enjoy outdoor activities and festivals throughout the summer. | Zamárdi Beach, Festival Area, Balaton Sound Festival, Fisherman's Bastion, Family Park Zamárdi, Wine Cellars |
| Siófok | A vibrant town on the southern shore of Lake Balaton, Siófok is known for its nightlife, sandy beaches, and historical attractions, making it popular among tourists. | Siófok Beach, Siófok Water Park, Jókai Park, Kálmán Imre Memorial House, Siófok Lighthouse, Bars and Nightclubs |
| Tihany | A unique peninsula with stunning views and cultural heritage. Tihany is known for its lavender fields and historic abbey, attracting visitors interested in culture and nature. | Tihany Abbey, Lavender Fields, Tihany Marina, Inner Lake, Tihany Open-Air Museum, Biking Trails |
| Keszthely | A charming town with rich history and beautiful architecture, ideal for tourists who enjoy culture, museums, and leisurely walks along the waterfront. | Festetics Palace, Helikon Park, Keszthely Castle Museum, Balaton Museum, Zala Springs Golf Resort, Lakefront Promenade |
| Balatonföldvár | A lovely resort town known for its beaches and quiet atmosphere, perfect for families and couples looking for a peaceful getaway. | Balatonföldvár Beach, Port of Balatonföldvár, National Blue Trail, Cycling paths, Local Restaurants, Scenic Views |
| Fonyód | A family-friendly destination with sandy beaches and recreational activities, Fonyód is great for those looking to enjoy water sports and leisure activities by Lake Balaton. | Fonyód Beach, Fonyód Lookout Tower, Recreational Marina, Local Markets, Bicycle Rental Stations, Fonyód Castle Ruins |
| Csopak | Known for its wine production and lovely lake views, Csopak attracts visitors interested in gastronomy and relaxation, perfect for a tranquil stay near the Balaton. | Csopak Beach, Local Wineries, Wine Cellar Tours, Cycling along the shore, Csopak Promenade, Balaton Wine Festival |
Understanding Airbnb License Requirements & STR Laws in Ábrahámhegy (2026)
Yes, Ábrahámhegy, Transdanubia, Hungary enforces high STR regulations. Obtaining a license and ensuring compliance is almost certainly required according to current 2026 STR laws. Always verify the latest short term rental regulations and Airbnb license requirements directly with local government authorities for Ábrahámhegy to ensure full compliance before hosting.
(Source: AirROI data, 2026, based on 76% licensed listings)
Top Performing Airbnb Properties in Ábrahámhegy (2026)
Benchmark your potential! Explore examples of top-performing Airbnb properties in Ábrahámhegybased on Trailing Twelve Month (TTM) revenue. Analyze their characteristics, revenue, occupancy rate, and ADR to understand what drives success in this market.
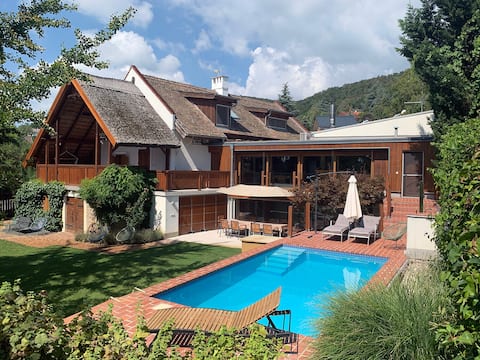
ÁbraHome: Elegant lake hideaway
Entire Place • 4 bedrooms

House on the shore of Lake Balaton, with pier
Entire Place • 3 bedrooms
Lovely house on the hill by Balaton up to 10 prsn!
Entire Place • 4 bedrooms
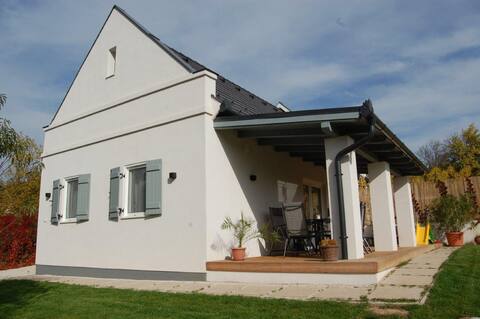
Big space and nice atmosphere
Entire Place • 3 bedrooms
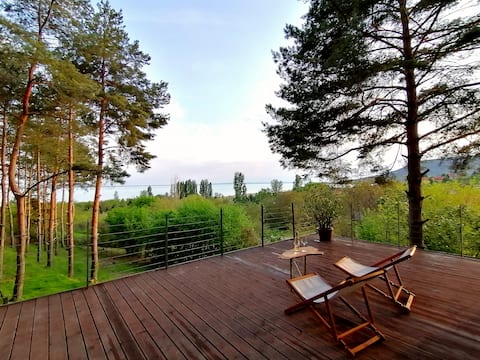
Árahámhegy - Home at the gate of the Balaton Uplands
Entire Place • 3 bedrooms
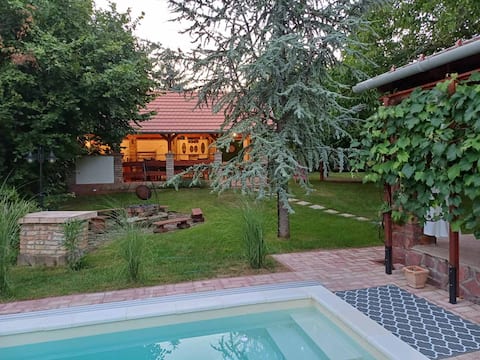
Árahámhegy Cottage
Entire Place • 2 bedrooms
Note: Performance varies based on location, size, amenities, seasonality, and management quality. Data reflects the past 12 months.
Top Performing Airbnb Hosts in Ábrahámhegy (2026)
Learn from the best! This table showcases top-performing Airbnb hosts in Ábrahámhegy based on the number of properties managed and estimated total revenue over the past year. Analyze their scale and performance metrics.
| Host Name | Properties | Grossing Revenue | Stay Reviews | Avg Rating |
|---|---|---|---|---|
| Judit Csilla | 1 | $74,802 | 37 | 4.95/5.0 |
| Anikó | 1 | $40,393 | 28 | 4.96/5.0 |
| Eszter | 1 | $37,148 | 34 | 4.97/5.0 |
| Kulcsár | 1 | $36,974 | 17 | 4.65/5.0 |
| Maike - Interhome | 3 | $20,029 | 12 | 4.40/5.0 |
| Ágnes | 1 | $19,083 | 12 | 5.00/5.0 |
| Genoveva | 1 | $16,414 | 24 | 4.92/5.0 |
| Emma | 1 | $13,786 | 10 | 4.70/5.0 |
| Tamás | 1 | $13,364 | 8 | 4.88/5.0 |
| Opus Utazási Iroda | 3 | $12,634 | 16 | 4.56/5.0 |
Analyzing the strategies of top hosts, such as their property selection, pricing, and guest communication, can offer valuable lessons for optimizing your own Airbnb operations in Ábrahámhegy.
Dive Deeper: Advanced Ábrahámhegy STR Market Data (2026)
Ready to unlock more insights? AirROI provides access to advanced metrics and comprehensive Airbnb data for Ábrahámhegy. Explore detailed analytics beyond this report to refine your investment strategy, optimize pricing, and maximize your vacation rental profits.
Explore Advanced MetricsÁbrahámhegy Short-Term Rental Market Composition (2026): Property & Room Types
Room Type Distribution
Property Type Distribution
Market Composition Insights for Ábrahámhegy
- The Ábrahámhegy Airbnb market composition is heavily skewed towards Entire Home/Apt listings, which make up 95.2% of the 21 active rentals. This indicates strong guest preference for privacy and space.
- Looking at the property type distribution in Ábrahámhegy, House properties are the most common (95.2%), reflecting the local real estate landscape.
- Houses represent a significant 95.2% portion, catering likely to families or larger groups.
- Smaller segments like others (combined 4.8%) offer potential for unique stay experiences.
Ábrahámhegy Airbnb Room Capacity Analysis (2026): Bedroom Distribution
Distribution of Listings by Number of Bedrooms
Room Capacity Insights for Ábrahámhegy
- The dominant room capacity in Ábrahámhegy is 3 bedrooms listings, making up 38.1% of the market. This suggests a strong demand for properties suitable for families or small groups.
- Together, 3 bedrooms and 2 bedrooms properties represent 76.2% of the active Airbnb listings in Ábrahámhegy, indicating a high concentration in these sizes.
- A significant 57.2% of listings offer 3+ bedrooms, catering to larger groups and families seeking more space in Ábrahámhegy.
Ábrahámhegy Vacation Rental Guest Capacity Trends (2026)
Distribution of Listings by Guest Capacity
Guest Capacity Insights for Ábrahámhegy
- The most common guest capacity trend in Ábrahámhegy vacation rentals is listings accommodating 6 guests (33.3%). This suggests the primary traveler segment is likely larger groups.
- Properties designed for 6 guests and 8+ guests dominate the Ábrahámhegy STR market, accounting for 57.1% of listings.
- 61.9% of properties accommodate 6+ guests, serving the market segment for larger families or group travel in Ábrahámhegy.
- On average, properties in Ábrahámhegy are equipped to host 5.7 guests.
Ábrahámhegy Airbnb Booking Patterns (2026): Available vs. Booked Days
Available Days Distribution
Booked Days Distribution
Booking Pattern Insights for Ábrahámhegy
- The most common availability pattern in Ábrahámhegy falls within the 271-366 days range, representing 76.2% of listings. This suggests many properties have significant open periods on their calendars.
- Approximately 100.0% of listings show high availability (181+ days open annually), indicating potential for increased bookings or specific owner usage patterns.
- For booked days, the 31-90 days range is most frequent in Ábrahámhegy (57.1%), reflecting common guest stay durations or potential owner blocking patterns.
Ábrahámhegy Airbnb Minimum Stay Requirements Analysis
Distribution of Listings by Minimum Night Requirement
1 Night
2 listings
9.5% of total
2 Nights
3 listings
14.3% of total
3 Nights
2 listings
9.5% of total
4-6 Nights
4 listings
19% of total
30+ Nights
10 listings
47.6% of total
Key Insights
- The most prevalent minimum stay requirement in Ábrahámhegy is 30+ Nights, adopted by 47.6% of listings. This highlights the market's preference for longer commitments.
- A significant segment (47.6%) caters to monthly stays (30+ nights) in Ábrahámhegy, pointing to opportunities in the extended-stay market.
Recommendations
- Align with the market by considering a 30+ Nights minimum stay, as 47.6% of Ábrahámhegy hosts use this setting.
- If feasible, allowing 1-night stays, especially midweek or during low season, could capture last-minute bookings, as only 9.5% currently do.
- Explore offering discounts for stays of 30+ nights to attract the 47.6% of the market seeking extended stays.
- Adjust minimum nights based on seasonality – potentially shorter during low season and longer during peak demand periods in Ábrahámhegy.
Ábrahámhegy Airbnb Cancellation Policy Trends Analysis (2026)
Flexible
1 listings
4.8% of total
Moderate
5 listings
23.8% of total
Firm
12 listings
57.1% of total
Strict
3 listings
14.3% of total
Cancellation Policy Insights for Ábrahámhegy
- The prevailing Airbnb cancellation policy trend in Ábrahámhegy is Firm, used by 57.1% of listings.
- A majority (71.4%) of hosts in Ábrahámhegy utilize Firm or Strict policies, indicating a market where hosts prioritize booking security.
Recommendations for Hosts
- Consider adopting a Firm policy to align with the 57.1% market standard in Ábrahámhegy.
- Using a Strict policy might deter some guests, as only 14.3% of listings use it. Evaluate if potential revenue protection outweighs possible lower booking rates.
- Regularly review your cancellation policy against competitors and market demand shifts in Ábrahámhegy.
Ábrahámhegy STR Booking Lead Time Analysis (2026)
Average Booking Lead Time by Month
Booking Lead Time Insights for Ábrahámhegy
- The overall average booking lead time for vacation rentals in Ábrahámhegy is 79 days.
- Guests book furthest in advance for stays during November (average 219 days), likely coinciding with peak travel demand or local events.
- The shortest booking windows occur for stays in January (average 14 days), indicating more last-minute travel plans during this time.
- Seasonally, Fall (109 days avg.) sees the longest lead times, while Winter (43 days avg.) has the shortest, reflecting typical travel planning cycles.
Recommendations for Hosts
- Use the overall average lead time (79 days) as a baseline for your pricing and availability strategy in Ábrahámhegy.
- For November stays, consider implementing length-of-stay discounts or slightly higher rates for bookings made less than 219 days out to capitalize on advance planning.
- During January, focus on last-minute booking availability and promotions, as guests book with very short notice (14 days avg.).
- Target marketing efforts for the Fall season well in advance (at least 109 days) to capture early planners.
- Monitor your own booking lead times against these Ábrahámhegy averages to identify opportunities for dynamic pricing adjustments.
Popular & Essential Airbnb Amenities in �Ábrahámhegy (2026)
Amenity Prevalence
Amenity Insights for Ábrahámhegy
- Essential amenities in Ábrahámhegy that guests expect include: Kitchen. Lacking these (this) could significantly impact bookings.
- Popular amenities like Wifi, BBQ grill, Refrigerator are common but not universal. Offering these can provide a competitive edge.
- Warning: Wifi is not universally provided but is considered essential globally. Ensure reliable Wifi is offered.
Recommendations for Hosts
- Ensure your listing includes all essential amenities for Ábrahámhegy: Kitchen.
- Prioritize adding missing essentials: Kitchen.
- Consider adding popular differentiators like Wifi or BBQ grill to increase appeal.
- Highlight unique or less common amenities you offer (e.g., hot tub, dedicated workspace, EV charger) in your listing description and photos.
- Regularly check competitor amenities in Ábrahámhegy to stay competitive.
Ábrahámhegy Airbnb Guest Demographics & Profile Analysis (2026)
Guest Profile Summary for Ábrahámhegy
- The typical guest profile for Airbnb in Ábrahámhegy consists of predominantly international visitors (79%), with top international origins including Germany, typically belonging to the Post-2000s (Gen Z/Alpha) group (50%), primarily speaking English or Hungarian.
- Domestic travelers account for 21.1% of guests.
- Key international markets include Hungary (21.1%) and Germany (10.5%).
- Top languages spoken are English (35.6%) followed by Hungarian (15.3%).
- A significant demographic segment is the Post-2000s (Gen Z/Alpha) group, representing 50% of guests.
Recommendations for Hosts
- Focus marketing internationally, particularly towards travelers from Germany.
- Tailor amenities and listing descriptions to appeal to the dominant Post-2000s (Gen Z/Alpha) demographic (e.g., highlight fast WiFi, smart home features, local guides).
- Highlight unique local experiences or amenities relevant to the primary guest profile.
- Consider seasonal promotions aligned with peak travel times for key origin markets.
Nearby Short-Term Rental Market Comparison
How does the Ábrahámhegy Airbnb market stack up against its neighbors? Compare key performance metrics like average monthly revenue, ADR, and occupancy rates in surrounding areas to understand the broader regional STR landscape.
| Market | Active Properties | Monthly Revenue | Daily Rate | Avg. Occupancy |
|---|---|---|---|---|
| Balatonakarattya | 24 | $2,500 | $374.96 | 34% |
| Paloznak | 11 | $1,827 | $271.04 | 44% |
| Općina Gornji Kneginec | 10 | $1,799 | $378.91 | 32% |
| Neusiedl am See | 25 | $1,605 | $267.10 | 36% |
| Bad Waltersdorf | 15 | $1,598 | $174.77 | 35% |
| Balatonszepezd | 25 | $1,585 | $161.72 | 46% |
| Zebegény | 22 | $1,578 | $149.21 | 41% |
| Balatonakali | 18 | $1,553 | $201.67 | 28% |
| Nagymaros | 49 | $1,485 | $128.57 | 44% |
| Lendava / Lendva | 12 | $1,456 | $193.21 | 30% |