Árnessýslu Airbnb Market Analysis 2026: Short Term Rental Data & Vacation Rental Statistics in Árnessýslu, Iceland
Is Airbnb profitable in Árnessýslu in 2026? Explore comprehensive Airbnb analytics for Árnessýslu, Árnessýslu, Iceland to uncover income potential. This 2026 STR market report for Árnessýslu, based on AirROI data from May 2024 to April 2025, reveals key trends in the niche market of 17 active listings.
Whether you're considering an Airbnb investment in Árnessýslu, optimizing your existing vacation rental, or exploring rental arbitrage opportunities, understanding the Árnessýslu Airbnb data is crucial. Understanding the local regulations is key to maximizing your short term rental income potential. Let's dive into the specifics.
Key Árnessýslu Airbnb Performance Metrics Overview
Monthly Airbnb Revenue Variations & Income Potential in Árnessýslu (2026)
Understanding the monthly revenue variations for Airbnb listings in Árnessýslu is key to maximizing your short term rental income potential. Seasonality significantly impacts earnings. Our analysis, based on data from the past 12 months, shows that the peak revenue month for STRs in Árnessýslu is typically July, while January often presents the lowest earnings, highlighting opportunities for strategic pricing adjustments during shoulder and low seasons. Explore the typical Airbnb income in Árnessýslu across different performance tiers:
- Best-in-class properties (Top 10%) achieve $6,248+ monthly, often utilizing dynamic pricing and superior guest experiences.
- Strong performing properties (Top 25%) earn $4,479 or more, indicating effective management and desirable locations/amenities.
- Typical properties (Median) generate around $2,517 per month, representing the average market performance.
- Entry-level properties (Bottom 25%) see earnings around $1,434, often with potential for optimization.
Average Monthly Airbnb Earnings Trend in Árnessýslu
Árnessýslu Airbnb Occupancy Rate Trends (2026)
Maximize your bookings by understanding the Árnessýslu STR occupancy trends. Seasonal demand shifts significantly influence how often properties are booked. Typically, Julysees the highest demand (peak season occupancy), while January experiences the lowest (low season). Effective strategies, like adjusting minimum stays or offering promotions, can boost occupancy during slower periods. Here's how different property tiers perform in Árnessýslu:
- Best-in-class properties (Top 10%) achieve 71%+ occupancy, indicating high desirability and potentially optimized availability.
- Strong performing properties (Top 25%) maintain 54% or higher occupancy, suggesting good market fit and guest satisfaction.
- Typical properties (Median) have an occupancy rate around 38%.
- Entry-level properties (Bottom 25%) average 21% occupancy, potentially facing higher vacancy.
Average Monthly Occupancy Rate Trend in Árnessýslu
Average Daily Rate (ADR) Airbnb Trends in Árnessýslu (2026)
Effective short term rental pricing strategy in Árnessýslu involves understanding monthly ADR fluctuations. The Average Daily Rate (ADR) for Airbnb in Árnessýslu typically peaks in August and dips lowest during November. Leveraging Airbnb dynamic pricing tools or strategies based on this seasonality can significantly boost revenue. Here's a look at the typical nightly rates achieved:
- Best-in-class properties (Top 10%) command rates of $456+ per night, often due to premium features or locations.
- Strong performing properties (Top 25%) achieve nightly rates of $288 or more.
- Typical properties (Median) charge around $225 per night.
- Entry-level properties (Bottom 25%) earn around $178 per night.
Average Daily Rate (ADR) Trend by Month in Árnessýslu
Get Live Árnessýslu Market Intelligence 👇
Explore Real-time Analytics
Airbnb Seasonality Analysis & Trends in Árnessýslu (2025)
Peak Season (July, August, October)
- Revenue averages $4,937 per month
- Occupancy rates average 57.7%
- Daily rates average $270
Shoulder Season
- Revenue averages $2,888 per month
- Occupancy maintains around 38.5%
- Daily rates hold near $246
Low Season (January, February, April)
- Revenue drops to average $1,686 per month
- Occupancy decreases to average 27.3%
- Daily rates adjust to average $235
Seasonality Insights for Árnessýslu
- The Airbnb seasonality in Árnessýslu shows highly seasonal trends requiring careful strategy. While the sections above show seasonal averages, it's also insightful to look at the extremes:
- During the high season, the absolute peak month showcases Árnessýslu's highest earning potential, with monthly revenues capable of climbing to $5,818, occupancy reaching a high of 63.9%, and ADRs peaking at $290.
- Conversely, the slowest single month of the year, typically falling within the low season, marks the market's lowest point. In this month, revenue might dip to $996, occupancy could drop to 13.9%, and ADRs may adjust down to $221.
- Understanding both the seasonal averages and these monthly peaks and troughs in revenue, occupancy, and ADR is crucial for maximizing your Airbnb profit potential in Árnessýslu.
Seasonal Strategies for Maximizing Profit
- Peak Season: Maximize revenue through premium pricing and potentially longer minimum stays. Ensure high availability.
- Low Season: Offer competitive pricing, special promotions (e.g., extended stay discounts), and flexible cancellation policies. Target off-season travelers like remote workers or budget-conscious guests.
- Shoulder Seasons: Implement dynamic pricing that balances peak and low rates. Target weekend travelers or specific events. Offer slightly more flexible terms than peak season.
- Regularly analyze your own performance against these Árnessýslu seasonality benchmarks and adjust your pricing and availability strategy accordingly.
Best Areas for Airbnb Investment in Árnessýslu (2026)
Exploring the top neighborhoods for short-term rentals in Árnessýslu? This section highlights key areas, outlining why they are attractive for hosts and guests, along with notable local attractions. Consider these locations based on your target guest profile and investment strategy.
| Neighborhood / Area | Why Host Here? (Target Guests & Appeal) | Key Attractions & Landmarks |
|---|---|---|
| Þingvellir National Park | A UNESCO World Heritage site known for its stunning natural beauty and geological significance. This area attracts tourists interested in history, nature, and outdoor activities. | Silfra Fissure, Lakes and waterfalls, Almannagjá Gorge, Hiking trails, Visitor Center |
| Gulfoss | One of Iceland's most iconic waterfalls, drawing visitors for its breathtaking views. A great location for Airbnb due to its proximity to natural attractions. | Gulfoss waterfall, Gullfoss Café, Golden Circle tours, Hiking paths |
| Geysir | Home to the famous Strokkur geyser, which erupts every few minutes. A center for geothermal activity and a popular tourism spot. | Strokkur Geyser, Geysir geothermal area, Visitor Center, Nearby hot springs |
| Haukadalur Valley | A picturesque valley known for its geothermal features and close to other main attractions of the Golden Circle. Ideal for nature enthusiasts and travelers. | Geysir hot springs, Natural hot springs, Hiking trails, Stunning landscapes |
| Selfoss | A charming town located near many attractions, making it a convenient base for travelers exploring South Iceland. Offers local Icelandic culture and amenities. | Selfoss town center, Lilja Grand, Selfoss Church, Hiking along the Ölfusá River |
| Reykjadalur | Famous for its hot river, it attracts those looking for relaxing geothermal baths in nature. A fantastic spot for Airbnb hosting for nature lovers. | Hot river baths, Hiking trails, Stunning valley views, Nearby geothermal areas |
| Kerid Crater | A unique volcanic crater lake that draws visitors for its striking colors and scenic views. A wonderful spot to experience Iceland's geology and natural beauty. | Kerid Crater lake, Hiking around the crater, Beautiful photo opportunities, Local flora and fauna |
| Skálholt | Historically significant as a cultural and religious center in Iceland, attracting visitors interested in Icelandic history and architecture. A peaceful location for Airbnb. | Skálholt Cathedral, Historic site exhibitions, Cultural events, Nearby hiking trails |
Understanding Airbnb License Requirements & STR Laws in Árnessýslu (2026)
With 24% of listings showing registration in 2026, understanding potential Airbnb license requirements is crucial in Árnessýslu. Always verify the latest short term rental regulations and Airbnb license requirements directly with local government authorities for Árnessýslu to ensure full compliance before hosting.
(Source: AirROI data, 2026, based on 24% licensed listings)
Top Performing Airbnb Properties in Árnessýslu (2026)
Benchmark your potential! Explore examples of top-performing Airbnb properties in Árnessýslubased on Trailing Twelve Month (TTM) revenue. Analyze their characteristics, revenue, occupancy rate, and ADR to understand what drives success in this market.

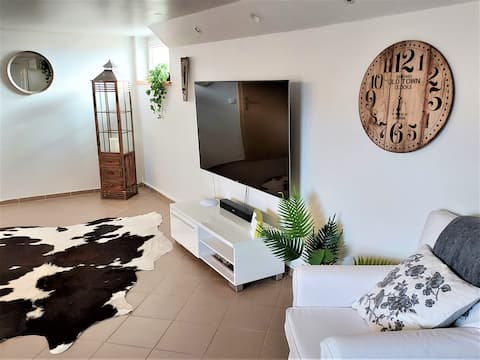
Apartment for 6 person with terrace and lake view
Entire Place • 3 bedrooms
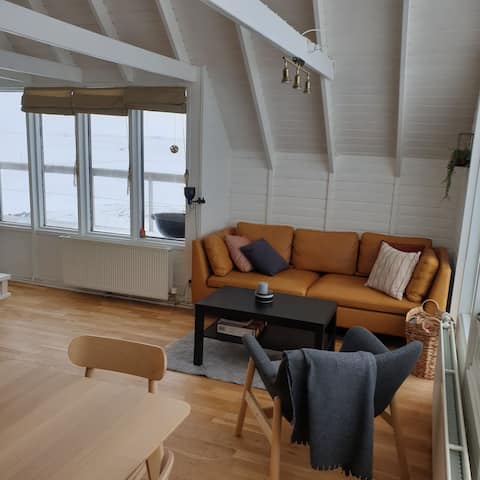
Cosy house with 3 bedrooms and kitchen
Entire Place • 3 bedrooms
Árheimar 4 cosy holiday home
Entire Place • 3 bedrooms

Árheimar 6 cosy holiday home
Entire Place • 2 bedrooms

Family room for 4 persons with private bathroom
Private Room • 1 bedroom

The Wee Cosy House.
Entire Place • 1 bedroom
Note: Performance varies based on location, size, amenities, seasonality, and management quality. Data reflects the past 12 months.
Top Performing Airbnb Hosts in Árnessýslu (2026)
Learn from the best! This table showcases top-performing Airbnb hosts in Árnessýslu based on the number of properties managed and estimated total revenue over the past year. Analyze their scale and performance metrics.
| Host Name | Properties | Grossing Revenue | Stay Reviews | Avg Rating |
|---|---|---|---|---|
| Margrét | 9 | $305,571 | 895 | 4.74/5.0 |
| Louise | 4 | $174,781 | 1423 | 4.94/5.0 |
| Ernir Skorri | 2 | $41,781 | 398 | 4.96/5.0 |
| Eydís Rós | 2 | $40,434 | 626 | 4.84/5.0 |
Analyzing the strategies of top hosts, such as their property selection, pricing, and guest communication, can offer valuable lessons for optimizing your own Airbnb operations in Árnessýslu.
Dive Deeper: Advanced Árnessýslu STR Market Data (2026)
Ready to unlock more insights? AirROI provides access to advanced metrics and comprehensive Airbnb data for Árnessýslu. Explore detailed analytics beyond this report to refine your investment strategy, optimize pricing, and maximize your vacation rental profits.
Explore Advanced MetricsÁrnessýslu Short-Term Rental Market Composition (2026): Property & Room Types
Room Type Distribution
Property Type Distribution
Market Composition Insights for Árnessýslu
- The Árnessýslu Airbnb market composition is heavily skewed towards Entire Home/Apt listings, which make up 58.8% of the 17 active rentals. This indicates strong guest preference for privacy and space.
- However, a notable 41.2% share for Private Rooms suggests opportunities for budget-conscious travelers or hosts renting out spare rooms.
- Looking at the property type distribution in Árnessýslu, House properties are the most common (35.3%), reflecting the local real estate landscape.
- Houses represent a significant 35.3% portion, catering likely to families or larger groups.
- The presence of 23.5% Hotel/Boutique listings indicates integration with traditional hospitality.
Árnessýslu Airbnb Room Capacity Analysis (2026): Bedroom Distribution
Distribution of Listings by Number of Bedrooms
Room Capacity Insights for Árnessýslu
- The dominant room capacity in Árnessýslu is 1 bedroom listings, making up 47.1% of the market. This suggests a strong demand for properties suitable for couples or solo travelers.
- Together, 1 bedroom and 3 bedrooms properties represent 64.7% of the active Airbnb listings in Árnessýslu, indicating a high concentration in these sizes.
- A significant 23.5% of listings offer 3+ bedrooms, catering to larger groups and families seeking more space in Árnessýslu.
Árnessýslu Vacation Rental Guest Capacity Trends (2026)
Distribution of Listings by Guest Capacity
Guest Capacity Insights for Árnessýslu
- The most common guest capacity trend in Árnessýslu vacation rentals is listings accommodating 2 guests (35.3%). This suggests the primary traveler segment is likely couples or solo travelers.
- Properties designed for 2 guests and 6 guests dominate the Árnessýslu STR market, accounting for 58.8% of listings.
- 29.4% of properties accommodate 6+ guests, serving the market segment for larger families or group travel in Árnessýslu.
- On average, properties in Árnessýslu are equipped to host 4.0 guests.
Árnessýslu Airbnb Booking Patterns (2026): Available vs. Booked Days
Available Days Distribution
Booked Days Distribution
Booking Pattern Insights for Árnessýslu
- The most common availability pattern in Árnessýslu falls within the 181-270 days range, representing 47.1% of listings. This suggests many properties have significant open periods on their calendars.
- Approximately 76.5% of listings show high availability (181+ days open annually), indicating potential for increased bookings or specific owner usage patterns.
- For booked days, the 91-180 days range is most frequent in Árnessýslu (47.1%), reflecting common guest stay durations or potential owner blocking patterns.
- A notable 23.5% of properties secure long booking periods (181+ days booked per year), highlighting successful long-term rental strategies or significant owner usage.
Árnessýslu Airbnb Minimum Stay Requirements Analysis
Distribution of Listings by Minimum Night Requirement
1 Night
16 listings
100% of total
Key Insights
- The most prevalent minimum stay requirement in Árnessýslu is 1 Night, adopted by 100% of listings. This highlights the market's preference for shorter, flexible bookings.
- A strong majority (100.0%) of the Árnessýslu Airbnb data shows acceptance of very short stays (1-2 nights), indicating a dynamic, high-turnover market.
Recommendations
- Align with the market by considering a 1 Night minimum stay, as 100% of Árnessýslu hosts use this setting.
- Adjust minimum nights based on seasonality – potentially shorter during low season and longer during peak demand periods in Árnessýslu.
Árnessýslu Airbnb Cancellation Policy Trends Analysis (2026)
Flexible
5 listings
29.4% of total
Moderate
10 listings
58.8% of total
Strict
2 listings
11.8% of total
Cancellation Policy Insights for Árnessýslu
- The prevailing Airbnb cancellation policy trend in Árnessýslu is Moderate, used by 58.8% of listings.
- The market strongly favors guest-friendly terms, with 88.2% of listings offering Flexible or Moderate policies. This suggests guests in Árnessýslu may expect booking flexibility.
Recommendations for Hosts
- Consider adopting a Moderate policy to align with the 58.8% market standard in Árnessýslu.
- Using a Strict policy might deter some guests, as only 11.8% of listings use it. Evaluate if potential revenue protection outweighs possible lower booking rates.
- Regularly review your cancellation policy against competitors and market demand shifts in Árnessýslu.
Árnessýslu STR Booking Lead Time Analysis (2026)
Average Booking Lead Time by Month
Booking Lead Time Insights for Árnessýslu
- The overall average booking lead time for vacation rentals in Árnessýslu is 127 days.
- Guests book furthest in advance for stays during July (average 181 days), likely coinciding with peak travel demand or local events.
- The shortest booking windows occur for stays in September (average 75 days), indicating more last-minute travel plans during this time.
- Seasonally, Spring (145 days avg.) sees the longest lead times, while Fall (104 days avg.) has the shortest, reflecting typical travel planning cycles.
Recommendations for Hosts
- Use the overall average lead time (127 days) as a baseline for your pricing and availability strategy in Árnessýslu.
- For July stays, consider implementing length-of-stay discounts or slightly higher rates for bookings made less than 181 days out to capitalize on advance planning.
- Target marketing efforts for the Spring season well in advance (at least 145 days) to capture early planners.
- Monitor your own booking lead times against these Árnessýslu averages to identify opportunities for dynamic pricing adjustments.
Popular & Essential Airbnb Amenities in Árnessýslu (2026)
Amenity Prevalence
Amenity Insights for Árnessýslu
- Essential amenities in Árnessýslu that guests expect include: Wifi, Essentials, Free parking on premises, Heating. Lacking these (any) could significantly impact bookings.
- Popular amenities like Hair dryer, Lock on bedroom door, Fire extinguisher are common but not universal. Offering these can provide a competitive edge.
Recommendations for Hosts
- Ensure your listing includes all essential amenities for Árnessýslu: Wifi, Essentials, Free parking on premises, Heating.
- Consider adding popular differentiators like Hair dryer or Lock on bedroom door to increase appeal.
- Highlight unique or less common amenities you offer (e.g., hot tub, dedicated workspace, EV charger) in your listing description and photos.
- Regularly check competitor amenities in Árnessýslu to stay competitive.
Árnessýslu Airbnb Guest Demographics & Profile Analysis (2026)
Guest Profile Summary for Árnessýslu
- The typical guest profile for Airbnb in Árnessýslu consists of predominantly international visitors (100%), with top international origins including Germany, typically belonging to the Post-2000s (Gen Z/Alpha) group (50%), primarily speaking English or German.
- Domestic travelers account for 0.5% of guests.
- Key international markets include United States (48.2%) and Germany (9%).
- Top languages spoken are English (51.7%) followed by German (12.8%).
- A significant demographic segment is the Post-2000s (Gen Z/Alpha) group, representing 50% of guests.
Recommendations for Hosts
- Focus marketing internationally, particularly towards travelers from Germany.
- Tailor amenities and listing descriptions to appeal to the dominant Post-2000s (Gen Z/Alpha) demographic (e.g., highlight fast WiFi, smart home features, local guides).
- Highlight unique local experiences or amenities relevant to the primary guest profile.
- Consider seasonal promotions aligned with peak travel times for key origin markets.
Nearby Short-Term Rental Market Comparison
How does the Árnessýslu Airbnb market stack up against its neighbors? Compare key performance metrics like average monthly revenue, ADR, and occupancy rates in surrounding areas to understand the broader regional STR landscape.
| Market | Active Properties | Monthly Revenue | Daily Rate | Avg. Occupancy |
|---|---|---|---|---|
| Kjósarhreppur | 19 | $8,132 | $550.76 | 62% |
| Ölfus | 14 | $4,882 | $255.86 | 65% |
| Reykholt | 47 | $4,797 | $319.85 | 54% |
| Vik | 52 | $4,585 | $304.41 | 63% |
| Grímsnes- og Grafningshreppur | 34 | $4,215 | $377.05 | 50% |
| Grímsnes | 10 | $4,171 | $334.03 | 67% |
| Hella | 104 | $3,961 | $300.91 | 51% |
| Fludir | 24 | $3,758 | $313.97 | 48% |
| Akranes | 22 | $3,741 | $261.58 | 57% |
| Hveragerðisbær | 44 | $3,679 | $303.47 | 48% |