Kopavogur Airbnb Market Analysis 2026: Short Term Rental Data & Vacation Rental Statistics in Capital Region, Iceland
Is Airbnb profitable in Kopavogur in 2026? Explore comprehensive Airbnb analytics for Kopavogur, Capital Region, Iceland to uncover income potential. This 2026 STR market report for Kopavogur, based on AirROI data from February 2025 to January 2026, reveals key trends in the market of 205 active listings.
Whether you're considering an Airbnb investment in Kopavogur, optimizing your existing vacation rental, or exploring rental arbitrage opportunities, understanding the Kopavogur Airbnb data is crucial. Understanding the local regulations is key to maximizing your short term rental income potential. Let's dive into the specifics.
Key Kopavogur Airbnb Performance Metrics Overview
Monthly Airbnb Revenue Variations & Income Potential in Kopavogur (2026)
Understanding the monthly revenue variations for Airbnb listings in Kopavogur is key to maximizing your short term rental income potential. Seasonality significantly impacts earnings. Our analysis, based on data from the past 12 months, shows that the peak revenue month for STRs in Kopavogur is typically August, while January often presents the lowest earnings, highlighting opportunities for strategic pricing adjustments during shoulder and low seasons. Explore the typical Airbnb income in Kopavogur across different performance tiers:
- Best-in-class properties (Top 10%) achieve $6,845+ monthly, often utilizing dynamic pricing and superior guest experiences.
- Strong performing properties (Top 25%) earn $4,549 or more, indicating effective management and desirable locations/amenities.
- Typical properties (Median) generate around $2,751 per month, representing the average market performance.
- Entry-level properties (Bottom 25%) see earnings around $1,497, often with potential for optimization.
Average Monthly Airbnb Earnings Trend in Kopavogur
Kopavogur Airbnb Occupancy Rate Trends (2026)
Maximize your bookings by understanding the Kopavogur STR occupancy trends. Seasonal demand shifts significantly influence how often properties are booked. Typically, Augustsees the highest demand (peak season occupancy), while January experiences the lowest (low season). Effective strategies, like adjusting minimum stays or offering promotions, can boost occupancy during slower periods. Here's how different property tiers perform in Kopavogur:
- Best-in-class properties (Top 10%) achieve 85%+ occupancy, indicating high desirability and potentially optimized availability.
- Strong performing properties (Top 25%) maintain 67% or higher occupancy, suggesting good market fit and guest satisfaction.
- Typical properties (Median) have an occupancy rate around 42%.
- Entry-level properties (Bottom 25%) average 21% occupancy, potentially facing higher vacancy.
Average Monthly Occupancy Rate Trend in Kopavogur
Average Daily Rate (ADR) Airbnb Trends in Kopavogur (2026)
Effective short term rental pricing strategy in Kopavogur involves understanding monthly ADR fluctuations. The Average Daily Rate (ADR) for Airbnb in Kopavogur typically peaks in December and dips lowest during April. Leveraging Airbnb dynamic pricing tools or strategies based on this seasonality can significantly boost revenue. Here's a look at the typical nightly rates achieved:
- Best-in-class properties (Top 10%) command rates of $474+ per night, often due to premium features or locations.
- Strong performing properties (Top 25%) achieve nightly rates of $316 or more.
- Typical properties (Median) charge around $204 per night.
- Entry-level properties (Bottom 25%) earn around $156 per night.
Average Daily Rate (ADR) Trend by Month in Kopavogur
Get Live Kopavogur Market Intelligence 👇

Explore Real-time Analytics
Airbnb Seasonality Analysis & Trends in Kopavogur (2026)
Peak Season (August, July, September)
- Revenue averages $4,889 per month
- Occupancy rates average 59.5%
- Daily rates average $265
Shoulder Season
- Revenue averages $3,266 per month
- Occupancy maintains around 45.1%
- Daily rates hold near $261
Low Season (January, February, December)
- Revenue drops to average $2,426 per month
- Occupancy decreases to average 29.0%
- Daily rates adjust to average $275
Seasonality Insights for Kopavogur
- The Airbnb seasonality in Kopavogur shows highly seasonal trends requiring careful strategy. While the sections above show seasonal averages, it's also insightful to look at the extremes:
- During the high season, the absolute peak month showcases Kopavogur's highest earning potential, with monthly revenues capable of climbing to $5,310, occupancy reaching a high of 64.4%, and ADRs peaking at $291.
- Conversely, the slowest single month of the year, typically falling within the low season, marks the market's lowest point. In this month, revenue might dip to $2,030, occupancy could drop to 19.6%, and ADRs may adjust down to $245.
- Understanding both the seasonal averages and these monthly peaks and troughs in revenue, occupancy, and ADR is crucial for maximizing your Airbnb profit potential in Kopavogur.
Seasonal Strategies for Maximizing Profit
- Peak Season: Maximize revenue through premium pricing and potentially longer minimum stays. Ensure high availability.
- Low Season: Offer competitive pricing, special promotions (e.g., extended stay discounts), and flexible cancellation policies. Target off-season travelers like remote workers or budget-conscious guests.
- Shoulder Seasons: Implement dynamic pricing that balances peak and low rates. Target weekend travelers or specific events. Offer slightly more flexible terms than peak season.
- Regularly analyze your own performance against these Kopavogur seasonality benchmarks and adjust your pricing and availability strategy accordingly.
Best Areas for Airbnb Investment in Kopavogur (2026)
Exploring the top neighborhoods for short-term rentals in Kopavogur? This section highlights key areas, outlining why they are attractive for hosts and guests, along with notable local attractions. Consider these locations based on your target guest profile and investment strategy.
| Neighborhood / Area | Why Host Here? (Target Guests & Appeal) | Key Attractions & Landmarks |
|---|---|---|
| Kopavogur Center | The heart of Kopavogur with easy access to shops, restaurants, and public transport. A great spot for tourists who want to experience local life while being close to Reykjavik. | Kopavogur Shopping Center, Viking World, Kopavogur Art Museum, Lake Ellidavatn, Kopavogur Church |
| Kopavogur Shoreline | A beautiful coastal area that offers stunning views of the ocean and mountains. Perfect for visitors who enjoy nature and outdoor activities. | Kopavogur Beach, Ellidavatn Lake, Walking paths along the coastline, Harbour area, Nearby hiking trails |
| Laugardalur | A vibrant district known for its thermal pools and gardens. Ideal for visitors looking to relax and enjoy nature. | Reykjavik Laugardalur Park, Laugardalslaug Swimming Pool, Botanical Gardens, Horse riding tours, Local cafes |
| Gotheberg | A family-friendly neighborhood with parks and recreational areas. Great for those traveling with children. | Park with playgrounds, Nearby amenities, Community center, Walking paths, Sport facilities |
| Vollur | A quaint suburban area offering a local Icelandic experience. Visitors can enjoy peaceful residential streets and local shops. | Local cafes, Parks, Community culture, Nearby walking trails, Views of Mt. Esja |
| Ellidaholtsvegur | A quieter area on the outskirts, perfect for those seeking peace away from the city hustle, yet still within easy reach of attractions. | Peaceful residential environment, Local nature walks, Nearby scenic viewpoints, Shopping options in Kopavogur, Connections to public transport |
| Breidholt | An area with great accessibility to public transport and local amenities, catering well to tourists and business travelers alike. | Local supermarkets, Nearby parks, Transport options to Reykjavik, Cafes, Community events |
| Kopavogur Golf Club | A beautiful golf course area that attracts visitors who enjoy sports and outdoor leisure activities. | Kopavogur Golf Course, Clubhouse amenities, Scenic views, Nearby hiking paths, Relaxing atmosphere |
Understanding Airbnb License Requirements & STR Laws in Kopavogur (2026)
With 19% of listings showing registration in 2026, understanding potential Airbnb license requirements is crucial in Kopavogur. Always verify the latest short term rental regulations and Airbnb license requirements directly with local government authorities for Kopavogur to ensure full compliance before hosting.
(Source: AirROI data, 2026, based on 19% licensed listings)
Top Performing Airbnb Properties in Kopavogur (2026)
Benchmark your potential! Explore examples of top-performing Airbnb properties in Kopavogurbased on Trailing Twelve Month (TTM) revenue. Analyze their characteristics, revenue, occupancy rate, and ADR to understand what drives success in this market.

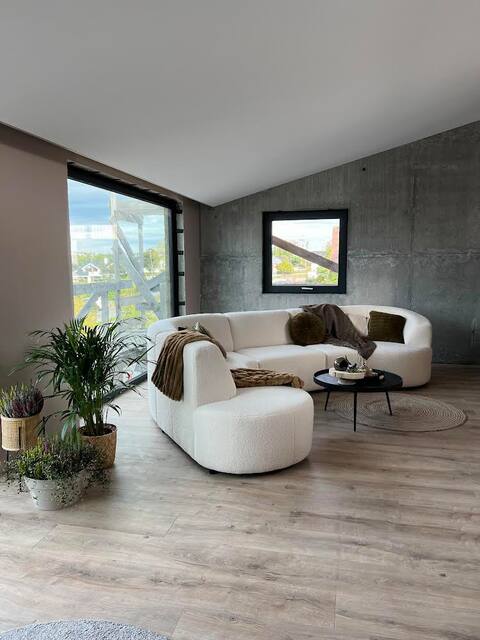
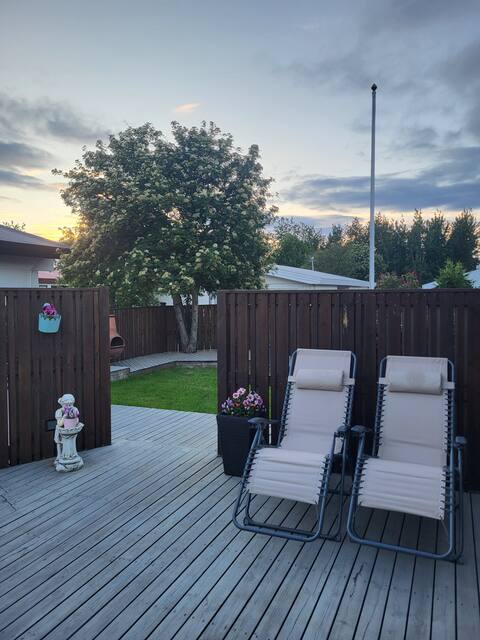
Villa hot tub outdoor sauna mountain views
Entire Place • 3 bedrooms

Townhouse by the lake spectacular view 5 bedrooms
Entire Place • 5 bedrooms
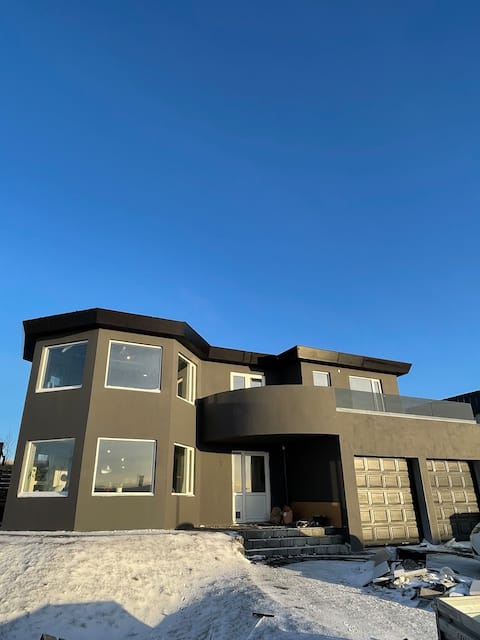
Modern 4-bedroom home with ocean views
Entire Place • 4 bedrooms
Family house
Entire Place • 5 bedrooms
Great place for groups and large families
Entire Place • 4 bedrooms

Modern apartment next to Sky Lagoon
Entire Place • 2 bedrooms
Note: Performance varies based on location, size, amenities, seasonality, and management quality. Data reflects the past 12 months.
Top Performing Airbnb Hosts in Kopavogur (2026)
Learn from the best! This table showcases top-performing Airbnb hosts in Kopavogur based on the number of properties managed and estimated total revenue over the past year. Analyze their scale and performance metrics.
| Host Name | Properties | Grossing Revenue | Stay Reviews | Avg Rating |
|---|---|---|---|---|
| Sigurdur | 1 | $183,024 | 206 | 4.95/5.0 |
| Heimaleiga | 12 | $155,393 | 697 | 4.55/5.0 |
| Bjarni | 2 | $129,621 | 137 | 4.88/5.0 |
| Egill | 1 | $104,848 | 6 | 5.00/5.0 |
| Emilia | 1 | $104,284 | 38 | 4.68/5.0 |
| Hrund | 1 | $96,899 | 10 | 5.00/5.0 |
| Þorgils Már | 1 | $88,177 | 9 | 5.00/5.0 |
| Einar | 1 | $77,519 | 64 | 4.78/5.0 |
| Sigurlaug | 1 | $72,827 | 25 | 5.00/5.0 |
| Eva | 2 | $71,613 | 12 | 5.00/5.0 |
Analyzing the strategies of top hosts, such as their property selection, pricing, and guest communication, can offer valuable lessons for optimizing your own Airbnb operations in Kopavogur.
Dive Deeper: Advanced Kopavogur STR Market Data (2026)
Ready to unlock more insights? AirROI provides access to advanced metrics and comprehensive Airbnb data for Kopavogur. Explore detailed analytics beyond this report to refine your investment strategy, optimize pricing, and maximize your vacation rental profits.
Explore Advanced MetricsKopavogur Short-Term Rental Market Composition (2026): Property & Room Types
Room Type Distribution
Property Type Distribution
Market Composition Insights for Kopavogur
- The Kopavogur Airbnb market composition is heavily skewed towards Entire Home/Apt listings, which make up 95.1% of the 205 active rentals. This indicates strong guest preference for privacy and space.
- Looking at the property type distribution in Kopavogur, Apartment/Condo properties are the most common (78.5%), reflecting the local real estate landscape.
- Houses represent a significant 20% portion, catering likely to families or larger groups.
- Smaller segments like others (combined 1.5%) offer potential for unique stay experiences.
Kopavogur Airbnb Room Capacity Analysis (2026): Bedroom Distribution
Distribution of Listings by Number of Bedrooms
Room Capacity Insights for Kopavogur
- The dominant room capacity in Kopavogur is 2 bedrooms listings, making up 31.2% of the market. This suggests a strong demand for properties suitable for couples or solo travelers.
- Together, 2 bedrooms and 1 bedroom properties represent 61.9% of the active Airbnb listings in Kopavogur, indicating a high concentration in these sizes.
- A significant 31.2% of listings offer 3+ bedrooms, catering to larger groups and families seeking more space in Kopavogur.
Kopavogur Vacation Rental Guest Capacity Trends (2026)
Distribution of Listings by Guest Capacity
Guest Capacity Insights for Kopavogur
- The most common guest capacity trend in Kopavogur vacation rentals is listings accommodating 4 guests (35.6%). This suggests the primary traveler segment is likely small families or groups.
- Properties designed for 4 guests and 2 guests dominate the Kopavogur STR market, accounting for 54.6% of listings.
- 21.9% of properties accommodate 6+ guests, serving the market segment for larger families or group travel in Kopavogur.
- On average, properties in Kopavogur are equipped to host 4.1 guests.
Kopavogur Airbnb Booking Patterns (2026): Available vs. Booked Days
Available Days Distribution
Booked Days Distribution
Booking Pattern Insights for Kopavogur
- The most common availability pattern in Kopavogur falls within the 271-366 days range, representing 47.8% of listings. This suggests many properties have significant open periods on their calendars.
- Approximately 83.4% of listings show high availability (181+ days open annually), indicating potential for increased bookings or specific owner usage patterns.
- For booked days, the 91-180 days range is most frequent in Kopavogur (36.6%), reflecting common guest stay durations or potential owner blocking patterns.
- A notable 17.5% of properties secure long booking periods (181+ days booked per year), highlighting successful long-term rental strategies or significant owner usage.
Kopavogur Airbnb Minimum Stay Requirements Analysis
Distribution of Listings by Minimum Night Requirement
1 Night
17 listings
8.3% of total
2 Nights
33 listings
16.1% of total
3 Nights
32 listings
15.6% of total
4-6 Nights
35 listings
17.1% of total
7-29 Nights
6 listings
2.9% of total
30+ Nights
82 listings
40% of total
Key Insights
- The most prevalent minimum stay requirement in Kopavogur is 30+ Nights, adopted by 40% of listings. This highlights the market's preference for longer commitments.
- A significant segment (40%) caters to monthly stays (30+ nights) in Kopavogur, pointing to opportunities in the extended-stay market.
Recommendations
- Align with the market by considering a 30+ Nights minimum stay, as 40% of Kopavogur hosts use this setting.
- If feasible, allowing 1-night stays, especially midweek or during low season, could capture last-minute bookings, as only 8.3% currently do.
- Explore offering discounts for stays of 30+ nights to attract the 40% of the market seeking extended stays.
- Adjust minimum nights based on seasonality – potentially shorter during low season and longer during peak demand periods in Kopavogur.
Kopavogur Airbnb Cancellation Policy Trends Analysis (2026)
Limited
1 listings
0.5% of total
Super Strict 30 Days
2 listings
1% of total
Flexible
58 listings
28.6% of total
Moderate
74 listings
36.5% of total
Firm
62 listings
30.5% of total
Strict
6 listings
3% of total
Cancellation Policy Insights for Kopavogur
- The prevailing Airbnb cancellation policy trend in Kopavogur is Moderate, used by 36.5% of listings.
- There's a relatively balanced mix between guest-friendly (65.1%) and stricter (33.5%) policies, offering choices for different guest needs.
- Strict cancellation policies are quite rare (3%), potentially making listings with this policy less competitive unless justified by high demand or property type.
Recommendations for Hosts
- Consider adopting a Moderate policy to align with the 36.5% market standard in Kopavogur.
- Using a Strict policy might deter some guests, as only 3% of listings use it. Evaluate if potential revenue protection outweighs possible lower booking rates.
- Regularly review your cancellation policy against competitors and market demand shifts in Kopavogur.
Kopavogur STR Booking Lead Time Analysis (2026)
Average Booking Lead Time by Month
Booking Lead Time Insights for Kopavogur
- The overall average booking lead time for vacation rentals in Kopavogur is 69 days.
- Guests book furthest in advance for stays during August (average 85 days), likely coinciding with peak travel demand or local events.
- The shortest booking windows occur for stays in February (average 37 days), indicating more last-minute travel plans during this time.
- Seasonally, Summer (75 days avg.) sees the longest lead times, while Spring (53 days avg.) has the shortest, reflecting typical travel planning cycles.
Recommendations for Hosts
- Use the overall average lead time (69 days) as a baseline for your pricing and availability strategy in Kopavogur.
- For August stays, consider implementing length-of-stay discounts or slightly higher rates for bookings made less than 85 days out to capitalize on advance planning.
- Target marketing efforts for the Summer season well in advance (at least 75 days) to capture early planners.
- Monitor your own booking lead times against these Kopavogur averages to identify opportunities for dynamic pricing adjustments.
Popular & Essential Airbnb Amenities in Kopavogur (2026)
Amenity Prevalence
Amenity Insights for Kopavogur
- Essential amenities in Kopavogur that guests expect include: Wifi, Free parking on premises, Kitchen, Smoke alarm. Lacking these (any) could significantly impact bookings.
- Popular amenities like TV, Heating, Hot water are common but not universal. Offering these can provide a competitive edge.
Recommendations for Hosts
- Ensure your listing includes all essential amenities for Kopavogur: Wifi, Free parking on premises, Kitchen, Smoke alarm.
- Prioritize adding missing essentials: Wifi, Free parking on premises, Kitchen, Smoke alarm.
- Consider adding popular differentiators like TV or Heating to increase appeal.
- Highlight unique or less common amenities you offer (e.g., hot tub, dedicated workspace, EV charger) in your listing description and photos.
- Regularly check competitor amenities in Kopavogur to stay competitive.
Kopavogur Airbnb Guest Demographics & Profile Analysis (2026)
Guest Profile Summary for Kopavogur
- The typical guest profile for Airbnb in Kopavogur consists of predominantly international visitors (99%), with top international origins including United Kingdom, typically belonging to the Post-2000s (Gen Z/Alpha) group (50%), primarily speaking English or French.
- Domestic travelers account for 1.3% of guests.
- Key international markets include United States (36.3%) and United Kingdom (8.8%).
- Top languages spoken are English (50.4%) followed by French (9.8%).
- A significant demographic segment is the Post-2000s (Gen Z/Alpha) group, representing 50% of guests.
Recommendations for Hosts
- Focus marketing internationally, particularly towards travelers from United Kingdom.
- Tailor amenities and listing descriptions to appeal to the dominant Post-2000s (Gen Z/Alpha) demographic (e.g., highlight fast WiFi, smart home features, local guides).
- Highlight unique local experiences or amenities relevant to the primary guest profile.
- Consider seasonal promotions aligned with peak travel times for key origin markets.
Nearby Short-Term Rental Market Comparison
How does the Kopavogur Airbnb market stack up against its neighbors? Compare key performance metrics like average monthly revenue, ADR, and occupancy rates in surrounding areas to understand the broader regional STR landscape.
| Market | Active Properties | Monthly Revenue | Daily Rate | Avg. Occupancy |
|---|---|---|---|---|
| Kjósarhreppur | 26 | $6,581 | $477.84 | 50% |
| Grímsnes- og Grafningshreppur | 30 | $4,760 | $399.23 | 47% |
| Garður | 11 | $4,533 | $267.99 | 59% |
| Sandgerði | 17 | $4,295 | $258.70 | 56% |
| Reykholt | 59 | $4,155 | $334.95 | 51% |
| Hella | 127 | $4,142 | $329.17 | 50% |
| Ölfus | 18 | $4,137 | $226.86 | 60% |
| Akranes | 22 | $4,129 | $286.15 | 58% |
| Grímsnes | 15 | $4,077 | $354.16 | 57% |
| Selfoss | 244 | $3,927 | $334.39 | 51% |