Bodh Gaya Airbnb Market Analysis 2026: Short Term Rental Data & Vacation Rental Statistics in Bihar, India
Is Airbnb profitable in Bodh Gaya in 2026? Explore comprehensive Airbnb analytics for Bodh Gaya, Bihar, India to uncover income potential. This 2026 STR market report for Bodh Gaya, based on AirROI data from May 2024 to April 2025, reveals key trends in the niche market of 19 active listings.
Whether you're considering an Airbnb investment in Bodh Gaya, optimizing your existing vacation rental, or exploring rental arbitrage opportunities, understanding the Bodh Gaya Airbnb data is crucial. Leveraging the low regulation environment is key to maximizing your short term rental income potential. Let's dive into the specifics.
Key Bodh Gaya Airbnb Performance Metrics Overview
Monthly Airbnb Revenue Variations & Income Potential in Bodh Gaya (2026)
Understanding the monthly revenue variations for Airbnb listings in Bodh Gaya is key to maximizing your short term rental income potential. Seasonality significantly impacts earnings. Our analysis, based on data from the past 12 months, shows that the peak revenue month for STRs in Bodh Gaya is typically May, while December often presents the lowest earnings, highlighting opportunities for strategic pricing adjustments during shoulder and low seasons. Explore the typical Airbnb income in Bodh Gaya across different performance tiers:
- Best-in-class properties (Top 10%) achieve $1,053+ monthly, often utilizing dynamic pricing and superior guest experiences.
- Strong performing properties (Top 25%) earn $801 or more, indicating effective management and desirable locations/amenities.
- Typical properties (Median) generate around $394 per month, representing the average market performance.
- Entry-level properties (Bottom 25%) see earnings around $174, often with potential for optimization.
Average Monthly Airbnb Earnings Trend in Bodh Gaya
Bodh Gaya Airbnb Occupancy Rate Trends (2026)
Maximize your bookings by understanding the Bodh Gaya STR occupancy trends. Seasonal demand shifts significantly influence how often properties are booked. Typically, Octobersees the highest demand (peak season occupancy), while November experiences the lowest (low season). Effective strategies, like adjusting minimum stays or offering promotions, can boost occupancy during slower periods. Here's how different property tiers perform in Bodh Gaya:
- Best-in-class properties (Top 10%) achieve 60%+ occupancy, indicating high desirability and potentially optimized availability.
- Strong performing properties (Top 25%) maintain 27% or higher occupancy, suggesting good market fit and guest satisfaction.
- Typical properties (Median) have an occupancy rate around 13%.
- Entry-level properties (Bottom 25%) average 8% occupancy, potentially facing higher vacancy.
Average Monthly Occupancy Rate Trend in Bodh Gaya
Average Daily Rate (ADR) Airbnb Trends in Bodh Gaya (2026)
Effective short term rental pricing strategy in Bodh Gaya involves understanding monthly ADR fluctuations. The Average Daily Rate (ADR) for Airbnb in Bodh Gaya typically peaks in October and dips lowest during March. Leveraging Airbnb dynamic pricing tools or strategies based on this seasonality can significantly boost revenue. Here's a look at the typical nightly rates achieved:
- Best-in-class properties (Top 10%) command rates of $55+ per night, often due to premium features or locations.
- Strong performing properties (Top 25%) achieve nightly rates of $39 or more.
- Typical properties (Median) charge around $27 per night.
- Entry-level properties (Bottom 25%) earn around $16 per night.
Average Daily Rate (ADR) Trend by Month in Bodh Gaya
Get Live Bodh Gaya Market Intelligence 👇

Explore Real-time Analytics
Airbnb Seasonality Analysis & Trends in Bodh Gaya (2025)
Peak Season (May, August, June)
- Revenue averages $910 per month
- Occupancy rates average 15.4%
- Daily rates average $35
Shoulder Season
- Revenue averages $519 per month
- Occupancy maintains around 23.9%
- Daily rates hold near $32
Low Season (February, March, December)
- Revenue drops to average $219 per month
- Occupancy decreases to average 20.7%
- Daily rates adjust to average $26
Seasonality Insights for Bodh Gaya
- The Airbnb seasonality in Bodh Gaya shows highly seasonal trends requiring careful strategy. While the sections above show seasonal averages, it's also insightful to look at the extremes:
- During the high season, the absolute peak month showcases Bodh Gaya's highest earning potential, with monthly revenues capable of climbing to $1,041, occupancy reaching a high of 37.0%, and ADRs peaking at $35.
- Conversely, the slowest single month of the year, typically falling within the low season, marks the market's lowest point. In this month, revenue might dip to $189, occupancy could drop to 0.0%, and ADRs may adjust down to $25.
- Understanding both the seasonal averages and these monthly peaks and troughs in revenue, occupancy, and ADR is crucial for maximizing your Airbnb profit potential in Bodh Gaya.
Seasonal Strategies for Maximizing Profit
- Peak Season: Maximize revenue through premium pricing and potentially longer minimum stays. Ensure high availability.
- Low Season: Offer competitive pricing, special promotions (e.g., extended stay discounts), and flexible cancellation policies. Target off-season travelers like remote workers or budget-conscious guests.
- Shoulder Seasons: Implement dynamic pricing that balances peak and low rates. Target weekend travelers or specific events. Offer slightly more flexible terms than peak season.
- Regularly analyze your own performance against these Bodh Gaya seasonality benchmarks and adjust your pricing and availability strategy accordingly.
Best Areas for Airbnb Investment in Bodh Gaya (2026)
Exploring the top neighborhoods for short-term rentals in Bodh Gaya? This section highlights key areas, outlining why they are attractive for hosts and guests, along with notable local attractions. Consider these locations based on your target guest profile and investment strategy.
| Neighborhood / Area | Why Host Here? (Target Guests & Appeal) | Key Attractions & Landmarks |
|---|---|---|
| Mahabodhi Temple Complex | A UNESCO World Heritage Site and one of the most important pilgrimage sites in Buddhism. Staying nearby attracts spiritual tourists, scholars, and photographers. | Mahabodhi Temple, Bodhi Tree, Great Buddha Statue, Thai Monastery, Chinese Temple, Monastic Site |
| Bodh Gaya Market | The local market area offers a glimpse into everyday life and culture in Bodh Gaya. It's popular among visitors looking for authentic experiences and souvenirs. | Local Artisan Shops, Street Food Stalls, Religious Souvenirs, Traditional Handicrafts, Cultural Performances |
| Buddha Park | A serene park featuring beautiful statues and landscaping, great for relaxation and spiritual reflection. Ideal for visitors seeking peace and tranquility. | Statue of Buddha, Beautiful Gardens, Walking Trails, Meditation Areas, Local Flora |
| Bodh Gaya Railway Station Area | Convenient access for travelers arriving by train, making it a strategic location for hosts seeking to attract transient visitors including pilgrims and tourists. | Transport Links, Local Eateries, Guesthouses, Pilgrimage Taxies |
| Natania Road | A quieter part of Bodh Gaya with several guesthouses and hotels, preferred by tourists seeking peace away from the main attractions while still being accessible. | Peaceful Atmosphere, Local Homestays, Guesthouses, Nature Walks |
| Near the Bodhi Tree | Attracts visitors from all over the world, interested in the spiritual significance of the area. Short-term stays near this historic site are in high demand. | Bodhi Tree, Visitor Center, Pilgrimage Routes, Spiritual Retreats |
| Karma Samtenling Monastery Area | A popular area among spiritual seekers and retreatants, offering a tranquil environment and cultural richness. Great demand for guest accommodations. | Karma Samtenling Monastery, Meditation Centers, Cultural Festivals, Local Community |
| Templar Road | Close to various temples and cultural sites, making it an attractive location for visitors wishing to explore multiple attractions easily. | Various Temples, Cultural Sites, Hotels and Guesthouses, Local Cuisine |
Understanding Airbnb License Requirements & STR Laws in Bodh Gaya (2026)
While Bodh Gaya, Bihar, India currently shows low STR regulations, specific Airbnb license requirements might still exist or change. Always verify the latest short term rental regulations and Airbnb license requirements directly with local government authorities for Bodh Gaya to ensure full compliance before hosting.
(Source: AirROI data, 2026, finding no licensed listings among those analyzed)
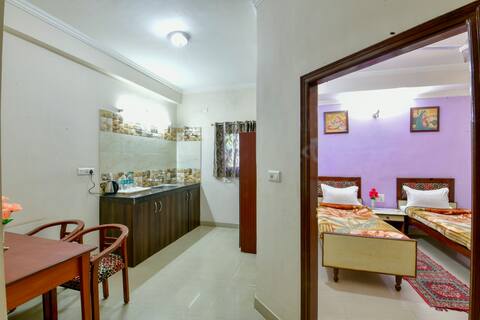
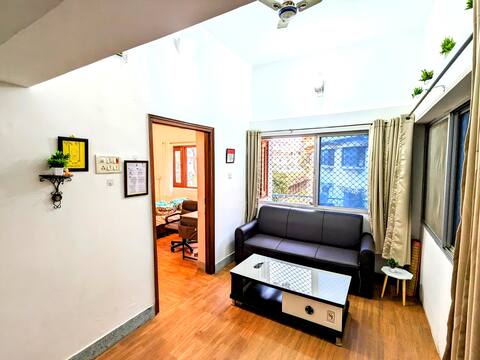
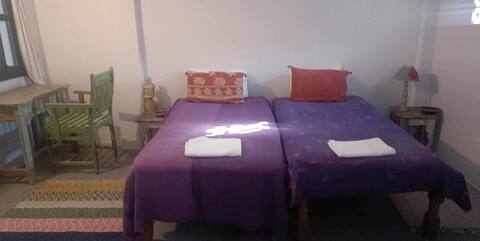
Top Performing Airbnb Properties in Bodh Gaya (2026)
Benchmark your potential! Explore examples of top-performing Airbnb properties in Bodh Gayabased on Trailing Twelve Month (TTM) revenue. Analyze their characteristics, revenue, occupancy rate, and ADR to understand what drives success in this market.
2 bhk saperate Flat.
Private Room • 2 bedrooms

mariya condo
Entire Place • 2 bedrooms
Dwarka Home Stay
Entire Place • 1 bedroom

Chambre et terrasse privée sur jardin
Private Room • 1 bedroom
Bodhgaya room in a lush garden .
Private Room • 1 bedroom

Chambre chaleureuse sur jardin
Private Room • 1 bedroom
Note: Performance varies based on location, size, amenities, seasonality, and management quality. Data reflects the past 12 months.
Top Performing Airbnb Hosts in Bodh Gaya (2026)
Learn from the best! This table showcases top-performing Airbnb hosts in Bodh Gaya based on the number of properties managed and estimated total revenue over the past year. Analyze their scale and performance metrics.
| Host Name | Properties | Grossing Revenue | Stay Reviews | Avg Rating |
|---|---|---|---|---|
| Akash Anirudha | 7 | $8,384 | 114 | 2.74/5.0 |
| Host #491496273 | 1 | $4,716 | 0 | 0.00/5.0 |
| Syed | 1 | $4,628 | 11 | 4.73/5.0 |
| Neeraj | 1 | $4,540 | 42 | 4.95/5.0 |
| Host #56304931 | 1 | $1,062 | 0 | 0.00/5.0 |
| Host #493837850 | 1 | $992 | 0 | 0.00/5.0 |
| Host #490576436 | 1 | $680 | 0 | 0.00/5.0 |
| Host #488846843 | 1 | $630 | 0 | 0.00/5.0 |
| Tahir | 1 | $342 | 13 | 4.54/5.0 |
| Naveen | 2 | $292 | 98 | 4.76/5.0 |
Analyzing the strategies of top hosts, such as their property selection, pricing, and guest communication, can offer valuable lessons for optimizing your own Airbnb operations in Bodh Gaya.
Dive Deeper: Advanced Bodh Gaya STR Market Data (2026)
Ready to unlock more insights? AirROI provides access to advanced metrics and comprehensive Airbnb data for Bodh Gaya. Explore detailed analytics beyond this report to refine your investment strategy, optimize pricing, and maximize your vacation rental profits.
Explore Advanced MetricsBodh Gaya Short-Term Rental Market Composition (2026): Property & Room Types
Room Type Distribution
Property Type Distribution
Market Composition Insights for Bodh Gaya
- The Bodh Gaya Airbnb market composition is heavily skewed towards Private Room listings, which make up 78.9% of the 19 active rentals. This indicates strong guest preference for privacy and space.
- Looking at the property type distribution in Bodh Gaya, Hotel/Boutique properties are the most common (57.9%), reflecting the local real estate landscape.
- Houses represent a significant 15.8% portion, catering likely to families or larger groups.
- The presence of 57.9% Hotel/Boutique listings indicates integration with traditional hospitality.
Bodh Gaya Airbnb Room Capacity Analysis (2026): Bedroom Distribution
Distribution of Listings by Number of Bedrooms
Room Capacity Insights for Bodh Gaya
- The dominant room capacity in Bodh Gaya is 1 bedroom listings, making up 31.6% of the market. This suggests a strong demand for properties suitable for couples or solo travelers.
- Together, 1 bedroom and 5+ bedrooms properties represent 57.9% of the active Airbnb listings in Bodh Gaya, indicating a high concentration in these sizes.
- A significant 26.3% of listings offer 3+ bedrooms, catering to larger groups and families seeking more space in Bodh Gaya.
Bodh Gaya Vacation Rental Guest Capacity Trends (2026)
Distribution of Listings by Guest Capacity
Guest Capacity Insights for Bodh Gaya
- The most common guest capacity trend in Bodh Gaya vacation rentals is listings accommodating 2 guests (42.1%). This suggests the primary traveler segment is likely couples or solo travelers.
- Properties designed for 2 guests and 8+ guests dominate the Bodh Gaya STR market, accounting for 57.9% of listings.
- A significant 42.1% of listings cater specifically to 1-2 guests, highlighting strong demand from couples and solo travelers in Bodh Gaya.
- 26.3% of properties accommodate 6+ guests, serving the market segment for larger families or group travel in Bodh Gaya.
- On average, properties in Bodh Gaya are equipped to host 3.2 guests.
Bodh Gaya Airbnb Booking Patterns (2026): Available vs. Booked Days
Available Days Distribution
Booked Days Distribution
Booking Pattern Insights for Bodh Gaya
- The most common availability pattern in Bodh Gaya falls within the 271-366 days range, representing 89.5% of listings. This suggests many properties have significant open periods on their calendars.
- Approximately 94.8% of listings show high availability (181+ days open annually), indicating potential for increased bookings or specific owner usage patterns.
- For booked days, the 1-30 days range is most frequent in Bodh Gaya (47.4%), reflecting common guest stay durations or potential owner blocking patterns.
- A notable 5.3% of properties secure long booking periods (181+ days booked per year), highlighting successful long-term rental strategies or significant owner usage.
Bodh Gaya Airbnb Minimum Stay Requirements Analysis
Distribution of Listings by Minimum Night Requirement
1 Night
18 listings
94.7% of total
3 Nights
1 listings
5.3% of total
Key Insights
- The most prevalent minimum stay requirement in Bodh Gaya is 1 Night, adopted by 94.7% of listings. This highlights the market's preference for shorter, flexible bookings.
- A strong majority (94.7%) of the Bodh Gaya Airbnb data shows acceptance of very short stays (1-2 nights), indicating a dynamic, high-turnover market.
Recommendations
- Align with the market by considering a 1 Night minimum stay, as 94.7% of Bodh Gaya hosts use this setting.
- Adjust minimum nights based on seasonality – potentially shorter during low season and longer during peak demand periods in Bodh Gaya.
Bodh Gaya Airbnb Cancellation Policy Trends Analysis (2026)
Flexible
3 listings
33.3% of total
Moderate
2 listings
22.2% of total
Strict
4 listings
44.4% of total
Cancellation Policy Insights for Bodh Gaya
- The prevailing Airbnb cancellation policy trend in Bodh Gaya is Strict, used by 44.4% of listings.
- There's a relatively balanced mix between guest-friendly (55.5%) and stricter (44.4%) policies, offering choices for different guest needs.
Recommendations for Hosts
- Consider adopting a Strict policy to align with the 44.4% market standard in Bodh Gaya.
- With 44.4% using Strict terms, this is a viable option in Bodh Gaya, particularly for high-value properties or during peak demand periods.
- Regularly review your cancellation policy against competitors and market demand shifts in Bodh Gaya.
Bodh Gaya STR Booking Lead Time Analysis (2026)
Average Booking Lead Time by Month
Booking Lead Time Insights for Bodh Gaya
- The overall average booking lead time for vacation rentals in Bodh Gaya is 41 days.
- Guests book furthest in advance for stays during October (average 93 days), likely coinciding with peak travel demand or local events.
- The shortest booking windows occur for stays in June (average 0 days), indicating more last-minute travel plans during this time.
- Seasonally, Fall (60 days avg.) sees the longest lead times, while Summer (5 days avg.) has the shortest, reflecting typical travel planning cycles.
Recommendations for Hosts
- Use the overall average lead time (41 days) as a baseline for your pricing and availability strategy in Bodh Gaya.
- For October stays, consider implementing length-of-stay discounts or slightly higher rates for bookings made less than 93 days out to capitalize on advance planning.
- During June, focus on last-minute booking availability and promotions, as guests book with very short notice (0 days avg.).
- Target marketing efforts for the Fall season well in advance (at least 60 days) to capture early planners.
- Monitor your own booking lead times against these Bodh Gaya averages to identify opportunities for dynamic pricing adjustments.
Popular & Essential Airbnb Amenities in Bodh Gaya (2026)
Amenity Prevalence
Amenity Insights for Bodh Gaya
- Essential amenities in Bodh Gaya that guests expect include: Free parking on premises, Essentials, Wifi, Hot water. Lacking these (any) could significantly impact bookings.
- Popular amenities like Washer, Iron, Lock on bedroom door are common but not universal. Offering these can provide a competitive edge.
Recommendations for Hosts
- Ensure your listing includes all essential amenities for Bodh Gaya: Free parking on premises, Essentials, Wifi, Hot water.
- Consider adding popular differentiators like Washer or Iron to increase appeal.
- Highlight unique or less common amenities you offer (e.g., hot tub, dedicated workspace, EV charger) in your listing description and photos.
- Regularly check competitor amenities in Bodh Gaya to stay competitive.
Bodh Gaya Airbnb Guest Demographics & Profile Analysis (2026)
Guest Profile Summary for Bodh Gaya
- The typical guest profile for Airbnb in Bodh Gaya consists of a mix of domestic (35%) and international guests, with top international origins including United States, typically belonging to the Post-2000s (Gen Z/Alpha) group (50%), primarily speaking English or Hindi.
- Domestic travelers account for 35.1% of guests.
- Key international markets include India (35.1%) and United States (16.2%).
- Top languages spoken are English (41.8%) followed by Hindi (16.4%).
- A significant demographic segment is the Post-2000s (Gen Z/Alpha) group, representing 50% of guests.
Recommendations for Hosts
- Focus marketing internationally, particularly towards travelers from United States.
- Tailor amenities and listing descriptions to appeal to the dominant Post-2000s (Gen Z/Alpha) demographic (e.g., highlight fast WiFi, smart home features, local guides).
- Highlight unique local experiences or amenities relevant to the primary guest profile.
- Consider seasonal promotions aligned with peak travel times for key origin markets.
Nearby Short-Term Rental Market Comparison
How does the Bodh Gaya Airbnb market stack up against its neighbors? Compare key performance metrics like average monthly revenue, ADR, and occupancy rates in surrounding areas to understand the broader regional STR landscape.