Barheta Airbnb Market Analysis 2026: Short Term Rental Data & Vacation Rental Statistics in Himachal Pradesh, India
Is Airbnb profitable in Barheta in 2026? Explore comprehensive Airbnb analytics for Barheta, Himachal Pradesh, India to uncover income potential. This 2026 STR market report for Barheta, based on AirROI data from February 2025 to January 2026, reveals key trends in the niche market of 20 active listings.
Whether you're considering an Airbnb investment in Barheta, optimizing your existing vacation rental, or exploring rental arbitrage opportunities, understanding the Barheta Airbnb data is crucial. Leveraging the low regulation environment is key to maximizing your short term rental income potential. Let's dive into the specifics.
Key Barheta Airbnb Performance Metrics Overview
Monthly Airbnb Revenue Variations & Income Potential in Barheta (2026)
Understanding the monthly revenue variations for Airbnb listings in Barheta is key to maximizing your short term rental income potential. Seasonality significantly impacts earnings. Our analysis, based on data from the past 12 months, shows that the peak revenue month for STRs in Barheta is typically June, while July often presents the lowest earnings, highlighting opportunities for strategic pricing adjustments during shoulder and low seasons. Explore the typical Airbnb income in Barheta across different performance tiers:
- Best-in-class properties (Top 10%) achieve $2,267+ monthly, often utilizing dynamic pricing and superior guest experiences.
- Strong performing properties (Top 25%) earn $1,229 or more, indicating effective management and desirable locations/amenities.
- Typical properties (Median) generate around $307 per month, representing the average market performance.
- Entry-level properties (Bottom 25%) see earnings around $121, often with potential for optimization.
Average Monthly Airbnb Earnings Trend in Barheta
Barheta Airbnb Occupancy Rate Trends (2026)
Maximize your bookings by understanding the Barheta STR occupancy trends. Seasonal demand shifts significantly influence how often properties are booked. Typically, Decembersees the highest demand (peak season occupancy), while August experiences the lowest (low season). Effective strategies, like adjusting minimum stays or offering promotions, can boost occupancy during slower periods. Here's how different property tiers perform in Barheta:
- Best-in-class properties (Top 10%) achieve 29%+ occupancy, indicating high desirability and potentially optimized availability.
- Strong performing properties (Top 25%) maintain 23% or higher occupancy, suggesting good market fit and guest satisfaction.
- Typical properties (Median) have an occupancy rate around 14%.
- Entry-level properties (Bottom 25%) average 8% occupancy, potentially facing higher vacancy.
Average Monthly Occupancy Rate Trend in Barheta
Average Daily Rate (ADR) Airbnb Trends in Barheta (2026)
Effective short term rental pricing strategy in Barheta involves understanding monthly ADR fluctuations. The Average Daily Rate (ADR) for Airbnb in Barheta typically peaks in June and dips lowest during January. Leveraging Airbnb dynamic pricing tools or strategies based on this seasonality can significantly boost revenue. Here's a look at the typical nightly rates achieved:
- Best-in-class properties (Top 10%) command rates of $367+ per night, often due to premium features or locations.
- Strong performing properties (Top 25%) achieve nightly rates of $193 or more.
- Typical properties (Median) charge around $39 per night.
- Entry-level properties (Bottom 25%) earn around $27 per night.
Average Daily Rate (ADR) Trend by Month in Barheta
Get Live Barheta Market Intelligence 👇

Explore Real-time Analytics
Airbnb Seasonality Analysis & Trends in Barheta (2026)
Peak Season (June, March, May)
- Revenue averages $1,284 per month
- Occupancy rates average 22.2%
- Daily rates average $151
Shoulder Season
- Revenue averages $794 per month
- Occupancy maintains around 16.9%
- Daily rates hold near $128
Low Season (July, September, October)
- Revenue drops to average $299 per month
- Occupancy decreases to average 9.7%
- Daily rates adjust to average $128
Seasonality Insights for Barheta
- The Airbnb seasonality in Barheta shows highly seasonal trends requiring careful strategy. While the sections above show seasonal averages, it's also insightful to look at the extremes:
- During the high season, the absolute peak month showcases Barheta's highest earning potential, with monthly revenues capable of climbing to $1,342, occupancy reaching a high of 25.4%, and ADRs peaking at $162.
- Conversely, the slowest single month of the year, typically falling within the low season, marks the market's lowest point. In this month, revenue might dip to $273, occupancy could drop to 8.1%, and ADRs may adjust down to $116.
- Understanding both the seasonal averages and these monthly peaks and troughs in revenue, occupancy, and ADR is crucial for maximizing your Airbnb profit potential in Barheta.
Seasonal Strategies for Maximizing Profit
- Peak Season: Maximize revenue through premium pricing and potentially longer minimum stays. Ensure high availability.
- Low Season: Offer competitive pricing, special promotions (e.g., extended stay discounts), and flexible cancellation policies. Target off-season travelers like remote workers or budget-conscious guests.
- Shoulder Seasons: Implement dynamic pricing that balances peak and low rates. Target weekend travelers or specific events. Offer slightly more flexible terms than peak season.
- Regularly analyze your own performance against these Barheta seasonality benchmarks and adjust your pricing and availability strategy accordingly.
Best Areas for Airbnb Investment in Barheta (2026)
Exploring the top neighborhoods for short-term rentals in Barheta? This section highlights key areas, outlining why they are attractive for hosts and guests, along with notable local attractions. Consider these locations based on your target guest profile and investment strategy.
| Neighborhood / Area | Why Host Here? (Target Guests & Appeal) | Key Attractions & Landmarks |
|---|---|---|
| Manali | A popular tourist destination known for its stunning Himalayan landscapes, adventure sports, and vibrant culture. Ideal for tourists looking for tranquility and adventure alike. | Solang Valley, Hidimba Devi Temple, Manali Sanctuary, Old Manali, Rohtang Pass, Beas River |
| Shimla | The capital city of Himachal Pradesh, famous for its colonial architecture and scenic views. Attracts families and honeymooners seeking a romantic getaway or historical experience. | The Ridge, Mall Road, Jakhoo Temple, Christ Church, Kufri, Summer Hill |
| Kasol | A small village known for its stunning views of the Himalayas and vibrant backpacker culture. Popular among young travelers looking for a laid-back atmosphere and nature trekking. | Parvati River, Kheerganga trek, Malana Village, Kasol Market, Tosh Village, Chalal Village |
| Dharamshala | Home to the Dalai Lama and Tibetan culture, this town offers a spiritual retreat and is known for its beautiful landscapes and trekking opportunities. | McLeod Ganj, Bhagsu Waterfall, Namgyal Monastery, Triund Hill, Tsuglagkhang Complex, Dharamkot |
| Kullu | Famous for its lush green valleys and adventure activities, this area is a hub for camping and trekking enthusiasts. | Kullu Dussehra, Great Himalayan National Park, Beas Kund, Raghunath Temple, Kullu Valley, Bajaura |
| Billing | Known for being a paragliding hotspot, Billing attracts adventure seekers and nature lovers. Ideal for those who wish to experience thrilling activities amidst scenic views. | Paragliding, Bir Village, Chokling Monastery, Bhattu Monastery, Billing Paragliding site, Gunehar Waterfall |
| Narkanda | A quaint hill station offering breathtaking views and apple orchards. It attracts visitors looking for peace and nature, especially in winter for skiing. | Hatu Peak, Tannu Jubbar Lake, Narkanda Apple Orchards, Skiing slopes, Gudiya Temple, Kacheri |
| Chail | A beautiful hill station known for its colonial architecture, serene environment, and the highest cricket ground in the world. Popular among couples and families. | Chail Palace, Kali Ka Tibba, Chail Wildlife Sanctuary, Highest Cricket Ground, Chail Gurudwara, Mandir of Hanuman |
Understanding Airbnb License Requirements & STR Laws in Barheta (2026)
While Barheta, Himachal Pradesh, India currently shows low STR regulations, specific Airbnb license requirements might still exist or change. Always verify the latest short term rental regulations and Airbnb license requirements directly with local government authorities for Barheta to ensure full compliance before hosting.
(Source: AirROI data, 2026, finding no licensed listings among those analyzed)
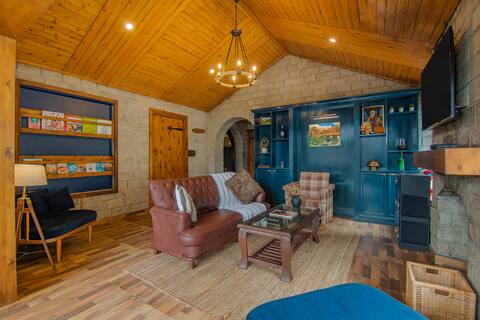
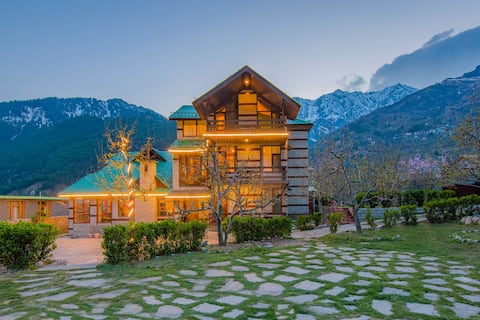
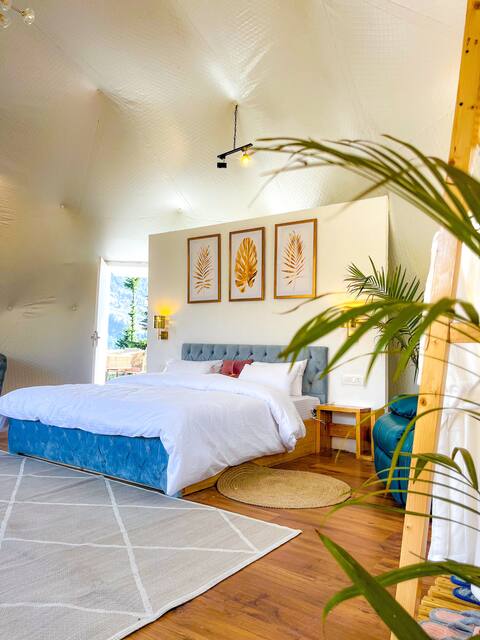
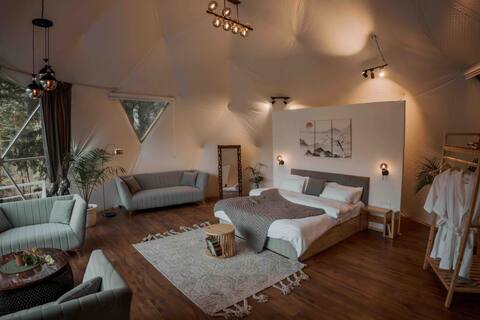
Top Performing Airbnb Properties in Barheta (2026)
Benchmark your potential! Explore examples of top-performing Airbnb properties in Barhetabased on Trailing Twelve Month (TTM) revenue. Analyze their characteristics, revenue, occupancy rate, and ADR to understand what drives success in this market.
Maple 3BR Lost in the Alps | Snow Views |StayVista
Private Room • 3 bedrooms
Lost in the Alps | 5BR RiverView Stay by StayVista
Entire Place • 5 bedrooms

5 BR Luxury Villa Close to Mall Road Manali W/Lawn
Entire Place • 5 bedrooms
Glamorous Presidential Suite
Private Room • 1 bedroom

Chalet Shanag Manali - 4 BR Chalet
Entire Place • 4 bedrooms
GlampView Luxurious Geodesic Glamp 2
Entire Place • 1 bedroom
Note: Performance varies based on location, size, amenities, seasonality, and management quality. Data reflects the past 12 months.
Top Performing Airbnb Hosts in Barheta (2026)
Learn from the best! This table showcases top-performing Airbnb hosts in Barheta based on the number of properties managed and estimated total revenue over the past year. Analyze their scale and performance metrics.
| Host Name | Properties | Grossing Revenue | Stay Reviews | Avg Rating |
|---|---|---|---|---|
| Navratan Singh | 3 | $29,511 | 3 | Not Rated |
| Gursimran | 1 | $21,162 | 1 | Not Rated |
| Harish | 1 | $18,899 | 6 | 4.83/5.0 |
| Manpreet | 1 | $18,139 | 4 | 5.00/5.0 |
| Rajesh | 3 | $14,780 | 43 | 4.61/5.0 |
| Sneh & Godwin | 3 | $4,750 | 370 | 4.79/5.0 |
| Mukesh | 1 | $2,680 | 18 | 5.00/5.0 |
| Akshay | 6 | $2,437 | 128 | 4.79/5.0 |
| True Stays | 1 | $2,071 | 22 | 4.86/5.0 |
Analyzing the strategies of top hosts, such as their property selection, pricing, and guest communication, can offer valuable lessons for optimizing your own Airbnb operations in Barheta.
Dive Deeper: Advanced Barheta STR Market Data (2026)
Ready to unlock more insights? AirROI provides access to advanced metrics and comprehensive Airbnb data for Barheta. Explore detailed analytics beyond this report to refine your investment strategy, optimize pricing, and maximize your vacation rental profits.
Explore Advanced MetricsBarheta Short-Term Rental Market Composition (2026): Property & Room Types
Room Type Distribution
Property Type Distribution
Market Composition Insights for Barheta
- The Barheta Airbnb market composition is heavily skewed towards Private Room listings, which make up 65% of the 20 active rentals. This indicates strong guest preference for privacy and space.
- Looking at the property type distribution in Barheta, House properties are the most common (55%), reflecting the local real estate landscape.
- Houses represent a significant 55% portion, catering likely to families or larger groups.
- The presence of 15% Hotel/Boutique listings indicates integration with traditional hospitality.
Barheta Airbnb Room Capacity Analysis (2026): Bedroom Distribution
Distribution of Listings by Number of Bedrooms
Room Capacity Insights for Barheta
- The dominant room capacity in Barheta is 1 bedroom listings, making up 30% of the market. This suggests a strong demand for properties suitable for couples or solo travelers.
- Together, 1 bedroom and 5+ bedrooms properties represent 40.0% of the active Airbnb listings in Barheta, indicating a high concentration in these sizes.
Barheta Vacation Rental Guest Capacity Trends (2026)
Distribution of Listings by Guest Capacity
Guest Capacity Insights for Barheta
- The most common guest capacity trend in Barheta vacation rentals is listings accommodating 8+ guests (15%). This suggests the primary traveler segment is likely larger groups.
- Properties designed for 8+ guests and 2 guests dominate the Barheta STR market, accounting for 30.0% of listings.
- 15.0% of properties accommodate 6+ guests, serving the market segment for larger families or group travel in Barheta.
- On average, properties in Barheta are equipped to host 2.1 guests.
Barheta Airbnb Booking Patterns (2026): Available vs. Booked Days
Available Days Distribution
Booked Days Distribution
Booking Pattern Insights for Barheta
- The most common availability pattern in Barheta falls within the 271-366 days range, representing 100% of listings. This suggests many properties have significant open periods on their calendars.
- Approximately 100.0% of listings show high availability (181+ days open annually), indicating potential for increased bookings or specific owner usage patterns.
- For booked days, the 1-30 days range is most frequent in Barheta (55%), reflecting common guest stay durations or potential owner blocking patterns.
Barheta Airbnb Minimum Stay Requirements Analysis
Distribution of Listings by Minimum Night Requirement
1 Night
12 listings
60% of total
2 Nights
6 listings
30% of total
30+ Nights
2 listings
10% of total
Key Insights
- The most prevalent minimum stay requirement in Barheta is 1 Night, adopted by 60% of listings. This highlights the market's preference for shorter, flexible bookings.
- A strong majority (90.0%) of the Barheta Airbnb data shows acceptance of very short stays (1-2 nights), indicating a dynamic, high-turnover market.
Recommendations
- Align with the market by considering a 1 Night minimum stay, as 60% of Barheta hosts use this setting.
- Explore offering discounts for stays of 30+ nights to attract the 10% of the market seeking extended stays.
- Adjust minimum nights based on seasonality – potentially shorter during low season and longer during peak demand periods in Barheta.
Barheta Airbnb Cancellation Policy Trends Analysis (2026)
Limited
1 listings
5% of total
Flexible
3 listings
15% of total
Moderate
1 listings
5% of total
Firm
11 listings
55% of total
Strict
4 listings
20% of total
Cancellation Policy Insights for Barheta
- The prevailing Airbnb cancellation policy trend in Barheta is Firm, used by 55% of listings.
- A majority (75.0%) of hosts in Barheta utilize Firm or Strict policies, indicating a market where hosts prioritize booking security.
Recommendations for Hosts
- Consider adopting a Firm policy to align with the 55% market standard in Barheta.
- Regularly review your cancellation policy against competitors and market demand shifts in Barheta.
Barheta STR Booking Lead Time Analysis (2026)
Average Booking Lead Time by Month
Booking Lead Time Insights for Barheta
- The overall average booking lead time for vacation rentals in Barheta is 19 days.
- Guests book furthest in advance for stays during October (average 48 days), likely coinciding with peak travel demand or local events.
- The shortest booking windows occur for stays in August (average 8 days), indicating more last-minute travel plans during this time.
- Seasonally, Fall (32 days avg.) sees the longest lead times, while Spring (17 days avg.) has the shortest, reflecting typical travel planning cycles.
Recommendations for Hosts
- Use the overall average lead time (19 days) as a baseline for your pricing and availability strategy in Barheta.
- For October stays, consider implementing length-of-stay discounts or slightly higher rates for bookings made less than 48 days out to capitalize on advance planning.
- During August, focus on last-minute booking availability and promotions, as guests book with very short notice (8 days avg.).
- Target marketing efforts for the Fall season well in advance (at least 32 days) to capture early planners.
- Monitor your own booking lead times against these Barheta averages to identify opportunities for dynamic pricing adjustments.
Popular & Essential Airbnb Amenities in Barheta (2026)
Amenity Prevalence
Amenity Insights for Barheta
- Essential amenities in Barheta that guests expect include: Iron, Free parking on premises, Wifi, Hot water, TV, Essentials, First aid kit. Lacking these (any) could significantly impact bookings.
- Popular amenities like Backyard, Shampoo, Hangers are common but not universal. Offering these can provide a competitive edge.
Recommendations for Hosts
- Ensure your listing includes all essential amenities for Barheta: Iron, Free parking on premises, Wifi, Hot water, TV, Essentials, First aid kit.
- Prioritize adding missing essentials: First aid kit.
- Consider adding popular differentiators like Backyard or Shampoo to increase appeal.
- Highlight unique or less common amenities you offer (e.g., hot tub, dedicated workspace, EV charger) in your listing description and photos.
- Regularly check competitor amenities in Barheta to stay competitive.
Barheta Airbnb Guest Demographics & Profile Analysis (2026)
Guest Profile Summary for Barheta
- The typical guest profile for Airbnb in Barheta consists of primarily domestic travelers (94%), often arriving from nearby Mumbai, typically belonging to the Post-2000s (Gen Z/Alpha) group (50%), primarily speaking English or Hindi.
- Domestic travelers account for 94.4% of guests.
- Key international markets include India (94.4%) and Poland (5.6%).
- Top languages spoken are English (46.7%) followed by Hindi (40%).
- A significant demographic segment is the Post-2000s (Gen Z/Alpha) group, representing 50% of guests.
Recommendations for Hosts
- Target domestic marketing efforts towards travelers from Mumbai and Delhi.
- Tailor amenities and listing descriptions to appeal to the dominant Post-2000s (Gen Z/Alpha) demographic (e.g., highlight fast WiFi, smart home features, local guides).
- Highlight unique local experiences or amenities relevant to the primary guest profile.
- Consider seasonal promotions aligned with peak travel times for key origin markets.
Nearby Short-Term Rental Market Comparison
How does the Barheta Airbnb market stack up against its neighbors? Compare key performance metrics like average monthly revenue, ADR, and occupancy rates in surrounding areas to understand the broader regional STR landscape.