Katra Airbnb Market Analysis 2026: Short Term Rental Data & Vacation Rental Statistics in Jammu and Kashmir, India
Is Airbnb profitable in Katra in 2026? Explore comprehensive Airbnb analytics for Katra, Jammu and Kashmir, India to uncover income potential. This 2026 STR market report for Katra, based on AirROI data from June 2024 to May 2025, reveals key trends in the niche market of 19 active listings.
Whether you're considering an Airbnb investment in Katra, optimizing your existing vacation rental, or exploring rental arbitrage opportunities, understanding the Katra Airbnb data is crucial. Navigating the high regulation landscape is key to maximizing your short term rental income potential. Let's dive into the specifics.
Key Katra Airbnb Performance Metrics Overview
Monthly Airbnb Revenue Variations & Income Potential in Katra (2026)
Understanding the monthly revenue variations for Airbnb listings in Katra is key to maximizing your short term rental income potential. Seasonality significantly impacts earnings. Our analysis, based on data from the past 12 months, shows that the peak revenue month for STRs in Katra is typically May, while June often presents the lowest earnings, highlighting opportunities for strategic pricing adjustments during shoulder and low seasons. Explore the typical Airbnb income in Katra across different performance tiers:
- Best-in-class properties (Top 10%) achieve $498+ monthly, often utilizing dynamic pricing and superior guest experiences.
- Strong performing properties (Top 25%) earn $367 or more, indicating effective management and desirable locations/amenities.
- Typical properties (Median) generate around $180 per month, representing the average market performance.
- Entry-level properties (Bottom 25%) see earnings around $98, often with potential for optimization.
Average Monthly Airbnb Earnings Trend in Katra
Katra Airbnb Occupancy Rate Trends (2026)
Maximize your bookings by understanding the Katra STR occupancy trends. Seasonal demand shifts significantly influence how often properties are booked. Typically, Aprilsees the highest demand (peak season occupancy), while July experiences the lowest (low season). Effective strategies, like adjusting minimum stays or offering promotions, can boost occupancy during slower periods. Here's how different property tiers perform in Katra:
- Best-in-class properties (Top 10%) achieve 19%+ occupancy, indicating high desirability and potentially optimized availability.
- Strong performing properties (Top 25%) maintain 11% or higher occupancy, suggesting good market fit and guest satisfaction.
- Typical properties (Median) have an occupancy rate around 9%.
- Entry-level properties (Bottom 25%) average 7% occupancy, potentially facing higher vacancy.
Average Monthly Occupancy Rate Trend in Katra
Average Daily Rate (ADR) Airbnb Trends in Katra (2026)
Effective short term rental pricing strategy in Katra involves understanding monthly ADR fluctuations. The Average Daily Rate (ADR) for Airbnb in Katra typically peaks in May and dips lowest during January. Leveraging Airbnb dynamic pricing tools or strategies based on this seasonality can significantly boost revenue. Here's a look at the typical nightly rates achieved:
- Best-in-class properties (Top 10%) command rates of $112+ per night, often due to premium features or locations.
- Strong performing properties (Top 25%) achieve nightly rates of $80 or more.
- Typical properties (Median) charge around $51 per night.
- Entry-level properties (Bottom 25%) earn around $30 per night.
Average Daily Rate (ADR) Trend by Month in Katra
Get Live Katra Market Intelligence 👇

Explore Real-time Analytics
Airbnb Seasonality Analysis & Trends in Katra (2025)
Peak Season (May, March, April)
- Revenue averages $481 per month
- Occupancy rates average 20.7%
- Daily rates average $64
Shoulder Season
- Revenue averages $190 per month
- Occupancy maintains around 7.7%
- Daily rates hold near $61
Low Season (January, June, August)
- Revenue drops to average $82 per month
- Occupancy decreases to average 4.8%
- Daily rates adjust to average $60
Seasonality Insights for Katra
- The Airbnb seasonality in Katra shows highly seasonal trends requiring careful strategy. While the sections above show seasonal averages, it's also insightful to look at the extremes:
- During the high season, the absolute peak month showcases Katra's highest earning potential, with monthly revenues capable of climbing to $628, occupancy reaching a high of 21.7%, and ADRs peaking at $66.
- Conversely, the slowest single month of the year, typically falling within the low season, marks the market's lowest point. In this month, revenue might dip to $27, occupancy could drop to 3.2%, and ADRs may adjust down to $58.
- Understanding both the seasonal averages and these monthly peaks and troughs in revenue, occupancy, and ADR is crucial for maximizing your Airbnb profit potential in Katra.
Seasonal Strategies for Maximizing Profit
- Peak Season: Maximize revenue through premium pricing and potentially longer minimum stays. Ensure high availability.
- Low Season: Offer competitive pricing, special promotions (e.g., extended stay discounts), and flexible cancellation policies. Target off-season travelers like remote workers or budget-conscious guests.
- Shoulder Seasons: Implement dynamic pricing that balances peak and low rates. Target weekend travelers or specific events. Offer slightly more flexible terms than peak season.
- Regularly analyze your own performance against these Katra seasonality benchmarks and adjust your pricing and availability strategy accordingly.
Best Areas for Airbnb Investment in Katra (2026)
Exploring the top neighborhoods for short-term rentals in Katra? This section highlights key areas, outlining why they are attractive for hosts and guests, along with notable local attractions. Consider these locations based on your target guest profile and investment strategy.
| Neighborhood / Area | Why Host Here? (Target Guests & Appeal) | Key Attractions & Landmarks |
|---|---|---|
| Vaishno Devi | A world-renowned pilgrimage site attracting millions of devotees and tourists annually. A perfect location for short-term stays catering to religious visitors seeking convenient access to the shrine. | Vaishno Devi Temple, Ardhkuwari Cave, Bhawan Temple, Bhairo Baba Temple, Shivalik Hills |
| Katra Main Market | The bustling heart of Katra, offering shopping and dining options. Great for tourists looking for convenience and local culture, making it an attractive Airbnb spot. | Katra Market, local eateries, shopping stalls, nearby temples |
| Banganga | A serene and scenic area in Katra offering tranquility and beautiful views, ideal for guests seeking a peaceful retreat while being close to the main attractions. | Banganga River, beautiful landscapes, nature walks |
| Dhanori | A quiet village near Katra, perfect for those looking to experience rural hospitality and stunning natural scenery, while being just a short distance from urban conveniences. | scenic views, cultural experiences, local festivals |
| Katra Old Town | Rich in history and culture, this area offers traditional architecture and a glimpse into local life, attracting tourists who appreciate heritage and local charm. | historic temples, old markets, cultural sites |
| Jammu Road | The main road leading to Katra, bustling with activity and easy access to transportation and amenities, appealing to travelers seeking convenience. | transport hubs, local shops, restaurants |
| Shiv Khori | Famous for the Shiv Khori Cave, this area attracts pilgrims and tourists looking to explore religious sites outside of Katra, great for niche Airbnb offerings. | Shiv Khori Cave, natural scenery, hiking trails |
| Trikuta Mountains | Offers stunning natural beauty and trekking opportunities, appealing to adventure seekers and nature lovers looking to stay close to Katra. | trekking spots, panoramic views, natural parks |
Understanding Airbnb License Requirements & STR Laws in Katra (2026)
Yes, Katra, Jammu and Kashmir, India enforces high STR regulations. Obtaining a license and ensuring compliance is almost certainly required according to current 2026 STR laws. Always verify the latest short term rental regulations and Airbnb license requirements directly with local government authorities for Katra to ensure full compliance before hosting.
(Source: AirROI data, 2026, based on 53% licensed listings)
Top Performing Airbnb Properties in Katra (2026)
Benchmark your potential! Explore examples of top-performing Airbnb properties in Katrabased on Trailing Twelve Month (TTM) revenue. Analyze their characteristics, revenue, occupancy rate, and ADR to understand what drives success in this market.

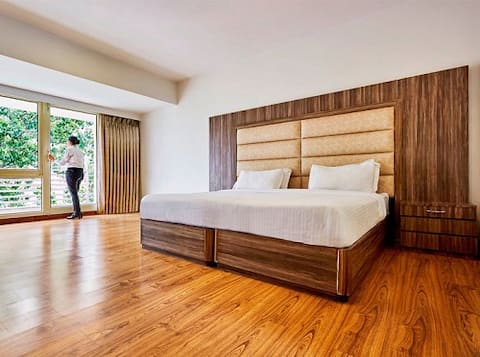
Coco Homes Katra - Luxury Stay near Vaishno Devi
Entire Place • 2 bedrooms

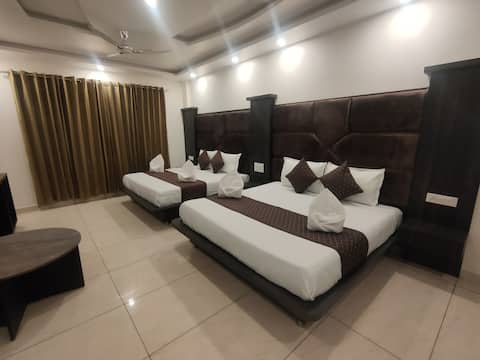
Superior Room
Private Room • 12 bedrooms
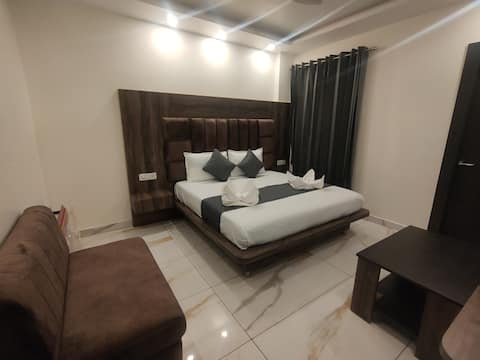
Royal Triple Room|Hotel Rama Trident
Private Room • 1 bedroom
Quadruple Room
Private Room • 3 bedrooms

Triple Room
Private Room • 3 bedrooms
Deluxe Room
Private Room • 9 bedrooms
Note: Performance varies based on location, size, amenities, seasonality, and management quality. Data reflects the past 12 months.
Top Performing Airbnb Hosts in Katra (2026)
Learn from the best! This table showcases top-performing Airbnb hosts in Katra based on the number of properties managed and estimated total revenue over the past year. Analyze their scale and performance metrics.
| Host Name | Properties | Grossing Revenue | Stay Reviews | Avg Rating |
|---|---|---|---|---|
| Mayank | 11 | $9,990 | 10 | 5.00/5.0 |
| Keshav | 1 | $6,225 | 4 | 4.75/5.0 |
| Raj | 1 | $1,191 | 3 | 5.00/5.0 |
| Vikram | 1 | $623 | 10 | 4.30/5.0 |
| GetRoomBookings | 3 | $605 | 0 | Not Rated |
| Amandeep | 2 | $278 | 29 | 4.32/5.0 |
Analyzing the strategies of top hosts, such as their property selection, pricing, and guest communication, can offer valuable lessons for optimizing your own Airbnb operations in Katra.
Dive Deeper: Advanced Katra STR Market Data (2026)
Ready to unlock more insights? AirROI provides access to advanced metrics and comprehensive Airbnb data for Katra. Explore detailed analytics beyond this report to refine your investment strategy, optimize pricing, and maximize your vacation rental profits.
Explore Advanced MetricsKatra Short-Term Rental Market Composition (2026): Property & Room Types
Room Type Distribution
Property Type Distribution
Market Composition Insights for Katra
- The Katra Airbnb market composition is heavily skewed towards Private Room listings, which make up 94.7% of the 19 active rentals. This indicates strong guest preference for privacy and space.
- Looking at the property type distribution in Katra, Hotel/Boutique properties are the most common (94.7%), reflecting the local real estate landscape.
- The presence of 94.7% Hotel/Boutique listings indicates integration with traditional hospitality.
Katra Airbnb Room Capacity Analysis (2026): Bedroom Distribution
Distribution of Listings by Number of Bedrooms
Room Capacity Insights for Katra
- The dominant room capacity in Katra is 1 bedroom listings, making up 47.4% of the market. This suggests a strong demand for properties suitable for couples or solo travelers.
- Together, 1 bedroom and 5+ bedrooms properties represent 79.0% of the active Airbnb listings in Katra, indicating a high concentration in these sizes.
- A significant 47.4% of listings offer 3+ bedrooms, catering to larger groups and families seeking more space in Katra.
Katra Vacation Rental Guest Capacity Trends (2026)
Distribution of Listings by Guest Capacity
Guest Capacity Insights for Katra
- The most common guest capacity trend in Katra vacation rentals is listings accommodating 4 guests (31.6%). This suggests the primary traveler segment is likely small families or groups.
- Properties designed for 4 guests and 5 guests dominate the Katra STR market, accounting for 47.4% of listings.
- 26.3% of properties accommodate 6+ guests, serving the market segment for larger families or group travel in Katra.
- On average, properties in Katra are equipped to host 4.6 guests.
Katra Airbnb Booking Patterns (2026): Available vs. Booked Days
Available Days Distribution
Booked Days Distribution
Booking Pattern Insights for Katra
- The most common availability pattern in Katra falls within the 271-366 days range, representing 100% of listings. This suggests many properties have significant open periods on their calendars.
- Approximately 100.0% of listings show high availability (181+ days open annually), indicating potential for increased bookings or specific owner usage patterns.
- For booked days, the 1-30 days range is most frequent in Katra (89.5%), reflecting common guest stay durations or potential owner blocking patterns.
Katra Airbnb Minimum Stay Requirements Analysis
Distribution of Listings by Minimum Night Requirement
1 Night
19 listings
100% of total
Key Insights
- The most prevalent minimum stay requirement in Katra is 1 Night, adopted by 100% of listings. This highlights the market's preference for shorter, flexible bookings.
- A strong majority (100.0%) of the Katra Airbnb data shows acceptance of very short stays (1-2 nights), indicating a dynamic, high-turnover market.
Recommendations
- Align with the market by considering a 1 Night minimum stay, as 100% of Katra hosts use this setting.
- Adjust minimum nights based on seasonality – potentially shorter during low season and longer during peak demand periods in Katra.
Katra Airbnb Cancellation Policy Trends Analysis (2026)
Flexible
3 listings
15.8% of total
Moderate
5 listings
26.3% of total
Strict
11 listings
57.9% of total
Cancellation Policy Insights for Katra
- The prevailing Airbnb cancellation policy trend in Katra is Strict, used by 57.9% of listings.
- A majority (57.9%) of hosts in Katra utilize Firm or Strict policies, indicating a market where hosts prioritize booking security.
Recommendations for Hosts
- Consider adopting a Strict policy to align with the 57.9% market standard in Katra.
- With 57.9% using Strict terms, this is a viable option in Katra, particularly for high-value properties or during peak demand periods.
- Regularly review your cancellation policy against competitors and market demand shifts in Katra.
Katra STR Booking Lead Time Analysis (2026)
Average Booking Lead Time by Month
Booking Lead Time Insights for Katra
- The overall average booking lead time for vacation rentals in Katra is 16 days.
- Guests book furthest in advance for stays during May (average 40 days), likely coinciding with peak travel demand or local events.
- The shortest booking windows occur for stays in July (average 0 days), indicating more last-minute travel plans during this time.
- Seasonally, Spring (24 days avg.) sees the longest lead times, while Summer (1 days avg.) has the shortest, reflecting typical travel planning cycles.
Recommendations for Hosts
- Use the overall average lead time (16 days) as a baseline for your pricing and availability strategy in Katra.
- For May stays, consider implementing length-of-stay discounts or slightly higher rates for bookings made less than 40 days out to capitalize on advance planning.
- During July, focus on last-minute booking availability and promotions, as guests book with very short notice (0 days avg.).
- Target marketing efforts for the Spring season well in advance (at least 24 days) to capture early planners.
- Monitor your own booking lead times against these Katra averages to identify opportunities for dynamic pricing adjustments.
Popular & Essential Airbnb Amenities in Katra (2026)
Amenity Prevalence
Amenity Insights for Katra
- Essential amenities in Katra that guests expect include: Air conditioning, TV, Wifi. Lacking these (any) could significantly impact bookings.
- Popular amenities like Hot water, Heating, Essentials are common but not universal. Offering these can provide a competitive edge.
Recommendations for Hosts
- Ensure your listing includes all essential amenities for Katra: Air conditioning, TV, Wifi.
- Consider adding popular differentiators like Hot water or Heating to increase appeal.
- Highlight unique or less common amenities you offer (e.g., hot tub, dedicated workspace, EV charger) in your listing description and photos.
- Regularly check competitor amenities in Katra to stay competitive.
Katra Airbnb Guest Demographics & Profile Analysis (2026)
Guest Profile Summary for Katra
- The typical guest profile for Airbnb in Katra consists of primarily domestic travelers (100%), often arriving from nearby Delhi, typically belonging to the Post-2000s (Gen Z/Alpha) group (50%), primarily speaking Hindi or English.
- Domestic travelers account for 100.0% of guests.
- Top languages spoken are Hindi (46.7%) followed by English (46.7%).
- A significant demographic segment is the Post-2000s (Gen Z/Alpha) group, representing 50% of guests.
Recommendations for Hosts
- Target domestic marketing efforts towards travelers from Delhi and Dehradun.
- Tailor amenities and listing descriptions to appeal to the dominant Post-2000s (Gen Z/Alpha) demographic (e.g., highlight fast WiFi, smart home features, local guides).
- Highlight unique local experiences or amenities relevant to the primary guest profile.
- Consider seasonal promotions aligned with peak travel times for key origin markets.
Nearby Short-Term Rental Market Comparison
How does the Katra Airbnb market stack up against its neighbors? Compare key performance metrics like average monthly revenue, ADR, and occupancy rates in surrounding areas to understand the broader regional STR landscape.
| Market | Active Properties | Monthly Revenue | Daily Rate | Avg. Occupancy |
|---|---|---|---|---|
| Gumtala | 11 | $836 | $147.41 | 27% |
| Barrian | 17 | $718 | $156.05 | 21% |
| Kamboh | 13 | $657 | $160.15 | 25% |
| Mananwala Khurd | 16 | $621 | $160.12 | 21% |
| Dalhousie | 71 | $373 | $99.29 | 21% |
| Murree Tehsil | 16 | $351 | $90.51 | 20% |
| Jhugian Alfa | 19 | $318 | $46.97 | 31% |
| Charr | 22 | $315 | $88.86 | 25% |
| Roranwala | 23 | $312 | $64.19 | 30% |
| Blue Area | 22 | $292 | $49.56 | 28% |