Pahalgam Airbnb Market Analysis 2026: Short Term Rental Data & Vacation Rental Statistics in Jammu and Kashmir, India
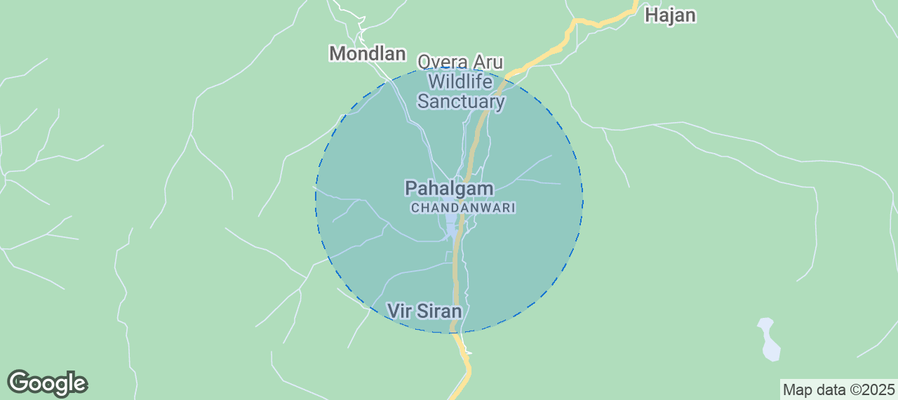
Is Airbnb profitable in Pahalgam in 2026? Explore comprehensive Airbnb analytics for Pahalgam, Jammu and Kashmir, India to uncover income potential. This 2026 STR market report for Pahalgam, based on AirROI data from May 2024 to April 2025, reveals key trends in the niche market of 24 active listings.
Whether you're considering an Airbnb investment in Pahalgam, optimizing your existing vacation rental, or exploring rental arbitrage opportunities, understanding the Pahalgam Airbnb data is crucial. Leveraging the low regulation environment is key to maximizing your short term rental income potential. Let's dive into the specifics.
Key Pahalgam Airbnb Performance Metrics Overview
Monthly Airbnb Revenue Variations & Income Potential in Pahalgam (2026)
Understanding the monthly revenue variations for Airbnb listings in Pahalgam is key to maximizing your short term rental income potential. Seasonality significantly impacts earnings. Our analysis, based on data from the past 12 months, shows that the peak revenue month for STRs in Pahalgam is typically August, while December often presents the lowest earnings, highlighting opportunities for strategic pricing adjustments during shoulder and low seasons. Explore the typical Airbnb income in Pahalgam across different performance tiers:
- Best-in-class properties (Top 10%) achieve $7,267+ monthly, often utilizing dynamic pricing and superior guest experiences.
- Strong performing properties (Top 25%) earn $4,031 or more, indicating effective management and desirable locations/amenities.
- Typical properties (Median) generate around $1,148 per month, representing the average market performance.
- Entry-level properties (Bottom 25%) see earnings around $581, often with potential for optimization.
Average Monthly Airbnb Earnings Trend in Pahalgam
Pahalgam Airbnb Occupancy Rate Trends (2026)
Maximize your bookings by understanding the Pahalgam STR occupancy trends. Seasonal demand shifts significantly influence how often properties are booked. Typically, Maysees the highest demand (peak season occupancy), while November experiences the lowest (low season). Effective strategies, like adjusting minimum stays or offering promotions, can boost occupancy during slower periods. Here's how different property tiers perform in Pahalgam:
- Best-in-class properties (Top 10%) achieve 55%+ occupancy, indicating high desirability and potentially optimized availability.
- Strong performing properties (Top 25%) maintain 37% or higher occupancy, suggesting good market fit and guest satisfaction.
- Typical properties (Median) have an occupancy rate around 14%.
- Entry-level properties (Bottom 25%) average 9% occupancy, potentially facing higher vacancy.
Average Monthly Occupancy Rate Trend in Pahalgam
Average Daily Rate (ADR) Airbnb Trends in Pahalgam (2026)
Effective short term rental pricing strategy in Pahalgam involves understanding monthly ADR fluctuations. The Average Daily Rate (ADR) for Airbnb in Pahalgam typically peaks in December and dips lowest during November. Leveraging Airbnb dynamic pricing tools or strategies based on this seasonality can significantly boost revenue. Here's a look at the typical nightly rates achieved:
- Best-in-class properties (Top 10%) command rates of $349+ per night, often due to premium features or locations.
- Strong performing properties (Top 25%) achieve nightly rates of $129 or more.
- Typical properties (Median) charge around $36 per night.
- Entry-level properties (Bottom 25%) earn around $23 per night.
Average Daily Rate (ADR) Trend by Month in Pahalgam
Get Live Pahalgam Market Intelligence 👇
Explore Real-time Analytics
Airbnb Seasonality Analysis & Trends in Pahalgam (2025)
Peak Season (August, January, May)
- Revenue averages $3,950 per month
- Occupancy rates average 27.6%
- Daily rates average $119
Shoulder Season
- Revenue averages $2,898 per month
- Occupancy maintains around 21.9%
- Daily rates hold near $114
Low Season (February, March, December)
- Revenue drops to average $1,282 per month
- Occupancy decreases to average 28.9%
- Daily rates adjust to average $131
Seasonality Insights for Pahalgam
- The Airbnb seasonality in Pahalgam shows highly seasonal trends requiring careful strategy. While the sections above show seasonal averages, it's also insightful to look at the extremes:
- During the high season, the absolute peak month showcases Pahalgam's highest earning potential, with monthly revenues capable of climbing to $4,060, occupancy reaching a high of 44.1%, and ADRs peaking at $139.
- Conversely, the slowest single month of the year, typically falling within the low season, marks the market's lowest point. In this month, revenue might dip to $544, occupancy could drop to 12.9%, and ADRs may adjust down to $109.
- Understanding both the seasonal averages and these monthly peaks and troughs in revenue, occupancy, and ADR is crucial for maximizing your Airbnb profit potential in Pahalgam.
Seasonal Strategies for Maximizing Profit
- Peak Season: Maximize revenue through premium pricing and potentially longer minimum stays. Ensure high availability.
- Low Season: Offer competitive pricing, special promotions (e.g., extended stay discounts), and flexible cancellation policies. Target off-season travelers like remote workers or budget-conscious guests.
- Shoulder Seasons: Implement dynamic pricing that balances peak and low rates. Target weekend travelers or specific events. Offer slightly more flexible terms than peak season.
- Regularly analyze your own performance against these Pahalgam seasonality benchmarks and adjust your pricing and availability strategy accordingly.
Best Areas for Airbnb Investment in Pahalgam (2026)
Exploring the top neighborhoods for short-term rentals in Pahalgam? This section highlights key areas, outlining why they are attractive for hosts and guests, along with notable local attractions. Consider these locations based on your target guest profile and investment strategy.
| Neighborhood / Area | Why Host Here? (Target Guests & Appeal) | Key Attractions & Landmarks |
|---|---|---|
| Betaab Valley | Famous for its stunning landscapes and lush greenery, Betaab Valley attracts nature lovers and adventure enthusiasts. It offers breathtaking views and is ideal for outdoor activities. | Betaab Valley Park, Pahalgam Golf Course, Horse Riding, Trekking Trails, Lidder River Rafting |
| Aru Valley | Known for its scenic beauty and serene environment, Aru Valley is a great spot for tourists looking for leisure and tranquility. It is also the starting point for several treks in the region. | Aru Nature Park, Trekking to Tarsar Marsar, Aru Glacier, Mini Switzerland, Pahalgam Valley Views |
| Baisaran | Often referred to as 'Mini Switzerland', Baisaran is famous for its meadows and an ideal location for picnics and family outings. Its picturesque scenery attracts many tourists. | Baisaran Meadows, Horse Riding, Photography Spots, Local Cuisine, Scenic Views |
| Pahalgam City Centre | The city center of Pahalgam offers easy access to shops, restaurants, and local markets, making it popular among visitors who want convenience and local experiences. | Pahalgam Market, Local Handicrafts, Restaurants, Lidder River, Cultural Experiences |
| Lidderwat | A serene location perfect for trekking and camping, Lidderwat is a less commercialized area that appeals to adventurous travelers looking for offbeat experiences. | Trekking Routes, Camping Sites, Wildlife Spotting, Tranquil Environment, Natural Hot Springs |
| Sheshnag Lake | A beautiful alpine lake that is popular among trekkers and nature enthusiasts. Its stunning landscape is a must-visit for anyone seeking natural beauty. | Sheshnag Lake Trek, Fishing, Photography, Wildflower Views, Alpine Flora |
| Kolhi Valley | Famed for its unique culture and scenic beauty, Kolhi Valley offers a blend of local traditions and natural wonders, attracting culturally-minded travelers. | Local Villages, Cultural Tours, Hiking Trails, Scenic Landscapes, Wildlife Encounters |
| Chandanwari | The starting point of the famous Amarnath Yatra pilgrimage, Chandanwari also attracts tourists for its scenic views and snow-capped mountains. | Amarnath Cave, Trekking to Amarnath, Snow Activities, Scenic Outlooks, Local Flora and Fauna |
Understanding Airbnb License Requirements & STR Laws in Pahalgam (2026)
While Pahalgam, Jammu and Kashmir, India currently shows low STR regulations, specific Airbnb license requirements might still exist or change. Always verify the latest short term rental regulations and Airbnb license requirements directly with local government authorities for Pahalgam to ensure full compliance before hosting.
(Source: AirROI data, 2026, finding no licensed listings among those analyzed)
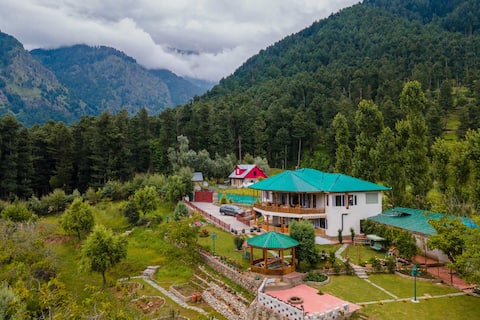
Top Performing Airbnb Properties in Pahalgam (2026)
Benchmark your potential! Explore examples of top-performing Airbnb properties in Pahalgambased on Trailing Twelve Month (TTM) revenue. Analyze their characteristics, revenue, occupancy rate, and ADR to understand what drives success in this market.

StayVista at Kudrath w/ Lawn, Mountain View
Entire Place • 5 bedrooms
StayVista at Shaahi @ Kudrath w/ Lawn
Private Room • 3 bedrooms
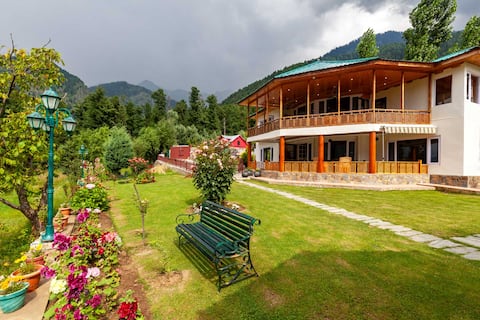
StayVista at Zaina @ Kudrath w/ Lawn, Mountain
Private Room • 2 bedrooms

Aru Valley view room- Pahalgam cottage
Private Room • 5 bedrooms

Riverside Burj Cottage
Entire Place • 1 bedroom
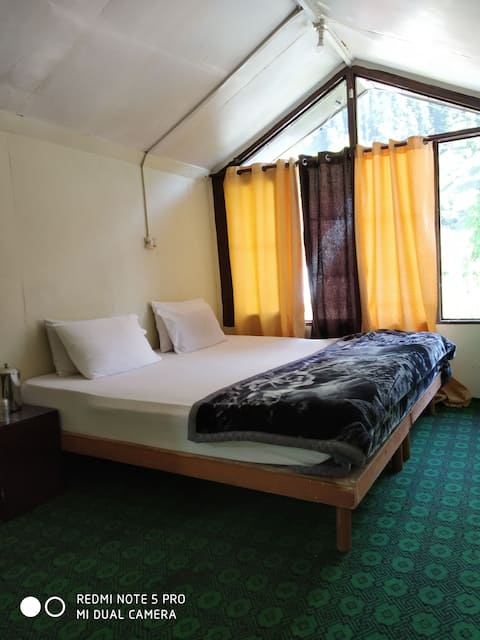
Couple room
Private Room • 1 bedroom
Note: Performance varies based on location, size, amenities, seasonality, and management quality. Data reflects the past 12 months.
Top Performing Airbnb Hosts in Pahalgam (2026)
Learn from the best! This table showcases top-performing Airbnb hosts in Pahalgam based on the number of properties managed and estimated total revenue over the past year. Analyze their scale and performance metrics.
| Host Name | Properties | Grossing Revenue | Stay Reviews | Avg Rating |
|---|---|---|---|---|
| Host #515298538 | 3 | $254,644 | 0 | 0.00/5.0 |
| Host #63026336 | 1 | $10,380 | 0 | 0.00/5.0 |
| Rameez | 6 | $9,071 | 6 | 0.72/5.0 |
| Muzaffar | 4 | $7,021 | 28 | 1.21/5.0 |
| Host #189938931 | 1 | $4,666 | 0 | 0.00/5.0 |
| Host #449038544 | 1 | $2,302 | 0 | 0.00/5.0 |
| Abdul | 1 | $2,144 | 3 | 5.00/5.0 |
| Host #406494247 | 1 | $2,092 | 0 | 0.00/5.0 |
| Host #471980752 | 1 | $2,080 | 0 | 0.00/5.0 |
| Dreamhills Homestay | 1 | $1,859 | 22 | 4.32/5.0 |
Analyzing the strategies of top hosts, such as their property selection, pricing, and guest communication, can offer valuable lessons for optimizing your own Airbnb operations in Pahalgam.
Dive Deeper: Advanced Pahalgam STR Market Data (2026)
Ready to unlock more insights? AirROI provides access to advanced metrics and comprehensive Airbnb data for Pahalgam. Explore detailed analytics beyond this report to refine your investment strategy, optimize pricing, and maximize your vacation rental profits.
Explore Advanced MetricsPahalgam Short-Term Rental Market Composition (2026): Property & Room Types
Room Type Distribution
Property Type Distribution
Market Composition Insights for Pahalgam
- The Pahalgam Airbnb market composition is heavily skewed towards Private Room listings, which make up 83.3% of the 24 active rentals. This indicates strong guest preference for privacy and space.
- Looking at the property type distribution in Pahalgam, House properties are the most common (50%), reflecting the local real estate landscape.
- Houses represent a significant 50% portion, catering likely to families or larger groups.
- The presence of 33.3% Hotel/Boutique listings indicates integration with traditional hospitality.
Pahalgam Airbnb Room Capacity Analysis (2026): Bedroom Distribution
Distribution of Listings by Number of Bedrooms
Room Capacity Insights for Pahalgam
- The dominant room capacity in Pahalgam is 1 bedroom listings, making up 54.2% of the market. This suggests a strong demand for properties suitable for couples or solo travelers.
- Together, 1 bedroom and 5+ bedrooms properties represent 83.4% of the active Airbnb listings in Pahalgam, indicating a high concentration in these sizes.
- With over half the market (54.2%) consisting of studios or 1-bedroom units, Pahalgam is particularly well-suited for individuals or couples.
- A significant 41.7% of listings offer 3+ bedrooms, catering to larger groups and families seeking more space in Pahalgam.
Pahalgam Vacation Rental Guest Capacity Trends (2026)
Distribution of Listings by Guest Capacity
Guest Capacity Insights for Pahalgam
- The most common guest capacity trend in Pahalgam vacation rentals is listings accommodating 2 guests (54.2%). This suggests the primary traveler segment is likely couples or solo travelers.
- Properties designed for 2 guests and 8+ guests dominate the Pahalgam STR market, accounting for 66.7% of listings.
- A significant 54.2% of listings cater specifically to 1-2 guests, highlighting strong demand from couples and solo travelers in Pahalgam.
- 16.7% of properties accommodate 6+ guests, serving the market segment for larger families or group travel in Pahalgam.
- On average, properties in Pahalgam are equipped to host 3.0 guests.
Pahalgam Airbnb Booking Patterns (2026): Available vs. Booked Days
Available Days Distribution
Booked Days Distribution
Booking Pattern Insights for Pahalgam
- The most common availability pattern in Pahalgam falls within the 271-366 days range, representing 87.5% of listings. This suggests many properties have significant open periods on their calendars.
- Approximately 100.0% of listings show high availability (181+ days open annually), indicating potential for increased bookings or specific owner usage patterns.
- For booked days, the 31-90 days range is most frequent in Pahalgam (70.8%), reflecting common guest stay durations or potential owner blocking patterns.
Pahalgam Airbnb Minimum Stay Requirements Analysis
Distribution of Listings by Minimum Night Requirement
1 Night
17 listings
94.4% of total
2 Nights
1 listings
5.6% of total
Key Insights
- The most prevalent minimum stay requirement in Pahalgam is 1 Night, adopted by 94.4% of listings. This highlights the market's preference for shorter, flexible bookings.
- A strong majority (100.0%) of the Pahalgam Airbnb data shows acceptance of very short stays (1-2 nights), indicating a dynamic, high-turnover market.
Recommendations
- Align with the market by considering a 1 Night minimum stay, as 94.4% of Pahalgam hosts use this setting.
- Adjust minimum nights based on seasonality – potentially shorter during low season and longer during peak demand periods in Pahalgam.
Pahalgam Airbnb Cancellation Policy Trends Analysis (2026)
Flexible
3 listings
37.5% of total
Moderate
4 listings
50% of total
Strict
1 listings
12.5% of total
Cancellation Policy Insights for Pahalgam
- The prevailing Airbnb cancellation policy trend in Pahalgam is Moderate, used by 50% of listings.
- The market strongly favors guest-friendly terms, with 87.5% of listings offering Flexible or Moderate policies. This suggests guests in Pahalgam may expect booking flexibility.
Recommendations for Hosts
- Consider adopting a Moderate policy to align with the 50% market standard in Pahalgam.
- Using a Strict policy might deter some guests, as only 12.5% of listings use it. Evaluate if potential revenue protection outweighs possible lower booking rates.
- Regularly review your cancellation policy against competitors and market demand shifts in Pahalgam.
Pahalgam STR Booking Lead Time Analysis (2026)
Average Booking Lead Time by Month
Booking Lead Time Insights for Pahalgam
- The overall average booking lead time for vacation rentals in Pahalgam is 24 days.
- Guests book furthest in advance for stays during December (average 69 days), likely coinciding with peak travel demand or local events.
- The shortest booking windows occur for stays in June (average 5 days), indicating more last-minute travel plans during this time.
- Seasonally, Winter (38 days avg.) sees the longest lead times, while Summer (12 days avg.) has the shortest, reflecting typical travel planning cycles.
Recommendations for Hosts
- Use the overall average lead time (24 days) as a baseline for your pricing and availability strategy in Pahalgam.
- For December stays, consider implementing length-of-stay discounts or slightly higher rates for bookings made less than 69 days out to capitalize on advance planning.
- During June, focus on last-minute booking availability and promotions, as guests book with very short notice (5 days avg.).
- Target marketing efforts for the Winter season well in advance (at least 38 days) to capture early planners.
- Monitor your own booking lead times against these Pahalgam averages to identify opportunities for dynamic pricing adjustments.
Popular & Essential Airbnb Amenities in Pahalgam (2026)
Amenity Prevalence
Amenity Insights for Pahalgam
- Essential amenities in Pahalgam that guests expect include: Wifi. Lacking these (this) could significantly impact bookings.
- Popular amenities like TV, Essentials, Hot water are common but not universal. Offering these can provide a competitive edge.
Recommendations for Hosts
- Ensure your listing includes all essential amenities for Pahalgam: Wifi.
- Consider adding popular differentiators like TV or Essentials to increase appeal.
- Highlight unique or less common amenities you offer (e.g., hot tub, dedicated workspace, EV charger) in your listing description and photos.
- Regularly check competitor amenities in Pahalgam to stay competitive.
Pahalgam Airbnb Guest Demographics & Profile Analysis (2026)
Guest Profile Summary for Pahalgam
- The typical guest profile for Airbnb in Pahalgam consists of primarily domestic travelers (100%), often arriving from nearby Mumbai, typically belonging to the Post-2000s (Gen Z/Alpha) group (50%), primarily speaking English or Hindi.
- Domestic travelers account for 100.0% of guests.
- Top languages spoken are English (37.5%) followed by Hindi (37.5%).
- A significant demographic segment is the Post-2000s (Gen Z/Alpha) group, representing 50% of guests.
Recommendations for Hosts
- Target domestic marketing efforts towards travelers from Mumbai and Delhi.
- Tailor amenities and listing descriptions to appeal to the dominant Post-2000s (Gen Z/Alpha) demographic (e.g., highlight fast WiFi, smart home features, local guides).
- Highlight unique local experiences or amenities relevant to the primary guest profile.
- Consider seasonal promotions aligned with peak travel times for key origin markets.
Nearby Short-Term Rental Market Comparison
How does the Pahalgam Airbnb market stack up against its neighbors? Compare key performance metrics like average monthly revenue, ADR, and occupancy rates in surrounding areas to understand the broader regional STR landscape.
| Market | Active Properties | Monthly Revenue | Daily Rate | Avg. Occupancy |
|---|---|---|---|---|
| Tangmarg | 20 | $3,602 | $433.25 | 24% |
| Tailbal(Habak Shanpora) | 27 | $650 | $73.55 | 26% |
| Srinagar | 376 | $616 | $83.72 | 25% |
| Kasal Morh | 15 | $434 | $95.16 | 16% |
| Gamba Tehsil | 18 | $288 | $49.81 | 25% |
| Skardu | 30 | $277 | $45.65 | 25% |
| Gamba | 16 | $263 | $47.73 | 20% |
| Gilgit | 16 | $231 | $39.44 | 26% |
| Skardu Tehsil | 21 | $227 | $40.81 | 23% |
| Domkhar | 15 | $76 | $13.37 | 22% |