Belagavi Airbnb Market Analysis 2026: Short Term Rental Data & Vacation Rental Statistics in Karnataka, India
Is Airbnb profitable in Belagavi in 2026? Explore comprehensive Airbnb analytics for Belagavi, Karnataka, India to uncover income potential. This 2026 STR market report for Belagavi, based on AirROI data from February 2025 to January 2026, reveals key trends in the niche market of 26 active listings.
Whether you're considering an Airbnb investment in Belagavi, optimizing your existing vacation rental, or exploring rental arbitrage opportunities, understanding the Belagavi Airbnb data is crucial. Leveraging the low regulation environment is key to maximizing your short term rental income potential. Let's dive into the specifics.
Key Belagavi Airbnb Performance Metrics Overview
Monthly Airbnb Revenue Variations & Income Potential in Belagavi (2026)
Understanding the monthly revenue variations for Airbnb listings in Belagavi is key to maximizing your short term rental income potential. Seasonality significantly impacts earnings. Our analysis, based on data from the past 12 months, shows that the peak revenue month for STRs in Belagavi is typically December, while July often presents the lowest earnings, highlighting opportunities for strategic pricing adjustments during shoulder and low seasons. Explore the typical Airbnb income in Belagavi across different performance tiers:
- Best-in-class properties (Top 10%) achieve $500+ monthly, often utilizing dynamic pricing and superior guest experiences.
- Strong performing properties (Top 25%) earn $268 or more, indicating effective management and desirable locations/amenities.
- Typical properties (Median) generate around $155 per month, representing the average market performance.
- Entry-level properties (Bottom 25%) see earnings around $73, often with potential for optimization.
Average Monthly Airbnb Earnings Trend in Belagavi
Belagavi Airbnb Occupancy Rate Trends (2026)
Maximize your bookings by understanding the Belagavi STR occupancy trends. Seasonal demand shifts significantly influence how often properties are booked. Typically, Decembersees the highest demand (peak season occupancy), while July experiences the lowest (low season). Effective strategies, like adjusting minimum stays or offering promotions, can boost occupancy during slower periods. Here's how different property tiers perform in Belagavi:
- Best-in-class properties (Top 10%) achieve 42%+ occupancy, indicating high desirability and potentially optimized availability.
- Strong performing properties (Top 25%) maintain 29% or higher occupancy, suggesting good market fit and guest satisfaction.
- Typical properties (Median) have an occupancy rate around 20%.
- Entry-level properties (Bottom 25%) average 9% occupancy, potentially facing higher vacancy.
Average Monthly Occupancy Rate Trend in Belagavi
Average Daily Rate (ADR) Airbnb Trends in Belagavi (2026)
Effective short term rental pricing strategy in Belagavi involves understanding monthly ADR fluctuations. The Average Daily Rate (ADR) for Airbnb in Belagavi typically peaks in December and dips lowest during March. Leveraging Airbnb dynamic pricing tools or strategies based on this seasonality can significantly boost revenue. Here's a look at the typical nightly rates achieved:
- Best-in-class properties (Top 10%) command rates of $67+ per night, often due to premium features or locations.
- Strong performing properties (Top 25%) achieve nightly rates of $34 or more.
- Typical properties (Median) charge around $29 per night.
- Entry-level properties (Bottom 25%) earn around $17 per night.
Average Daily Rate (ADR) Trend by Month in Belagavi
Get Live Belagavi Market Intelligence 👇

Explore Real-time Analytics
Airbnb Seasonality Analysis & Trends in Belagavi (2026)
Peak Season (December, November, June)
- Revenue averages $320 per month
- Occupancy rates average 33.0%
- Daily rates average $33
Shoulder Season
- Revenue averages $197 per month
- Occupancy maintains around 19.3%
- Daily rates hold near $32
Low Season (January, July, October)
- Revenue drops to average $147 per month
- Occupancy decreases to average 17.8%
- Daily rates adjust to average $33
Seasonality Insights for Belagavi
- The Airbnb seasonality in Belagavi shows highly seasonal trends requiring careful strategy. While the sections above show seasonal averages, it's also insightful to look at the extremes:
- During the high season, the absolute peak month showcases Belagavi's highest earning potential, with monthly revenues capable of climbing to $431, occupancy reaching a high of 44.2%, and ADRs peaking at $34.
- Conversely, the slowest single month of the year, typically falling within the low season, marks the market's lowest point. In this month, revenue might dip to $141, occupancy could drop to 15.2%, and ADRs may adjust down to $31.
- Understanding both the seasonal averages and these monthly peaks and troughs in revenue, occupancy, and ADR is crucial for maximizing your Airbnb profit potential in Belagavi.
Seasonal Strategies for Maximizing Profit
- Peak Season: Maximize revenue through premium pricing and potentially longer minimum stays. Ensure high availability.
- Low Season: Offer competitive pricing, special promotions (e.g., extended stay discounts), and flexible cancellation policies. Target off-season travelers like remote workers or budget-conscious guests.
- Shoulder Seasons: Implement dynamic pricing that balances peak and low rates. Target weekend travelers or specific events. Offer slightly more flexible terms than peak season.
- Regularly analyze your own performance against these Belagavi seasonality benchmarks and adjust your pricing and availability strategy accordingly.
Best Areas for Airbnb Investment in Belagavi (2026)
Exploring the top neighborhoods for short-term rentals in Belagavi? This section highlights key areas, outlining why they are attractive for hosts and guests, along with notable local attractions. Consider these locations based on your target guest profile and investment strategy.
| Neighborhood / Area | Why Host Here? (Target Guests & Appeal) | Key Attractions & Landmarks |
|---|---|---|
| Camp Satyajit | A serene area with lush greenery and proximity to nature, ideal for travelers looking for peace and relaxation. It’s particularly popular among families and nature lovers. | Camp Satyajit Park, Vidyagiri Fort, Gadag Matha, Kittur Fort, Water Sports Mountain |
| Khanapur | Known for its historical significance and beautiful landscapes, Khanapur is a popular escape from the city hustle, attracting both tourists and cultural enthusiasts. | Khanapur Fort, Shri Shanteshwar Temple, Gadag Matha, Unkal Lake, Waterfalls |
| Belgaum Fort | A historic area that showcases the rich heritage of Belagavi. It draws in history buffs and families, making it a great spot for Airbnb hosting. | Belgaum Fort, Kapileshwara Temple, Siddhivinayak Temple, Huyilad Fort, Raja Lakhamagouda Lake |
| Kirloskarwadi | Noted for its industrial background, this area is appealing to business travelers and people visiting for work-related purposes. | Kirloskarwadi Industrial Area, Gadag Matha, Z-Point, Godavari River, Adventure Camp |
| Dudhnalwadi | This area is known for its scenic beauty and outdoor activities which attracts adventure seekers and nature lovers. | Adventure Sports Park, Dudhnalwadi Lake, Nature Trails, Bird Watching, Hiking Routes |
| Benne Khanapur | A rustic and traditional setting attracting tourists who want a glimpse of local life and culture. Great for experiential stays. | Local Markets, Cultural Festivals, Traditional Cuisine Sites, Tribal Villages |
| Ganesh Nagar | A residential area with a growing number of modern amenities, appealing to longer-term renters and travelers looking for comfort. | Parks and Recreational Areas, Local Cuisine, Markets, Café Culture |
| Vidyagiri | A rapidly developing area that combines traditional and modern attractions, suitable for families and business travelers alike. | Vidyagiri Fort, Shopping Areas, Monuments, Local Colleges, Restaurants |
Understanding Airbnb License Requirements & STR Laws in Belagavi (2026)
While Belagavi, Karnataka, India currently shows low STR regulations, specific Airbnb license requirements might still exist or change. Always verify the latest short term rental regulations and Airbnb license requirements directly with local government authorities for Belagavi to ensure full compliance before hosting.
(Source: AirROI data, 2026, finding no licensed listings among those analyzed)
Top Performing Airbnb Properties in Belagavi (2026)
Benchmark your potential! Explore examples of top-performing Airbnb properties in Belagavibased on Trailing Twelve Month (TTM) revenue. Analyze their characteristics, revenue, occupancy rate, and ADR to understand what drives success in this market.
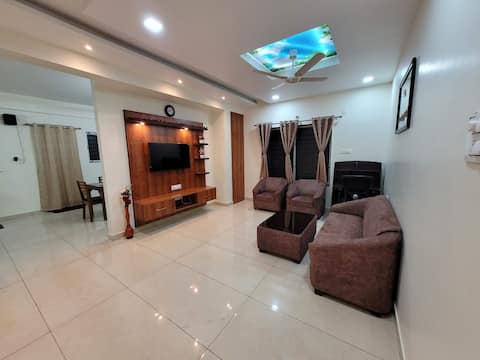
Paradise Home
Entire Place • 3 bedrooms

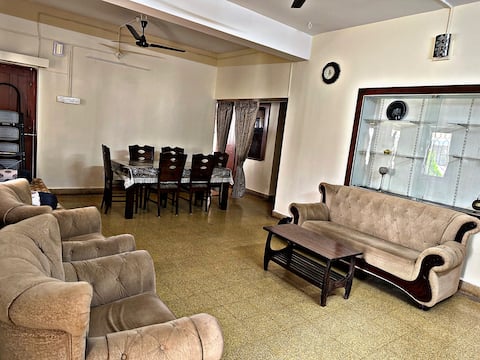
Vernekar’s Radha Classic
Entire Place • 4 bedrooms

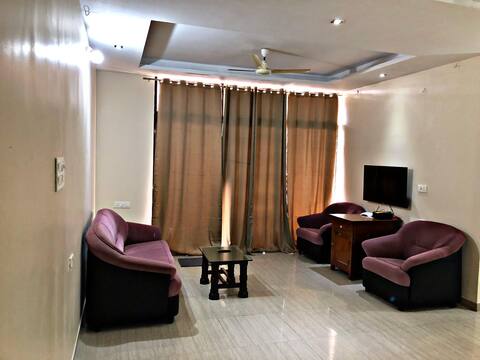
Royal Villa
Entire Place • 3 bedrooms
Sambrahma
Entire Place • 3 bedrooms

Vintage Bungalow Getaway in the Heart of Belgaum
Entire Place • 2 bedrooms
EMBASSY G-03
Entire Place • 3 bedrooms
Note: Performance varies based on location, size, amenities, seasonality, and management quality. Data reflects the past 12 months.
Top Performing Airbnb Hosts in Belagavi (2026)
Learn from the best! This table showcases top-performing Airbnb hosts in Belagavi based on the number of properties managed and estimated total revenue over the past year. Analyze their scale and performance metrics.
| Host Name | Properties | Grossing Revenue | Stay Reviews | Avg Rating |
|---|---|---|---|---|
| Santosh | 7 | $11,930 | 277 | 4.59/5.0 |
| Tabassum | 1 | $7,136 | 82 | 4.95/5.0 |
| Vaibhav | 2 | $7,076 | 5 | 4.75/5.0 |
| Mrunalinee | 1 | $3,903 | 10 | 4.90/5.0 |
| Amit | 3 | $3,567 | 64 | 4.63/5.0 |
| Shahabaz | 2 | $2,862 | 251 | 4.58/5.0 |
| Milind | 2 | $2,263 | 10 | 4.70/5.0 |
| Shivasmith | 1 | $2,004 | 12 | 4.75/5.0 |
| Shirish | 1 | $1,925 | 4 | 5.00/5.0 |
| Jagadeeshgouda | 1 | $1,355 | 40 | 4.58/5.0 |
Analyzing the strategies of top hosts, such as their property selection, pricing, and guest communication, can offer valuable lessons for optimizing your own Airbnb operations in Belagavi.
Dive Deeper: Advanced Belagavi STR Market Data (2026)
Ready to unlock more insights? AirROI provides access to advanced metrics and comprehensive Airbnb data for Belagavi. Explore detailed analytics beyond this report to refine your investment strategy, optimize pricing, and maximize your vacation rental profits.
Explore Advanced MetricsBelagavi Short-Term Rental Market Composition (2026): Property & Room Types
Room Type Distribution
Property Type Distribution
Market Composition Insights for Belagavi
- The Belagavi Airbnb market composition is heavily skewed towards Entire Home/Apt listings, which make up 88.5% of the 26 active rentals. This indicates strong guest preference for privacy and space.
- Looking at the property type distribution in Belagavi, Apartment/Condo properties are the most common (57.7%), reflecting the local real estate landscape.
- Houses represent a significant 30.8% portion, catering likely to families or larger groups.
- The presence of 11.5% Hotel/Boutique listings indicates integration with traditional hospitality.
Belagavi Airbnb Room Capacity Analysis (2026): Bedroom Distribution
Distribution of Listings by Number of Bedrooms
Room Capacity Insights for Belagavi
- The dominant room capacity in Belagavi is 2 bedrooms listings, making up 38.5% of the market. This suggests a strong demand for properties suitable for couples or solo travelers.
- Together, 2 bedrooms and 3 bedrooms properties represent 69.3% of the active Airbnb listings in Belagavi, indicating a high concentration in these sizes.
- A significant 34.6% of listings offer 3+ bedrooms, catering to larger groups and families seeking more space in Belagavi.
Belagavi Vacation Rental Guest Capacity Trends (2026)
Distribution of Listings by Guest Capacity
Guest Capacity Insights for Belagavi
- The most common guest capacity trend in Belagavi vacation rentals is listings accommodating 8+ guests (26.9%). This suggests the primary traveler segment is likely larger groups.
- Properties designed for 8+ guests and 6 guests dominate the Belagavi STR market, accounting for 50.0% of listings.
- 57.7% of properties accommodate 6+ guests, serving the market segment for larger families or group travel in Belagavi.
- On average, properties in Belagavi are equipped to host 5.4 guests.
Belagavi Airbnb Booking Patterns (2026): Available vs. Booked Days
Available Days Distribution
Booked Days Distribution
Booking Pattern Insights for Belagavi
- The most common availability pattern in Belagavi falls within the 271-366 days range, representing 92.3% of listings. This suggests many properties have significant open periods on their calendars.
- Approximately 96.1% of listings show high availability (181+ days open annually), indicating potential for increased bookings or specific owner usage patterns.
- For booked days, the 31-90 days range is most frequent in Belagavi (61.5%), reflecting common guest stay durations or potential owner blocking patterns.
- A notable 3.8% of properties secure long booking periods (181+ days booked per year), highlighting successful long-term rental strategies or significant owner usage.
Belagavi Airbnb Minimum Stay Requirements Analysis
Distribution of Listings by Minimum Night Requirement
1 Night
26 listings
100% of total
Key Insights
- The most prevalent minimum stay requirement in Belagavi is 1 Night, adopted by 100% of listings. This highlights the market's preference for shorter, flexible bookings.
- A strong majority (100.0%) of the Belagavi Airbnb data shows acceptance of very short stays (1-2 nights), indicating a dynamic, high-turnover market.
Recommendations
- Align with the market by considering a 1 Night minimum stay, as 100% of Belagavi hosts use this setting.
- Adjust minimum nights based on seasonality – potentially shorter during low season and longer during peak demand periods in Belagavi.
Belagavi Airbnb Cancellation Policy Trends Analysis (2026)
Limited
1 listings
3.8% of total
Flexible
16 listings
61.5% of total
Moderate
7 listings
26.9% of total
Firm
2 listings
7.7% of total
Cancellation Policy Insights for Belagavi
- The prevailing Airbnb cancellation policy trend in Belagavi is Flexible, used by 61.5% of listings.
- The market strongly favors guest-friendly terms, with 88.4% of listings offering Flexible or Moderate policies. This suggests guests in Belagavi may expect booking flexibility.
Recommendations for Hosts
- Consider adopting a Flexible policy to align with the 61.5% market standard in Belagavi.
- Given the high prevalence of Flexible policies (61.5%), offering this can enhance booking appeal, especially during shoulder seasons.
- Regularly review your cancellation policy against competitors and market demand shifts in Belagavi.
Belagavi STR Booking Lead Time Analysis (2026)
Average Booking Lead Time by Month
Booking Lead Time Insights for Belagavi
- The overall average booking lead time for vacation rentals in Belagavi is 20 days.
- Guests book furthest in advance for stays during December (average 50 days), likely coinciding with peak travel demand or local events.
- The shortest booking windows occur for stays in March (average 10 days), indicating more last-minute travel plans during this time.
- Seasonally, Winter (29 days avg.) sees the longest lead times, while Spring (13 days avg.) has the shortest, reflecting typical travel planning cycles.
Recommendations for Hosts
- Use the overall average lead time (20 days) as a baseline for your pricing and availability strategy in Belagavi.
- For December stays, consider implementing length-of-stay discounts or slightly higher rates for bookings made less than 50 days out to capitalize on advance planning.
- During March, focus on last-minute booking availability and promotions, as guests book with very short notice (10 days avg.).
- Target marketing efforts for the Winter season well in advance (at least 29 days) to capture early planners.
- Monitor your own booking lead times against these Belagavi averages to identify opportunities for dynamic pricing adjustments.
Popular & Essential Airbnb Amenities in Belagavi (2026)
Amenity Prevalence
Amenity Insights for Belagavi
- Essential amenities in Belagavi that guests expect include: Free parking on premises, Wifi. Lacking these (any) could significantly impact bookings.
- Popular amenities like TV, Kitchen, Hot water are common but not universal. Offering these can provide a competitive edge.
Recommendations for Hosts
- Ensure your listing includes all essential amenities for Belagavi: Free parking on premises, Wifi.
- Prioritize adding missing essentials: Wifi.
- Consider adding popular differentiators like TV or Kitchen to increase appeal.
- Highlight unique or less common amenities you offer (e.g., hot tub, dedicated workspace, EV charger) in your listing description and photos.
- Regularly check competitor amenities in Belagavi to stay competitive.
Belagavi Airbnb Guest Demographics & Profile Analysis (2026)
Guest Profile Summary for Belagavi
- The typical guest profile for Airbnb in Belagavi consists of primarily domestic travelers (90%), often arriving from nearby Mumbai, typically belonging to the Post-2000s (Gen Z/Alpha) group (50%), primarily speaking English or Hindi.
- Domestic travelers account for 90.4% of guests.
- Key international markets include India (90.4%) and United States (7.7%).
- Top languages spoken are English (45.7%) followed by Hindi (43.5%).
- A significant demographic segment is the Post-2000s (Gen Z/Alpha) group, representing 50% of guests.
Recommendations for Hosts
- Target domestic marketing efforts towards travelers from Mumbai and Bengaluru.
- Tailor amenities and listing descriptions to appeal to the dominant Post-2000s (Gen Z/Alpha) demographic (e.g., highlight fast WiFi, smart home features, local guides).
- Highlight unique local experiences or amenities relevant to the primary guest profile.
- Consider seasonal promotions aligned with peak travel times for key origin markets.
Nearby Short-Term Rental Market Comparison
How does the Belagavi Airbnb market stack up against its neighbors? Compare key performance metrics like average monthly revenue, ADR, and occupancy rates in surrounding areas to understand the broader regional STR landscape.
| Market | Active Properties | Monthly Revenue | Daily Rate | Avg. Occupancy |
|---|---|---|---|---|
| Verla | 12 | $1,408 | $228.43 | 34% |
| Assagao | 307 | $1,350 | $179.91 | 34% |
| Pilern | 16 | $1,254 | $167.86 | 36% |
| Badem | 325 | $1,204 | $179.96 | 31% |
| Marna | 137 | $1,173 | $159.27 | 34% |
| Sinquerim | 113 | $1,105 | $113.10 | 39% |
| Nagoa | 96 | $1,069 | $199.63 | 25% |
| Nerul | 31 | $1,069 | $178.26 | 32% |
| Cacra | 23 | $1,046 | $126.08 | 34% |
| Vagator | 240 | $1,015 | $140.15 | 31% |