Bommasandra Airbnb Market Analysis 2026: Short Term Rental Data & Vacation Rental Statistics in Karnataka, India
Is Airbnb profitable in Bommasandra in 2026? Explore comprehensive Airbnb analytics for Bommasandra, Karnataka, India to uncover income potential. This 2026 STR market report for Bommasandra, based on AirROI data from February 2025 to January 2026, reveals key trends in the niche market of 50 active listings.
Whether you're considering an Airbnb investment in Bommasandra, optimizing your existing vacation rental, or exploring rental arbitrage opportunities, understanding the Bommasandra Airbnb data is crucial. Leveraging the low regulation environment is key to maximizing your short term rental income potential. Let's dive into the specifics.
Key Bommasandra Airbnb Performance Metrics Overview
Monthly Airbnb Revenue Variations & Income Potential in Bommasandra (2026)
Understanding the monthly revenue variations for Airbnb listings in Bommasandra is key to maximizing your short term rental income potential. Seasonality significantly impacts earnings. Our analysis, based on data from the past 12 months, shows that the peak revenue month for STRs in Bommasandra is typically February, while November often presents the lowest earnings, highlighting opportunities for strategic pricing adjustments during shoulder and low seasons. Explore the typical Airbnb income in Bommasandra across different performance tiers:
- Best-in-class properties (Top 10%) achieve $222+ monthly, often utilizing dynamic pricing and superior guest experiences.
- Strong performing properties (Top 25%) earn $141 or more, indicating effective management and desirable locations/amenities.
- Typical properties (Median) generate around $71 per month, representing the average market performance.
- Entry-level properties (Bottom 25%) see earnings around $48, often with potential for optimization.
Average Monthly Airbnb Earnings Trend in Bommasandra
Bommasandra Airbnb Occupancy Rate Trends (2026)
Maximize your bookings by understanding the Bommasandra STR occupancy trends. Seasonal demand shifts significantly influence how often properties are booked. Typically, Februarysees the highest demand (peak season occupancy), while November experiences the lowest (low season). Effective strategies, like adjusting minimum stays or offering promotions, can boost occupancy during slower periods. Here's how different property tiers perform in Bommasandra:
- Best-in-class properties (Top 10%) achieve 39%+ occupancy, indicating high desirability and potentially optimized availability.
- Strong performing properties (Top 25%) maintain 21% or higher occupancy, suggesting good market fit and guest satisfaction.
- Typical properties (Median) have an occupancy rate around 12%.
- Entry-level properties (Bottom 25%) average 7% occupancy, potentially facing higher vacancy.
Average Monthly Occupancy Rate Trend in Bommasandra
Average Daily Rate (ADR) Airbnb Trends in Bommasandra (2026)
Effective short term rental pricing strategy in Bommasandra involves understanding monthly ADR fluctuations. The Average Daily Rate (ADR) for Airbnb in Bommasandra typically peaks in October and dips lowest during January. Leveraging Airbnb dynamic pricing tools or strategies based on this seasonality can significantly boost revenue. Here's a look at the typical nightly rates achieved:
- Best-in-class properties (Top 10%) command rates of $31+ per night, often due to premium features or locations.
- Strong performing properties (Top 25%) achieve nightly rates of $24 or more.
- Typical properties (Median) charge around $20 per night.
- Entry-level properties (Bottom 25%) earn around $16 per night.
Average Daily Rate (ADR) Trend by Month in Bommasandra
Get Live Bommasandra Market Intelligence 👇

Explore Real-time Analytics
Airbnb Seasonality Analysis & Trends in Bommasandra (2026)
Peak Season (February, June, March)
- Revenue averages $152 per month
- Occupancy rates average 26.5%
- Daily rates average $21
Shoulder Season
- Revenue averages $98 per month
- Occupancy maintains around 15.6%
- Daily rates hold near $21
Low Season (January, October, November)
- Revenue drops to average $70 per month
- Occupancy decreases to average 11.3%
- Daily rates adjust to average $22
Seasonality Insights for Bommasandra
- The Airbnb seasonality in Bommasandra shows highly seasonal trends requiring careful strategy. While the sections above show seasonal averages, it's also insightful to look at the extremes:
- During the high season, the absolute peak month showcases Bommasandra's highest earning potential, with monthly revenues capable of climbing to $172, occupancy reaching a high of 30.5%, and ADRs peaking at $23.
- Conversely, the slowest single month of the year, typically falling within the low season, marks the market's lowest point. In this month, revenue might dip to $52, occupancy could drop to 7.7%, and ADRs may adjust down to $20.
- Understanding both the seasonal averages and these monthly peaks and troughs in revenue, occupancy, and ADR is crucial for maximizing your Airbnb profit potential in Bommasandra.
Seasonal Strategies for Maximizing Profit
- Peak Season: Maximize revenue through premium pricing and potentially longer minimum stays. Ensure high availability.
- Low Season: Offer competitive pricing, special promotions (e.g., extended stay discounts), and flexible cancellation policies. Target off-season travelers like remote workers or budget-conscious guests.
- Shoulder Seasons: Implement dynamic pricing that balances peak and low rates. Target weekend travelers or specific events. Offer slightly more flexible terms than peak season.
- Regularly analyze your own performance against these Bommasandra seasonality benchmarks and adjust your pricing and availability strategy accordingly.
Best Areas for Airbnb Investment in Bommasandra (2026)
Exploring the top neighborhoods for short-term rentals in Bommasandra? This section highlights key areas, outlining why they are attractive for hosts and guests, along with notable local attractions. Consider these locations based on your target guest profile and investment strategy.
| Neighborhood / Area | Why Host Here? (Target Guests & Appeal) | Key Attractions & Landmarks |
|---|---|---|
| Electronic City | Known as the IT hub of Bangalore, Electronic City is popular among business travelers and tech professionals. Its proximity to major tech companies makes it an ideal location for short-term rentals. | Infosys Campus, Wipro Campus, Electronic City Flyover, Bhannerghatta National Park, Prasanna Venkateshwara Temple |
| Hosur Road | A major arterial road with easy access to Bangalore and Tamil Nadu, this area sees a lot of traffic from travelers and workers alike, making it a strategic spot for hosting. | Sankey Tank, Karnataka Chitrakala Parishath, Jayanagar 4th Block, Madiwala Market, Forum Mall |
| Narayanapura | A peaceful residential area with good connectivity to tech parks and industrial areas, attracting families and long-term guests looking for a quiet stay. | Kaggalipura Lake, Madiwala Lake Park, Raja Rajeshwari Temple, Sankey Tank, Madiwala Market |
| Attibele | An emerging locality that is rapidly developing, it is gaining popularity for its affordability and proximity to industries and tech parks. | Attibele Lake, Multiplex Cinemas, Local Restaurants, Nearby Parks |
| Kothanur | Known for its serene environment and proximity to parks, Kothanur is becoming popular among tourists looking for a quieter stay. | Kothanur Nature Park, Bhagyanagar Lake, Local Temples, Restaurants |
| Jigani | Another developing industrial area, Jígani attracts both business travelers and families due to its affordable lodging options and access to tech centers. | Jigani Lake, Local Markets, Temples, Nearby Nature Spots |
| Begur | A rapidly growing residential area with numerous amenities, it appeals to those looking for family-friendly accommodations near tech parks. | Begur Fort, Local Parks, Shopping Complexes, Temples |
| Banashankari | A well established residential area with vibrant culture and good connectivity, attracting both local and out-of-town visitors. | Banashankari Temple, Local Markets, Shopping Centers, Parks |
Understanding Airbnb License Requirements & STR Laws in Bommasandra (2026)
While Bommasandra, Karnataka, India currently shows low STR regulations, specific Airbnb license requirements might still exist or change. Always verify the latest short term rental regulations and Airbnb license requirements directly with local government authorities for Bommasandra to ensure full compliance before hosting.
(Source: AirROI data, 2026, finding no licensed listings among those analyzed)
Top Performing Airbnb Properties in Bommasandra (2026)
Benchmark your potential! Explore examples of top-performing Airbnb properties in Bommasandrabased on Trailing Twelve Month (TTM) revenue. Analyze their characteristics, revenue, occupancy rate, and ADR to understand what drives success in this market.
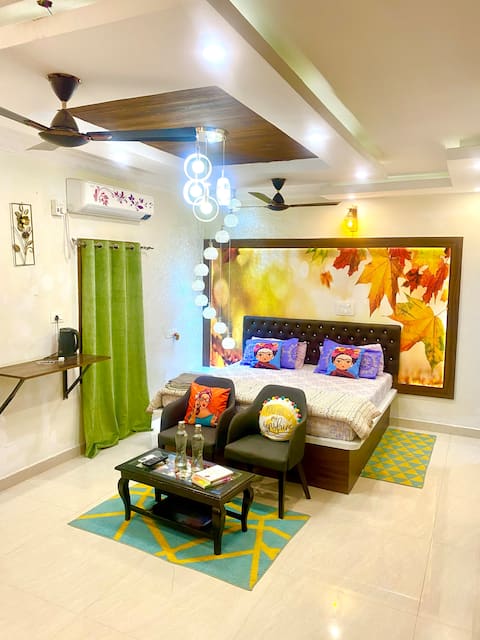
Cherry Croft- AC-Premium Penthouse with Bathtub
Entire Place • 1 bedroom

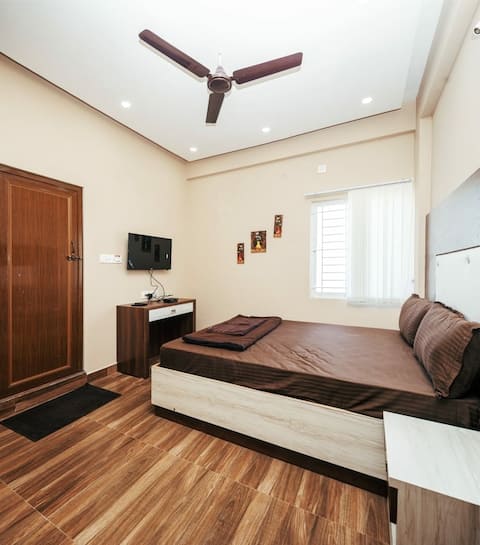
2BHK flat-ready kitchen-Narayana Hospital 1.5km
Entire Place • 2 bedrooms
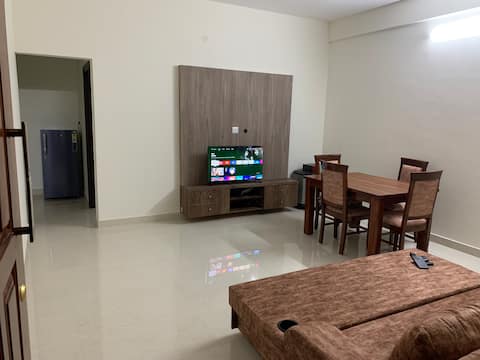
service accommodation with WFH setup
Private Room • 1 bedroom
Family flat at Bommasandra - 2BHK Furnished
Entire Place • 2 bedrooms

3BHK AC & Balcony Narayana Hrudayalya, Bommasandra
Entire Place • 3 bedrooms
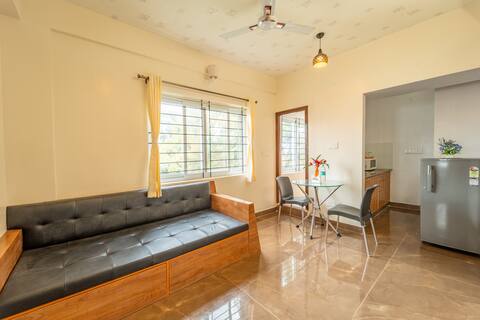
3BHK-AC @Narayana Hrudayalaya Health City
Entire Place • 3 bedrooms
Note: Performance varies based on location, size, amenities, seasonality, and management quality. Data reflects the past 12 months.
Top Performing Airbnb Hosts in Bommasandra (2026)
Learn from the best! This table showcases top-performing Airbnb hosts in Bommasandra based on the number of properties managed and estimated total revenue over the past year. Analyze their scale and performance metrics.
| Host Name | Properties | Grossing Revenue | Stay Reviews | Avg Rating |
|---|---|---|---|---|
| SAGAR NIWAS - Homestay Bangalo | 21 | $16,291 | 123 | 4.79/5.0 |
| Andy | 9 | $6,029 | 24 | 4.95/5.0 |
| Manjunath | 5 | $3,580 | 15 | 4.33/5.0 |
| Anish | 4 | $3,389 | 11 | 4.00/5.0 |
| Pallavi | 6 | $3,144 | 11 | 3.83/5.0 |
| Selvilakshmanan | 1 | $2,254 | 80 | 4.75/5.0 |
| Madan Kumar | 1 | $1,685 | 29 | 4.66/5.0 |
| Debashish | 1 | $1,000 | 9 | 4.44/5.0 |
| Amit | 1 | $503 | 11 | 4.73/5.0 |
| Kayalvizhi | 1 | $102 | 11 | 4.55/5.0 |
Analyzing the strategies of top hosts, such as their property selection, pricing, and guest communication, can offer valuable lessons for optimizing your own Airbnb operations in Bommasandra.
Dive Deeper: Advanced Bommasandra STR Market Data (2026)
Ready to unlock more insights? AirROI provides access to advanced metrics and comprehensive Airbnb data for Bommasandra. Explore detailed analytics beyond this report to refine your investment strategy, optimize pricing, and maximize your vacation rental profits.
Explore Advanced MetricsBommasandra Short-Term Rental Market Composition (2026): Property & Room Types
Room Type Distribution
Property Type Distribution
Market Composition Insights for Bommasandra
- The Bommasandra Airbnb market composition is heavily skewed towards Entire Home/Apt listings, which make up 90% of the 50 active rentals. This indicates strong guest preference for privacy and space.
- Looking at the property type distribution in Bommasandra, Apartment/Condo properties are the most common (86%), reflecting the local real estate landscape.
- Smaller segments like hotel/boutique (combined 2.0%) offer potential for unique stay experiences.
Bommasandra Airbnb Room Capacity Analysis (2026): Bedroom Distribution
Distribution of Listings by Number of Bedrooms
Room Capacity Insights for Bommasandra
- The dominant room capacity in Bommasandra is 2 bedrooms listings, making up 68% of the market. This suggests a strong demand for properties suitable for couples or solo travelers.
- Together, 2 bedrooms and 1 bedroom properties represent 96.0% of the active Airbnb listings in Bommasandra, indicating a high concentration in these sizes.
- Listings with 3+ bedrooms (4.0%) represent a smaller niche, potentially indicating an underserved market for larger group accommodations in Bommasandra.
Bommasandra Vacation Rental Guest Capacity Trends (2026)
Distribution of Listings by Guest Capacity
Guest Capacity Insights for Bommasandra
- The most common guest capacity trend in Bommasandra vacation rentals is listings accommodating 8+ guests (28%). This suggests the primary traveler segment is likely larger groups.
- Properties designed for 8+ guests and 6 guests dominate the Bommasandra STR market, accounting for 54.0% of listings.
- 60.0% of properties accommodate 6+ guests, serving the market segment for larger families or group travel in Bommasandra.
- On average, properties in Bommasandra are equipped to host 5.4 guests.
Bommasandra Airbnb Booking Patterns (2026): Available vs. Booked Days
Available Days Distribution
Booked Days Distribution
Booking Pattern Insights for Bommasandra
- The most common availability pattern in Bommasandra falls within the 271-366 days range, representing 94% of listings. This suggests many properties have significant open periods on their calendars.
- Approximately 100.0% of listings show high availability (181+ days open annually), indicating potential for increased bookings or specific owner usage patterns.
- For booked days, the 1-30 days range is most frequent in Bommasandra (48%), reflecting common guest stay durations or potential owner blocking patterns.
Bommasandra Airbnb Minimum Stay Requirements Analysis
Distribution of Listings by Minimum Night Requirement
1 Night
12 listings
24% of total
2 Nights
36 listings
72% of total
30+ Nights
2 listings
4% of total
Key Insights
- The most prevalent minimum stay requirement in Bommasandra is 2 Nights, adopted by 72% of listings. This highlights the market's preference for shorter, flexible bookings.
- A strong majority (96.0%) of the Bommasandra Airbnb data shows acceptance of very short stays (1-2 nights), indicating a dynamic, high-turnover market.
Recommendations
- Align with the market by considering a 2 Nights minimum stay, as 72% of Bommasandra hosts use this setting.
- If feasible, allowing 1-night stays, especially midweek or during low season, could capture last-minute bookings, as only 24% currently do.
- Adjust minimum nights based on seasonality – potentially shorter during low season and longer during peak demand periods in Bommasandra.
Bommasandra Airbnb Cancellation Policy Trends Analysis (2026)
Flexible
14 listings
28% of total
Firm
9 listings
18% of total
Strict
27 listings
54% of total
Cancellation Policy Insights for Bommasandra
- The prevailing Airbnb cancellation policy trend in Bommasandra is Strict, used by 54% of listings.
- A majority (72.0%) of hosts in Bommasandra utilize Firm or Strict policies, indicating a market where hosts prioritize booking security.
Recommendations for Hosts
- Consider adopting a Strict policy to align with the 54% market standard in Bommasandra.
- With 54% using Strict terms, this is a viable option in Bommasandra, particularly for high-value properties or during peak demand periods.
- Regularly review your cancellation policy against competitors and market demand shifts in Bommasandra.
Bommasandra STR Booking Lead Time Analysis (2026)
Average Booking Lead Time by Month
Booking Lead Time Insights for Bommasandra
- The overall average booking lead time for vacation rentals in Bommasandra is 8 days.
- Guests book furthest in advance for stays during September (average 26 days), likely coinciding with peak travel demand or local events.
- The shortest booking windows occur for stays in March (average 2 days), indicating more last-minute travel plans during this time.
- Seasonally, Fall (16 days avg.) sees the longest lead times, while Spring (4 days avg.) has the shortest, reflecting typical travel planning cycles.
Recommendations for Hosts
- Use the overall average lead time (8 days) as a baseline for your pricing and availability strategy in Bommasandra.
- For September stays, consider implementing length-of-stay discounts or slightly higher rates for bookings made less than 26 days out to capitalize on advance planning.
- Target marketing efforts for the Fall season well in advance (at least 16 days) to capture early planners.
- Monitor your own booking lead times against these Bommasandra averages to identify opportunities for dynamic pricing adjustments.
Popular & Essential Airbnb Amenities in Bommasandra (2026)
Amenity Prevalence
Amenity Insights for Bommasandra
- Essential amenities in Bommasandra that guests expect include: TV, Wifi, Free parking on premises. Lacking these (any) could significantly impact bookings.
- Popular amenities like Washer, Kitchen, Iron are common but not universal. Offering these can provide a competitive edge.
Recommendations for Hosts
- Ensure your listing includes all essential amenities for Bommasandra: TV, Wifi, Free parking on premises.
- Consider adding popular differentiators like Washer or Kitchen to increase appeal.
- Highlight unique or less common amenities you offer (e.g., hot tub, dedicated workspace, EV charger) in your listing description and photos.
- Regularly check competitor amenities in Bommasandra to stay competitive.
Bommasandra Airbnb Guest Demographics & Profile Analysis (2026)
Guest Profile Summary for Bommasandra
- The typical guest profile for Airbnb in Bommasandra consists of primarily domestic travelers (93%), often arriving from nearby Bengaluru, typically belonging to the Post-2000s (Gen Z/Alpha) group (50%), primarily speaking English or Hindi.
- Domestic travelers account for 92.9% of guests.
- Key international markets include India (92.9%) and Canada (7.1%).
- Top languages spoken are English (34.3%) followed by Hindi (22.9%).
- A significant demographic segment is the Post-2000s (Gen Z/Alpha) group, representing 50% of guests.
Recommendations for Hosts
- Target domestic marketing efforts towards travelers from Bengaluru and Jaipur.
- Tailor amenities and listing descriptions to appeal to the dominant Post-2000s (Gen Z/Alpha) demographic (e.g., highlight fast WiFi, smart home features, local guides).
- Highlight unique local experiences or amenities relevant to the primary guest profile.
- Consider seasonal promotions aligned with peak travel times for key origin markets.
Nearby Short-Term Rental Market Comparison
How does the Bommasandra Airbnb market stack up against its neighbors? Compare key performance metrics like average monthly revenue, ADR, and occupancy rates in surrounding areas to understand the broader regional STR landscape.
| Market | Active Properties | Monthly Revenue | Daily Rate | Avg. Occupancy |
|---|---|---|---|---|
| Kadirenahalli | 12 | $1,153 | $108.45 | 36% |
| Chikkabidarakallu | 10 | $794 | $491.62 | 28% |
| Achanakal hatty | 15 | $667 | $77.56 | 29% |
| Lovedale | 17 | $634 | $150.15 | 22% |
| Udhagamandalam | 203 | $621 | $100.87 | 23% |
| Coonoor | 61 | $515 | $103.42 | 24% |
| Yercaud | 79 | $472 | $110.48 | 20% |
| Vythiri | 223 | $416 | $84.04 | 20% |
| Kotagiri | 53 | $396 | $109.53 | 17% |
| Ooty | 35 | $380 | $98.29 | 20% |