Kovalam Airbnb Market Analysis 2026: Short Term Rental Data & Vacation Rental Statistics in Kerala, India
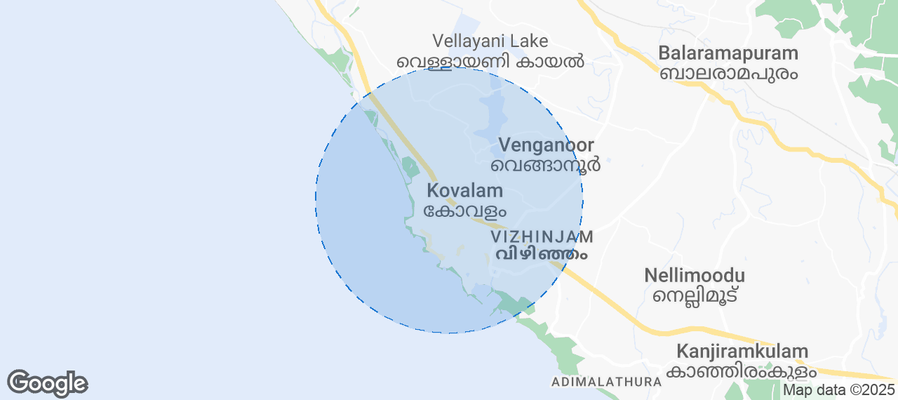
Is Airbnb profitable in Kovalam in 2026? Explore comprehensive Airbnb analytics for Kovalam, Kerala, India to uncover income potential. This 2026 STR market report for Kovalam, based on AirROI data from February 2025 to January 2026, reveals key trends in the niche market of 23 active listings.
Whether you're considering an Airbnb investment in Kovalam, optimizing your existing vacation rental, or exploring rental arbitrage opportunities, understanding the Kovalam Airbnb data is crucial. Leveraging the low regulation environment is key to maximizing your short term rental income potential. Let's dive into the specifics.
Key Kovalam Airbnb Performance Metrics Overview
Monthly Airbnb Revenue Variations & Income Potential in Kovalam (2026)
Understanding the monthly revenue variations for Airbnb listings in Kovalam is key to maximizing your short term rental income potential. Seasonality significantly impacts earnings. Our analysis, based on data from the past 12 months, shows that the peak revenue month for STRs in Kovalam is typically May, while March often presents the lowest earnings, highlighting opportunities for strategic pricing adjustments during shoulder and low seasons. Explore the typical Airbnb income in Kovalam across different performance tiers:
- Best-in-class properties (Top 10%) achieve $2,025+ monthly, often utilizing dynamic pricing and superior guest experiences.
- Strong performing properties (Top 25%) earn $853 or more, indicating effective management and desirable locations/amenities.
- Typical properties (Median) generate around $298 per month, representing the average market performance.
- Entry-level properties (Bottom 25%) see earnings around $156, often with potential for optimization.
Average Monthly Airbnb Earnings Trend in Kovalam
Kovalam Airbnb Occupancy Rate Trends (2026)
Maximize your bookings by understanding the Kovalam STR occupancy trends. Seasonal demand shifts significantly influence how often properties are booked. Typically, Novembersees the highest demand (peak season occupancy), while August experiences the lowest (low season). Effective strategies, like adjusting minimum stays or offering promotions, can boost occupancy during slower periods. Here's how different property tiers perform in Kovalam:
- Best-in-class properties (Top 10%) achieve 59%+ occupancy, indicating high desirability and potentially optimized availability.
- Strong performing properties (Top 25%) maintain 35% or higher occupancy, suggesting good market fit and guest satisfaction.
- Typical properties (Median) have an occupancy rate around 17%.
- Entry-level properties (Bottom 25%) average 11% occupancy, potentially facing higher vacancy.
Average Monthly Occupancy Rate Trend in Kovalam
Average Daily Rate (ADR) Airbnb Trends in Kovalam (2026)
Effective short term rental pricing strategy in Kovalam involves understanding monthly ADR fluctuations. The Average Daily Rate (ADR) for Airbnb in Kovalam typically peaks in December and dips lowest during July. Leveraging Airbnb dynamic pricing tools or strategies based on this seasonality can significantly boost revenue. Here's a look at the typical nightly rates achieved:
- Best-in-class properties (Top 10%) command rates of $195+ per night, often due to premium features or locations.
- Strong performing properties (Top 25%) achieve nightly rates of $64 or more.
- Typical properties (Median) charge around $35 per night.
- Entry-level properties (Bottom 25%) earn around $24 per night.
Average Daily Rate (ADR) Trend by Month in Kovalam
Get Live Kovalam Market Intelligence 👇
Explore Real-time Analytics
Airbnb Seasonality Analysis & Trends in Kovalam (2026)
Peak Season (May, January, June)
- Revenue averages $1,037 per month
- Occupancy rates average 30.9%
- Daily rates average $63
Shoulder Season
- Revenue averages $631 per month
- Occupancy maintains around 26.0%
- Daily rates hold near $64
Low Season (March, April, October)
- Revenue drops to average $446 per month
- Occupancy decreases to average 20.2%
- Daily rates adjust to average $64
Seasonality Insights for Kovalam
- The Airbnb seasonality in Kovalam shows highly seasonal trends requiring careful strategy. While the sections above show seasonal averages, it's also insightful to look at the extremes:
- During the high season, the absolute peak month showcases Kovalam's highest earning potential, with monthly revenues capable of climbing to $1,043, occupancy reaching a high of 38.7%, and ADRs peaking at $73.
- Conversely, the slowest single month of the year, typically falling within the low season, marks the market's lowest point. In this month, revenue might dip to $319, occupancy could drop to 14.3%, and ADRs may adjust down to $54.
- Understanding both the seasonal averages and these monthly peaks and troughs in revenue, occupancy, and ADR is crucial for maximizing your Airbnb profit potential in Kovalam.
Seasonal Strategies for Maximizing Profit
- Peak Season: Maximize revenue through premium pricing and potentially longer minimum stays. Ensure high availability.
- Low Season: Offer competitive pricing, special promotions (e.g., extended stay discounts), and flexible cancellation policies. Target off-season travelers like remote workers or budget-conscious guests.
- Shoulder Seasons: Implement dynamic pricing that balances peak and low rates. Target weekend travelers or specific events. Offer slightly more flexible terms than peak season.
- Regularly analyze your own performance against these Kovalam seasonality benchmarks and adjust your pricing and availability strategy accordingly.
Best Areas for Airbnb Investment in Kovalam (2026)
Exploring the top neighborhoods for short-term rentals in Kovalam? This section highlights key areas, outlining why they are attractive for hosts and guests, along with notable local attractions. Consider these locations based on your target guest profile and investment strategy.
| Neighborhood / Area | Why Host Here? (Target Guests & Appeal) | Key Attractions & Landmarks |
|---|---|---|
| Hawa Beach | Popular beach known for its stunning views, water sports activities, and vibrant atmosphere. It's a favorite among tourists and ideal for beachside accommodations. | Hawa Beach, Lighthouse Beach, Ayurvedic centers, Water sports activities, Local eateries |
| Kovalam Lighthouse Beach | Famous for its iconic lighthouse, this area attracts tourists looking for stunning sunsets and scenic beach experiences. Great for hosting Airbnb stays. | Kovalam Lighthouse, Lighthouse Beach, Local shops, Beachfront restaurants, Sunset views |
| Samudra Beach | Less crowded than the other beaches, perfect for guests looking for tranquility and relaxation. Offers a more serene experience with beautiful surroundings. | Samudra Beach, Ayurvedic spas, Yoga retreats, Coastal walks, Fishing activities |
| Kovalam Town Center | The hub of local life with markets, shops, and restaurants. Offers a more cultural experience, attracting those who want to explore local cuisine and crafts. | Local markets, Restaurants, Craft shops, Cultural performances, Temple visits |
| Pneighbor Beach | A more secluded beach location, ideal for those wanting privacy. It's great for couples looking for romantic getaway options. | Pneighbor Beach, Nature walks, Quiet ambiance, Picnic spots, Local wildlife |
| Vizhinjam | Close to Kovalam but offers a different experience with local fishing activities and a more authentic cultural immersion. Attracts tourists interested in local life. | Vizhinjam Harbour, Local fishing activities, Beachfront shacks, Cultural interactions, Watersports |
| Chowara Beach | Located just south of Kovalam, this beach is quieter and perfect for those wanting to retreat from the busier tourist spots. Great for relaxation. | Chowara Beach, Ayurvedic resorts, Quiet surroundings, Nature trails, Local seafood |
| Tarangini Beach | A hidden gem that's less frequented by tourists, offering peace and a natural setting. Suitable for eco-tourists and those who enjoy isolation. | Tarangini Beach, Scenic views, Nature exploration, Wildlife spotting, Beach clean-ups |
Understanding Airbnb License Requirements & STR Laws in Kovalam (2026)
While Kovalam, Kerala, India currently shows low STR regulations, specific Airbnb license requirements might still exist or change. Always verify the latest short term rental regulations and Airbnb license requirements directly with local government authorities for Kovalam to ensure full compliance before hosting.
(Source: AirROI data, 2026, finding no licensed listings among those analyzed)
Top Performing Airbnb Properties in Kovalam (2026)
Benchmark your potential! Explore examples of top-performing Airbnb properties in Kovalambased on Trailing Twelve Month (TTM) revenue. Analyze their characteristics, revenue, occupancy rate, and ADR to understand what drives success in this market.
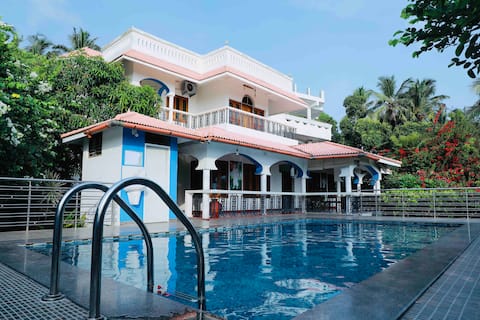
Entire beach bungalow with private pool
Entire Place • 4 bedrooms

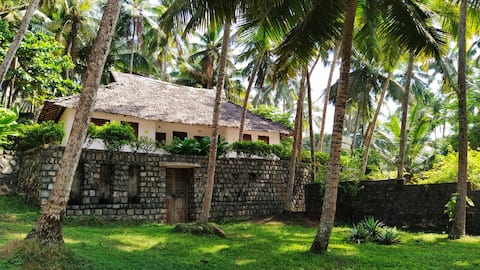
Karikkathi Beach House - spectacular Seafrontage
Entire Place • 2 bedrooms

Trivi Homestay Full Apartment in Kovalam
Entire Place • 9 bedrooms

Sea View Room with Private Balcony | Kovalam Beach
Private Room • 1 bedroom
Bamboo & Hibiscus Beach Villa (2 double room)
Entire Place • 2 bedrooms

Surya & Samudra -Seafront Private Beach House
Entire Place • 2 bedrooms
Note: Performance varies based on location, size, amenities, seasonality, and management quality. Data reflects the past 12 months.
Top Performing Airbnb Hosts in Kovalam (2026)
Learn from the best! This table showcases top-performing Airbnb hosts in Kovalam based on the number of properties managed and estimated total revenue over the past year. Analyze their scale and performance metrics.
| Host Name | Properties | Grossing Revenue | Stay Reviews | Avg Rating |
|---|---|---|---|---|
| Sreenath | 1 | $28,372 | 126 | 4.76/5.0 |
| Shaina | 3 | $17,634 | 40 | 4.72/5.0 |
| Abid | 5 | $7,975 | 18 | 4.69/5.0 |
| Raghav | 5 | $4,009 | 23 | 3.99/5.0 |
| Akhil | 1 | $3,724 | 31 | 4.58/5.0 |
| Kumar | 1 | $2,256 | 7 | 5.00/5.0 |
| Jayaprakash | 1 | $1,581 | 27 | 4.85/5.0 |
| Robin | 1 | $989 | 2 | Not Rated |
| Tabu | 1 | $704 | 1 | Not Rated |
| Host #472650045 | 1 | $479 | 1 | Not Rated |
Analyzing the strategies of top hosts, such as their property selection, pricing, and guest communication, can offer valuable lessons for optimizing your own Airbnb operations in Kovalam.
Dive Deeper: Advanced Kovalam STR Market Data (2026)
Ready to unlock more insights? AirROI provides access to advanced metrics and comprehensive Airbnb data for Kovalam. Explore detailed analytics beyond this report to refine your investment strategy, optimize pricing, and maximize your vacation rental profits.
Explore Advanced MetricsKovalam Short-Term Rental Market Composition (2026): Property & Room Types
Room Type Distribution
Property Type Distribution
Market Composition Insights for Kovalam
- The Kovalam Airbnb market composition is heavily skewed towards Private Room listings, which make up 56.5% of the 23 active rentals. This indicates strong guest preference for privacy and space.
- Looking at the property type distribution in Kovalam, House properties are the most common (43.5%), reflecting the local real estate landscape.
- Houses represent a significant 43.5% portion, catering likely to families or larger groups.
- The presence of 26.1% Hotel/Boutique listings indicates integration with traditional hospitality.
- Smaller segments like unique stays (combined 4.3%) offer potential for unique stay experiences.
Kovalam Airbnb Room Capacity Analysis (2026): Bedroom Distribution
Distribution of Listings by Number of Bedrooms
Room Capacity Insights for Kovalam
- The dominant room capacity in Kovalam is 2 bedrooms listings, making up 26.1% of the market. This suggests a strong demand for properties suitable for couples or solo travelers.
- Together, 2 bedrooms and 1 bedroom properties represent 39.1% of the active Airbnb listings in Kovalam, indicating a high concentration in these sizes.
Kovalam Vacation Rental Guest Capacity Trends (2026)
Distribution of Listings by Guest Capacity
Guest Capacity Insights for Kovalam
- The most common guest capacity trend in Kovalam vacation rentals is listings accommodating 4 guests (21.7%). This suggests the primary traveler segment is likely small families or groups.
- Properties designed for 4 guests and 2 guests dominate the Kovalam STR market, accounting for 34.7% of listings.
- 17.4% of properties accommodate 6+ guests, serving the market segment for larger families or group travel in Kovalam.
- On average, properties in Kovalam are equipped to host 2.6 guests.
Kovalam Airbnb Booking Patterns (2026): Available vs. Booked Days
Available Days Distribution
Booked Days Distribution
Booking Pattern Insights for Kovalam
- The most common availability pattern in Kovalam falls within the 271-366 days range, representing 95.7% of listings. This suggests many properties have significant open periods on their calendars.
- Approximately 100.0% of listings show high availability (181+ days open annually), indicating potential for increased bookings or specific owner usage patterns.
- For booked days, the 1-30 days range is most frequent in Kovalam (56.5%), reflecting common guest stay durations or potential owner blocking patterns.
Kovalam Airbnb Minimum Stay Requirements Analysis
Distribution of Listings by Minimum Night Requirement
1 Night
19 listings
86.4% of total
2 Nights
2 listings
9.1% of total
4-6 Nights
1 listings
4.5% of total
Key Insights
- The most prevalent minimum stay requirement in Kovalam is 1 Night, adopted by 86.4% of listings. This highlights the market's preference for shorter, flexible bookings.
- A strong majority (95.5%) of the Kovalam Airbnb data shows acceptance of very short stays (1-2 nights), indicating a dynamic, high-turnover market.
Recommendations
- Align with the market by considering a 1 Night minimum stay, as 86.4% of Kovalam hosts use this setting.
- Adjust minimum nights based on seasonality – potentially shorter during low season and longer during peak demand periods in Kovalam.
Kovalam Airbnb Cancellation Policy Trends Analysis (2026)
Limited
1 listings
4.5% of total
Flexible
15 listings
68.2% of total
Moderate
3 listings
13.6% of total
Strict
3 listings
13.6% of total
Cancellation Policy Insights for Kovalam
- The prevailing Airbnb cancellation policy trend in Kovalam is Flexible, used by 68.2% of listings.
- The market strongly favors guest-friendly terms, with 81.8% of listings offering Flexible or Moderate policies. This suggests guests in Kovalam may expect booking flexibility.
Recommendations for Hosts
- Consider adopting a Flexible policy to align with the 68.2% market standard in Kovalam.
- Given the high prevalence of Flexible policies (68.2%), offering this can enhance booking appeal, especially during shoulder seasons.
- Using a Strict policy might deter some guests, as only 13.6% of listings use it. Evaluate if potential revenue protection outweighs possible lower booking rates.
- Regularly review your cancellation policy against competitors and market demand shifts in Kovalam.
Kovalam STR Booking Lead Time Analysis (2026)
Average Booking Lead Time by Month
Booking Lead Time Insights for Kovalam
- The overall average booking lead time for vacation rentals in Kovalam is 26 days.
- Guests book furthest in advance for stays during November (average 81 days), likely coinciding with peak travel demand or local events.
- The shortest booking windows occur for stays in June (average 7 days), indicating more last-minute travel plans during this time.
- Seasonally, Fall (36 days avg.) sees the longest lead times, while Spring (12 days avg.) has the shortest, reflecting typical travel planning cycles.
Recommendations for Hosts
- Use the overall average lead time (26 days) as a baseline for your pricing and availability strategy in Kovalam.
- For November stays, consider implementing length-of-stay discounts or slightly higher rates for bookings made less than 81 days out to capitalize on advance planning.
- During June, focus on last-minute booking availability and promotions, as guests book with very short notice (7 days avg.).
- Target marketing efforts for the Fall season well in advance (at least 36 days) to capture early planners.
- Monitor your own booking lead times against these Kovalam averages to identify opportunities for dynamic pricing adjustments.
Popular & Essential Airbnb Amenities in Kovalam (2026)
Amenity Prevalence
Amenity Insights for Kovalam
- Essential amenities in Kovalam that guests expect include: Wifi. Lacking these (this) could significantly impact bookings.
- Popular amenities like Kitchen, Free parking on premises, Air conditioning are common but not universal. Offering these can provide a competitive edge.
Recommendations for Hosts
- Ensure your listing includes all essential amenities for Kovalam: Wifi.
- Prioritize adding missing essentials: Wifi.
- Consider adding popular differentiators like Kitchen or Free parking on premises to increase appeal.
- Highlight unique or less common amenities you offer (e.g., hot tub, dedicated workspace, EV charger) in your listing description and photos.
- Regularly check competitor amenities in Kovalam to stay competitive.
Kovalam Airbnb Guest Demographics & Profile Analysis (2026)
Guest Profile Summary for Kovalam
- The typical guest profile for Airbnb in Kovalam consists of a mix of domestic (59%) and international guests, often arriving from nearby Bengaluru, typically belonging to the Post-2000s (Gen Z/Alpha) group (50%), primarily speaking English or Hindi.
- Domestic travelers account for 58.8% of guests.
- Key international markets include India (58.8%) and United States (11.8%).
- Top languages spoken are English (47.5%) followed by Hindi (30%).
- A significant demographic segment is the Post-2000s (Gen Z/Alpha) group, representing 50% of guests.
Recommendations for Hosts
- Balance marketing efforts between domestic and international channels based on the guest mix.
- Tailor amenities and listing descriptions to appeal to the dominant Post-2000s (Gen Z/Alpha) demographic (e.g., highlight fast WiFi, smart home features, local guides).
- Highlight unique local experiences or amenities relevant to the primary guest profile.
- Consider seasonal promotions aligned with peak travel times for key origin markets.
Nearby Short-Term Rental Market Comparison
How does the Kovalam Airbnb market stack up against its neighbors? Compare key performance metrics like average monthly revenue, ADR, and occupancy rates in surrounding areas to understand the broader regional STR landscape.
| Market | Active Properties | Monthly Revenue | Daily Rate | Avg. Occupancy |
|---|---|---|---|---|
| Edava | 19 | $1,022 | $111.94 | 31% |
| Muhamma | 10 | $935 | $233.98 | 20% |
| Ambalappuzha | 11 | $674 | $112.64 | 25% |
| Vazhikadavu | 12 | $528 | $83.81 | 24% |
| Varkala | 212 | $456 | $64.79 | 29% |
| Poopalli | 14 | $447 | $145.43 | 18% |
| Chottupara | 11 | $415 | $109.04 | 18% |
| Kuttikkanam | 13 | $403 | $108.34 | 19% |
| Thrippunithura | 15 | $364 | $45.72 | 30% |
| Ernakulam | 310 | $361 | $50.47 | 30% |