Malvan Airbnb Market Analysis 2026: Short Term Rental Data & Vacation Rental Statistics in Maharashtra, India
Is Airbnb profitable in Malvan in 2026? Explore comprehensive Airbnb analytics for Malvan, Maharashtra, India to uncover income potential. This 2026 STR market report for Malvan, based on AirROI data from February 2025 to January 2026, reveals key trends in the niche market of 21 active listings.
Whether you're considering an Airbnb investment in Malvan, optimizing your existing vacation rental, or exploring rental arbitrage opportunities, understanding the Malvan Airbnb data is crucial. Leveraging the low regulation environment is key to maximizing your short term rental income potential. Let's dive into the specifics.
Key Malvan Airbnb Performance Metrics Overview
Monthly Airbnb Revenue Variations & Income Potential in Malvan (2026)
Understanding the monthly revenue variations for Airbnb listings in Malvan is key to maximizing your short term rental income potential. Seasonality significantly impacts earnings. Our analysis, based on data from the past 12 months, shows that the peak revenue month for STRs in Malvan is typically May, while September often presents the lowest earnings, highlighting opportunities for strategic pricing adjustments during shoulder and low seasons. Explore the typical Airbnb income in Malvan across different performance tiers:
- Best-in-class properties (Top 10%) achieve $1,701+ monthly, often utilizing dynamic pricing and superior guest experiences.
- Strong performing properties (Top 25%) earn $714 or more, indicating effective management and desirable locations/amenities.
- Typical properties (Median) generate around $308 per month, representing the average market performance.
- Entry-level properties (Bottom 25%) see earnings around $106, often with potential for optimization.
Average Monthly Airbnb Earnings Trend in Malvan
Malvan Airbnb Occupancy Rate Trends (2026)
Maximize your bookings by understanding the Malvan STR occupancy trends. Seasonal demand shifts significantly influence how often properties are booked. Typically, Maysees the highest demand (peak season occupancy), while July experiences the lowest (low season). Effective strategies, like adjusting minimum stays or offering promotions, can boost occupancy during slower periods. Here's how different property tiers perform in Malvan:
- Best-in-class properties (Top 10%) achieve 51%+ occupancy, indicating high desirability and potentially optimized availability.
- Strong performing properties (Top 25%) maintain 37% or higher occupancy, suggesting good market fit and guest satisfaction.
- Typical properties (Median) have an occupancy rate around 17%.
- Entry-level properties (Bottom 25%) average 11% occupancy, potentially facing higher vacancy.
Average Monthly Occupancy Rate Trend in Malvan
Average Daily Rate (ADR) Airbnb Trends in Malvan (2026)
Effective short term rental pricing strategy in Malvan involves understanding monthly ADR fluctuations. The Average Daily Rate (ADR) for Airbnb in Malvan typically peaks in February and dips lowest during August. Leveraging Airbnb dynamic pricing tools or strategies based on this seasonality can significantly boost revenue. Here's a look at the typical nightly rates achieved:
- Best-in-class properties (Top 10%) command rates of $59+ per night, often due to premium features or locations.
- Strong performing properties (Top 25%) achieve nightly rates of $40 or more.
- Typical properties (Median) charge around $29 per night.
- Entry-level properties (Bottom 25%) earn around $22 per night.
Average Daily Rate (ADR) Trend by Month in Malvan
Get Live Malvan Market Intelligence 👇

Explore Real-time Analytics
Airbnb Seasonality Analysis & Trends in Malvan (2026)
Peak Season (May, June, April)
- Revenue averages $953 per month
- Occupancy rates average 32.2%
- Daily rates average $38
Shoulder Season
- Revenue averages $501 per month
- Occupancy maintains around 22.6%
- Daily rates hold near $38
Low Season (January, September, December)
- Revenue drops to average $345 per month
- Occupancy decreases to average 22.0%
- Daily rates adjust to average $38
Seasonality Insights for Malvan
- The Airbnb seasonality in Malvan shows highly seasonal trends requiring careful strategy. While the sections above show seasonal averages, it's also insightful to look at the extremes:
- During the high season, the absolute peak month showcases Malvan's highest earning potential, with monthly revenues capable of climbing to $1,064, occupancy reaching a high of 46.0%, and ADRs peaking at $41.
- Conversely, the slowest single month of the year, typically falling within the low season, marks the market's lowest point. In this month, revenue might dip to $343, occupancy could drop to 12.9%, and ADRs may adjust down to $36.
- Understanding both the seasonal averages and these monthly peaks and troughs in revenue, occupancy, and ADR is crucial for maximizing your Airbnb profit potential in Malvan.
Seasonal Strategies for Maximizing Profit
- Peak Season: Maximize revenue through premium pricing and potentially longer minimum stays. Ensure high availability.
- Low Season: Offer competitive pricing, special promotions (e.g., extended stay discounts), and flexible cancellation policies. Target off-season travelers like remote workers or budget-conscious guests.
- Shoulder Seasons: Implement dynamic pricing that balances peak and low rates. Target weekend travelers or specific events. Offer slightly more flexible terms than peak season.
- Regularly analyze your own performance against these Malvan seasonality benchmarks and adjust your pricing and availability strategy accordingly.
Best Areas for Airbnb Investment in Malvan (2026)
Exploring the top neighborhoods for short-term rentals in Malvan? This section highlights key areas, outlining why they are attractive for hosts and guests, along with notable local attractions. Consider these locations based on your target guest profile and investment strategy.
| Neighborhood / Area | Why Host Here? (Target Guests & Appeal) | Key Attractions & Landmarks |
|---|---|---|
| Devbag Beach | A serene beach known for its natural beauty and water sports. Great for families and tourists looking for a relaxing beach getaway. | Devbag Beach, Water sports activities, Scuba diving, Nearby resorts |
| Tarkarli Beach | Famous for its clear waters and beach shacks, Tarkarli is ideal for those seeking adventure and beach activities. | Tarkarli Beach, Scuba diving, Malvan Marine Sanctuary, Water sports |
| Sindhudurg Fort | Historic fort offering stunning views and a glimpse into the region's history. Popular with tourists interested in history and architecture. | Sindhudurg Fort, Historical tours, Coastal views |
| Khamboli Lake | A picturesque lake surrounded by hills, perfect for nature lovers and those seeking tranquility. Great for picnics and sightseeing. | Khamboli Lake, Scenic views, Bird watching |
| Malvan Market | A bustling market area where visitors can experience local culture and cuisine. Great for food lovers and souvenir shopping. | Local seafood, Spice shops, Souvenir shopping |
| Nivati Beach | A lesser-known beach offering peace and quiet, ideal for those looking to escape the crowds. | Nivati Beach, Sunbathing, Swimming |
| Devbag Sangam | The confluence of the river and the sea, known for its picturesque views and water activities. A popular spot for boat rides. | Boat rides, Sunset views, Photography |
| Malvan's historic temples | Home to several ancient temples, this area attracts visitors interested in culture and history. | Bhira Devi Temple, Malik Devi Temple, Sightseeing |
Understanding Airbnb License Requirements & STR Laws in Malvan (2026)
While Malvan, Maharashtra, India currently shows low STR regulations, specific Airbnb license requirements might still exist or change. Always verify the latest short term rental regulations and Airbnb license requirements directly with local government authorities for Malvan to ensure full compliance before hosting.
(Source: AirROI data, 2026, finding no licensed listings among those analyzed)
Top Performing Airbnb Properties in Malvan (2026)
Benchmark your potential! Explore examples of top-performing Airbnb properties in Malvanbased on Trailing Twelve Month (TTM) revenue. Analyze their characteristics, revenue, occupancy rate, and ADR to understand what drives success in this market.

Beach front Nautical Nook 4bhk Villa @ Tarkarli
Entire Place • 4 bedrooms
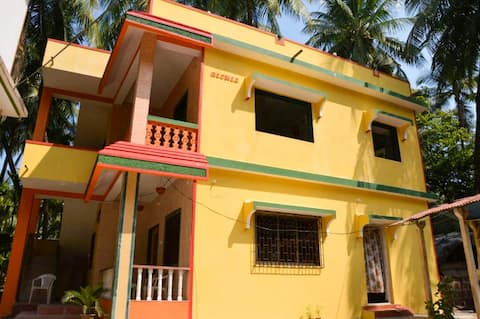
Coastal Vibes - 2 BHK in Malvan | 400m from beach
Entire Place • 2 bedrooms
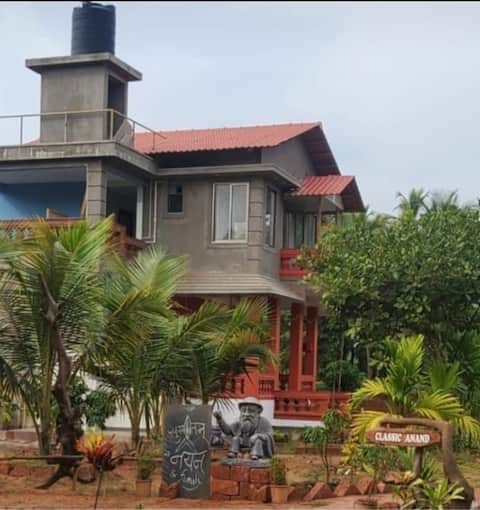
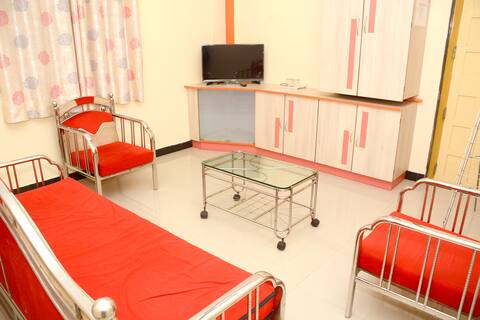
Classic Anand-Imperial Suite, 1st Floor, Tarkarli
Private Room • N/A
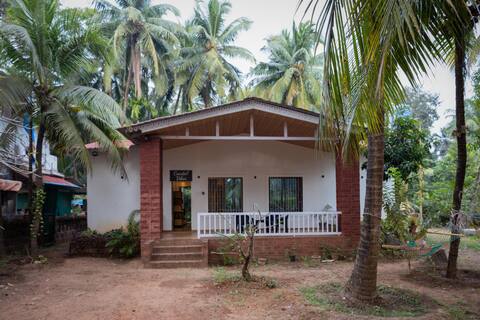
"REVANKAR RESIDENCY" Malvan (Near Tarkarli Beach)
Private Room • N/A
BeTHEL Home 2AC Rooms 1 AC Hall for 12 guests
Entire Place • 2 bedrooms
Classic Anand Bungalow-Blossom Suite, Tarkarli
Private Room • N/A
Note: Performance varies based on location, size, amenities, seasonality, and management quality. Data reflects the past 12 months.
Top Performing Airbnb Hosts in Malvan (2026)
Learn from the best! This table showcases top-performing Airbnb hosts in Malvan based on the number of properties managed and estimated total revenue over the past year. Analyze their scale and performance metrics.
| Host Name | Properties | Grossing Revenue | Stay Reviews | Avg Rating |
|---|---|---|---|---|
| Niyoti | 1 | $23,091 | 13 | 4.38/5.0 |
| Jyoti | 1 | $11,156 | 68 | 4.74/5.0 |
| Mr. Shobhan | 2 | $3,881 | 5 | 4.50/5.0 |
| Leena | 2 | $2,782 | 21 | 4.74/5.0 |
| Julie | 2 | $2,223 | 12 | 4.27/5.0 |
| Suvarna | 3 | $1,568 | 41 | 4.46/5.0 |
| Rujay | 1 | $497 | 6 | 4.33/5.0 |
| Vikram | 1 | $370 | 83 | 4.83/5.0 |
| Vicky | 1 | $333 | 16 | 4.50/5.0 |
| Shankar | 1 | $292 | 2 | Not Rated |
Analyzing the strategies of top hosts, such as their property selection, pricing, and guest communication, can offer valuable lessons for optimizing your own Airbnb operations in Malvan.
Dive Deeper: Advanced Malvan STR Market Data (2026)
Ready to unlock more insights? AirROI provides access to advanced metrics and comprehensive Airbnb data for Malvan. Explore detailed analytics beyond this report to refine your investment strategy, optimize pricing, and maximize your vacation rental profits.
Explore Advanced MetricsMalvan Short-Term Rental Market Composition (2026): Property & Room Types
Room Type Distribution
Property Type Distribution
Market Composition Insights for Malvan
- The Malvan Airbnb market composition is heavily skewed towards Private Room listings, which make up 81% of the 21 active rentals. This indicates strong guest preference for privacy and space.
- Looking at the property type distribution in Malvan, House properties are the most common (61.9%), reflecting the local real estate landscape.
- Houses represent a significant 61.9% portion, catering likely to families or larger groups.
- The presence of 28.6% Hotel/Boutique listings indicates integration with traditional hospitality.
- Smaller segments like others, outdoor/unique (combined 9.6%) offer potential for unique stay experiences.
Malvan Airbnb Room Capacity Analysis (2026): Bedroom Distribution
Distribution of Listings by Number of Bedrooms
Room Capacity Insights for Malvan
- The dominant room capacity in Malvan is 2 bedrooms listings, making up 19% of the market. This suggests a strong demand for properties suitable for couples or solo travelers.
- Together, 2 bedrooms and 3 bedrooms properties represent 28.5% of the active Airbnb listings in Malvan, indicating a high concentration in these sizes.
- A significant 23.8% of listings offer 3+ bedrooms, catering to larger groups and families seeking more space in Malvan.
Malvan Vacation Rental Guest Capacity Trends (2026)
Distribution of Listings by Guest Capacity
Guest Capacity Insights for Malvan
- The most common guest capacity trend in Malvan vacation rentals is listings accommodating 8+ guests (19%). This suggests the primary traveler segment is likely larger groups.
- Properties designed for 8+ guests and 3 guests dominate the Malvan STR market, accounting for 23.8% of listings.
- 19.0% of properties accommodate 6+ guests, serving the market segment for larger families or group travel in Malvan.
- On average, properties in Malvan are equipped to host 2.1 guests.
Malvan Airbnb Booking Patterns (2026): Available vs. Booked Days
Available Days Distribution
Booked Days Distribution
Booking Pattern Insights for Malvan
- The most common availability pattern in Malvan falls within the 271-366 days range, representing 90.5% of listings. This suggests many properties have significant open periods on their calendars.
- Approximately 100.0% of listings show high availability (181+ days open annually), indicating potential for increased bookings or specific owner usage patterns.
- For booked days, the 1-30 days range is most frequent in Malvan (57.1%), reflecting common guest stay durations or potential owner blocking patterns.
Malvan Airbnb Minimum Stay Requirements Analysis
Distribution of Listings by Minimum Night Requirement
1 Night
20 listings
95.2% of total
30+ Nights
1 listings
4.8% of total
Key Insights
- The most prevalent minimum stay requirement in Malvan is 1 Night, adopted by 95.2% of listings. This highlights the market's preference for shorter, flexible bookings.
- A strong majority (95.2%) of the Malvan Airbnb data shows acceptance of very short stays (1-2 nights), indicating a dynamic, high-turnover market.
Recommendations
- Align with the market by considering a 1 Night minimum stay, as 95.2% of Malvan hosts use this setting.
- Adjust minimum nights based on seasonality – potentially shorter during low season and longer during peak demand periods in Malvan.
Malvan Airbnb Cancellation Policy Trends Analysis (2026)
Flexible
8 listings
38.1% of total
Moderate
4 listings
19% of total
Firm
8 listings
38.1% of total
Strict
1 listings
4.8% of total
Cancellation Policy Insights for Malvan
- The prevailing Airbnb cancellation policy trend in Malvan is Flexible, used by 38.1% of listings.
- There's a relatively balanced mix between guest-friendly (57.1%) and stricter (42.9%) policies, offering choices for different guest needs.
- Strict cancellation policies are quite rare (4.8%), potentially making listings with this policy less competitive unless justified by high demand or property type.
Recommendations for Hosts
- Consider adopting a Flexible policy to align with the 38.1% market standard in Malvan.
- Using a Strict policy might deter some guests, as only 4.8% of listings use it. Evaluate if potential revenue protection outweighs possible lower booking rates.
- Regularly review your cancellation policy against competitors and market demand shifts in Malvan.
Malvan STR Booking Lead Time Analysis (2026)
Average Booking Lead Time by Month
Booking Lead Time Insights for Malvan
- The overall average booking lead time for vacation rentals in Malvan is 19 days.
- Guests book furthest in advance for stays during May (average 35 days), likely coinciding with peak travel demand or local events.
- The shortest booking windows occur for stays in July (average 7 days), indicating more last-minute travel plans during this time.
- Seasonally, Winter (25 days avg.) sees the longest lead times, while Summer (10 days avg.) has the shortest, reflecting typical travel planning cycles.
Recommendations for Hosts
- Use the overall average lead time (19 days) as a baseline for your pricing and availability strategy in Malvan.
- For May stays, consider implementing length-of-stay discounts or slightly higher rates for bookings made less than 35 days out to capitalize on advance planning.
- During July, focus on last-minute booking availability and promotions, as guests book with very short notice (7 days avg.).
- Target marketing efforts for the Winter season well in advance (at least 25 days) to capture early planners.
- Monitor your own booking lead times against these Malvan averages to identify opportunities for dynamic pricing adjustments.
Popular & Essential Airbnb Amenities in Malvan (2026)
Amenity Prevalence
Amenity Insights for Malvan
- Essential amenities in Malvan that guests expect include: Free parking on premises. Lacking these (this) could significantly impact bookings.
- Popular amenities like Wifi, First aid kit, Private entrance are common but not universal. Offering these can provide a competitive edge.
- Warning: Wifi is not universally provided but is considered essential globally. Ensure reliable Wifi is offered.
Recommendations for Hosts
- Ensure your listing includes all essential amenities for Malvan: Free parking on premises.
- Prioritize adding missing essentials: Free parking on premises.
- Consider adding popular differentiators like Wifi or First aid kit to increase appeal.
- Highlight unique or less common amenities you offer (e.g., hot tub, dedicated workspace, EV charger) in your listing description and photos.
- Regularly check competitor amenities in Malvan to stay competitive.
Malvan Airbnb Guest Demographics & Profile Analysis (2026)
Guest Profile Summary for Malvan
- The typical guest profile for Airbnb in Malvan consists of primarily domestic travelers (79%), often arriving from nearby Pune, typically belonging to the Post-2000s (Gen Z/Alpha) group (50%), primarily speaking English or Hindi.
- Domestic travelers account for 78.6% of guests.
- Key international markets include India (78.6%) and United Kingdom (14.3%).
- Top languages spoken are English (41.2%) followed by Hindi (35.3%).
- A significant demographic segment is the Post-2000s (Gen Z/Alpha) group, representing 50% of guests.
Recommendations for Hosts
- Target domestic marketing efforts towards travelers from Pune and Ithaca.
- Tailor amenities and listing descriptions to appeal to the dominant Post-2000s (Gen Z/Alpha) demographic (e.g., highlight fast WiFi, smart home features, local guides).
- Highlight unique local experiences or amenities relevant to the primary guest profile.
- Consider seasonal promotions aligned with peak travel times for key origin markets.
Nearby Short-Term Rental Market Comparison
How does the Malvan Airbnb market stack up against its neighbors? Compare key performance metrics like average monthly revenue, ADR, and occupancy rates in surrounding areas to understand the broader regional STR landscape.
| Market | Active Properties | Monthly Revenue | Daily Rate | Avg. Occupancy |
|---|---|---|---|---|
| Verla | 12 | $1,408 | $228.43 | 34% |
| Assagao | 307 | $1,350 | $179.91 | 34% |
| Pilern | 16 | $1,254 | $167.86 | 36% |
| Badem | 325 | $1,204 | $179.96 | 31% |
| Marna | 137 | $1,173 | $159.27 | 34% |
| Sinquerim | 113 | $1,105 | $113.10 | 39% |
| Nagoa | 96 | $1,069 | $199.63 | 25% |
| Nerul | 31 | $1,069 | $178.26 | 32% |
| Cacra | 23 | $1,046 | $126.08 | 34% |
| Vagator | 240 | $1,015 | $140.15 | 31% |