Mira-Bhayander Airbnb Market Analysis 2026: Short Term Rental Data & Vacation Rental Statistics in Maharashtra, India
Is Airbnb profitable in Mira-Bhayander in 2026? Explore comprehensive Airbnb analytics for Mira-Bhayander, Maharashtra, India to uncover income potential. This 2026 STR market report for Mira-Bhayander, based on AirROI data from February 2025 to January 2026, reveals key trends in the niche market of 30 active listings.
Whether you're considering an Airbnb investment in Mira-Bhayander, optimizing your existing vacation rental, or exploring rental arbitrage opportunities, understanding the Mira-Bhayander Airbnb data is crucial. Leveraging the low regulation environment is key to maximizing your short term rental income potential. Let's dive into the specifics.
Key Mira-Bhayander Airbnb Performance Metrics Overview
Monthly Airbnb Revenue Variations & Income Potential in Mira-Bhayander (2026)
Understanding the monthly revenue variations for Airbnb listings in Mira-Bhayander is key to maximizing your short term rental income potential. Seasonality significantly impacts earnings. Our analysis, based on data from the past 12 months, shows that the peak revenue month for STRs in Mira-Bhayander is typically October, while January often presents the lowest earnings, highlighting opportunities for strategic pricing adjustments during shoulder and low seasons. Explore the typical Airbnb income in Mira-Bhayander across different performance tiers:
- Best-in-class properties (Top 10%) achieve $1,458+ monthly, often utilizing dynamic pricing and superior guest experiences.
- Strong performing properties (Top 25%) earn $857 or more, indicating effective management and desirable locations/amenities.
- Typical properties (Median) generate around $405 per month, representing the average market performance.
- Entry-level properties (Bottom 25%) see earnings around $189, often with potential for optimization.
Average Monthly Airbnb Earnings Trend in Mira-Bhayander
Mira-Bhayander Airbnb Occupancy Rate Trends (2026)
Maximize your bookings by understanding the Mira-Bhayander STR occupancy trends. Seasonal demand shifts significantly influence how often properties are booked. Typically, Novembersees the highest demand (peak season occupancy), while April experiences the lowest (low season). Effective strategies, like adjusting minimum stays or offering promotions, can boost occupancy during slower periods. Here's how different property tiers perform in Mira-Bhayander:
- Best-in-class properties (Top 10%) achieve 51%+ occupancy, indicating high desirability and potentially optimized availability.
- Strong performing properties (Top 25%) maintain 34% or higher occupancy, suggesting good market fit and guest satisfaction.
- Typical properties (Median) have an occupancy rate around 19%.
- Entry-level properties (Bottom 25%) average 9% occupancy, potentially facing higher vacancy.
Average Monthly Occupancy Rate Trend in Mira-Bhayander
Average Daily Rate (ADR) Airbnb Trends in Mira-Bhayander (2026)
Effective short term rental pricing strategy in Mira-Bhayander involves understanding monthly ADR fluctuations. The Average Daily Rate (ADR) for Airbnb in Mira-Bhayander typically peaks in December and dips lowest during November. Leveraging Airbnb dynamic pricing tools or strategies based on this seasonality can significantly boost revenue. Here's a look at the typical nightly rates achieved:
- Best-in-class properties (Top 10%) command rates of $200+ per night, often due to premium features or locations.
- Strong performing properties (Top 25%) achieve nightly rates of $158 or more.
- Typical properties (Median) charge around $47 per night.
- Entry-level properties (Bottom 25%) earn around $26 per night.
Average Daily Rate (ADR) Trend by Month in Mira-Bhayander
Get Live Mira-Bhayander Market Intelligence 👇

Explore Real-time Analytics
Airbnb Seasonality Analysis & Trends in Mira-Bhayander (2026)
Peak Season (October, November, September)
- Revenue averages $883 per month
- Occupancy rates average 27.8%
- Daily rates average $88
Shoulder Season
- Revenue averages $664 per month
- Occupancy maintains around 24.7%
- Daily rates hold near $92
Low Season (January, March, April)
- Revenue drops to average $458 per month
- Occupancy decreases to average 20.2%
- Daily rates adjust to average $90
Seasonality Insights for Mira-Bhayander
- The Airbnb seasonality in Mira-Bhayander shows highly seasonal trends requiring careful strategy. While the sections above show seasonal averages, it's also insightful to look at the extremes:
- During the high season, the absolute peak month showcases Mira-Bhayander's highest earning potential, with monthly revenues capable of climbing to $954, occupancy reaching a high of 28.7%, and ADRs peaking at $93.
- Conversely, the slowest single month of the year, typically falling within the low season, marks the market's lowest point. In this month, revenue might dip to $398, occupancy could drop to 17.4%, and ADRs may adjust down to $88.
- Understanding both the seasonal averages and these monthly peaks and troughs in revenue, occupancy, and ADR is crucial for maximizing your Airbnb profit potential in Mira-Bhayander.
Seasonal Strategies for Maximizing Profit
- Peak Season: Maximize revenue through premium pricing and potentially longer minimum stays. Ensure high availability.
- Low Season: Offer competitive pricing, special promotions (e.g., extended stay discounts), and flexible cancellation policies. Target off-season travelers like remote workers or budget-conscious guests.
- Shoulder Seasons: Implement dynamic pricing that balances peak and low rates. Target weekend travelers or specific events. Offer slightly more flexible terms than peak season.
- Regularly analyze your own performance against these Mira-Bhayander seasonality benchmarks and adjust your pricing and availability strategy accordingly.
Best Areas for Airbnb Investment in Mira-Bhayander (2026)
Exploring the top neighborhoods for short-term rentals in Mira-Bhayander? This section highlights key areas, outlining why they are attractive for hosts and guests, along with notable local attractions. Consider these locations based on your target guest profile and investment strategy.
| Neighborhood / Area | Why Host Here? (Target Guests & Appeal) | Key Attractions & Landmarks |
|---|---|---|
| Mira Road | A bustling suburban area with excellent connectivity and growing residential developments. It attracts families and young professionals looking for affordable housing options. | Mira Road Railway Station, Kandarpada Shopping Complex, Oshiwara River, Kandivali National Park, Dindayal Memorial Park |
| Bhayander West | Known for its vibrant local culture and close proximity to the beach. Popular among locals and travelers seeking an authentic experience away from the hustle of the city. | Bhayander Beach, Siddhivinayak Temple, Galaxy Mall, Dahisar Lake, Local street food hubs |
| Bhayander East | This area is experiencing rapid urban development and has a variety of affordable accommodation options, making it appealing for budget-conscious travelers. | Bhayander Railway Station, Vardhman Fantasy Park, Nirmal Lifestyle Mall, Serene Church, Local markets |
| Mira Bhayander Municipal Corporation Area | The administrative hub for local governance with various public services and facilities. This area attracts business travelers and visitors. | Shree Hari Mandir, Local government parks, Community events, Public libraries |
| Kandarpada | A more upscale neighborhood within Mira Bhayander with access to high-end amenities and residential complexes. Attractive for affluent travelers. | Kandarpada Mall, Luxury resorts, Fine dining restaurants, Cultural centers |
| Global City | A rapidly developing township with modern apartments and self-sufficient amenities, attracting young urban dwellers and short-term tenants. | Global City Business Park, Shopping districts, Recreation facilities, Cafes and eateries |
| Mahavir Nagar | A centrally located area with a blend of residential and commercial spaces, making it easy for travelers to access key destinations. | Mahavir Nagar Park, Local shopping areas, Religious sites, Public transport hubs |
| Shahaji Raje Krida Sankul | A sports complex and community area, which hosts various events and sporting activities, appealing to families and sports enthusiasts. | Shahaji Raje Krida Sankul Sports Complex, Community events and fairs, Local gyms and fitness centers |
Understanding Airbnb License Requirements & STR Laws in Mira-Bhayander (2026)
While Mira-Bhayander, Maharashtra, India currently shows low STR regulations, specific Airbnb license requirements might still exist or change. Always verify the latest short term rental regulations and Airbnb license requirements directly with local government authorities for Mira-Bhayander to ensure full compliance before hosting.
(Source: AirROI data, 2026, finding no licensed listings among those analyzed)
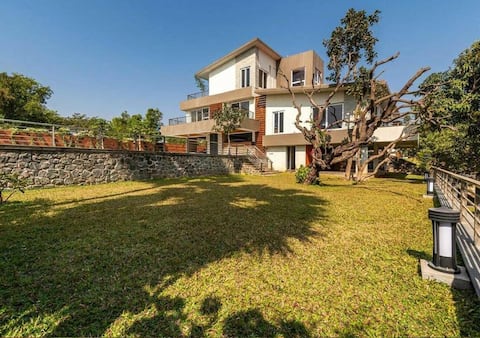
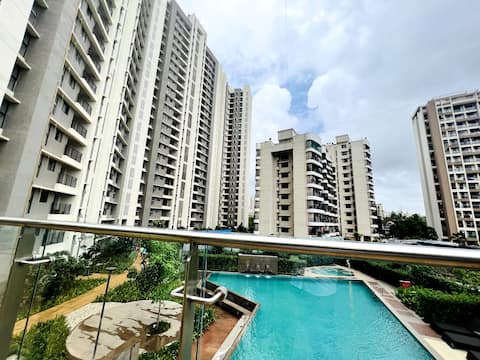
Top Performing Airbnb Properties in Mira-Bhayander (2026)
Benchmark your potential! Explore examples of top-performing Airbnb properties in Mira-Bhayanderbased on Trailing Twelve Month (TTM) revenue. Analyze their characteristics, revenue, occupancy rate, and ADR to understand what drives success in this market.

Gorai Beach | 4 Bed Ocean Front Private Pool Villa
Entire Place • 4 bedrooms

Stayhaven Starmount 4BHK & pool
Entire Place • 4 bedrooms

Mimosa-by villas to stayy
Entire Place • 3 bedrooms
Seaview Soirée – Vacation Home in Gorai, Mumbai
Entire Place • 3 bedrooms
2BHK Luxury Apt Mira Road Self Check-in Work-Ready
Entire Place • 2 bedrooms

2BHK Apt on 35th floor with SeaMountainCityView
Entire Place • 2 bedrooms
Note: Performance varies based on location, size, amenities, seasonality, and management quality. Data reflects the past 12 months.
Top Performing Airbnb Hosts in Mira-Bhayander (2026)
Learn from the best! This table showcases top-performing Airbnb hosts in Mira-Bhayander based on the number of properties managed and estimated total revenue over the past year. Analyze their scale and performance metrics.
| Host Name | Properties | Grossing Revenue | Stay Reviews | Avg Rating |
|---|---|---|---|---|
| Himanshu | 3 | $29,855 | 182 | 4.99/5.0 |
| Satish | 1 | $26,779 | 17 | 4.88/5.0 |
| Villas To Stayy | 1 | $14,881 | 51 | 4.96/5.0 |
| Sanjai | 1 | $14,383 | 90 | 4.90/5.0 |
| Abhishek | 3 | $11,893 | 67 | 4.70/5.0 |
| Dipti | 1 | $10,660 | 96 | 4.83/5.0 |
| Dr Jinal Mehta Modi | 1 | $9,621 | 26 | 4.92/5.0 |
| Ramesh | 1 | $8,068 | 6 | 4.17/5.0 |
| Smit | 2 | $5,813 | 92 | 4.70/5.0 |
| Nishi | 1 | $3,954 | 6 | 3.67/5.0 |
Analyzing the strategies of top hosts, such as their property selection, pricing, and guest communication, can offer valuable lessons for optimizing your own Airbnb operations in Mira-Bhayander.
Dive Deeper: Advanced Mira-Bhayander STR Market Data (2026)
Ready to unlock more insights? AirROI provides access to advanced metrics and comprehensive Airbnb data for Mira-Bhayander. Explore detailed analytics beyond this report to refine your investment strategy, optimize pricing, and maximize your vacation rental profits.
Explore Advanced MetricsMira-Bhayander Short-Term Rental Market Composition (2026): Property & Room Types
Room Type Distribution
Property Type Distribution
Market Composition Insights for Mira-Bhayander
- The Mira-Bhayander Airbnb market composition is heavily skewed towards Entire Home/Apt listings, which make up 83.3% of the 30 active rentals. This indicates strong guest preference for privacy and space.
- Looking at the property type distribution in Mira-Bhayander, House properties are the most common (60%), reflecting the local real estate landscape.
- Houses represent a significant 60% portion, catering likely to families or larger groups.
Mira-Bhayander Airbnb Room Capacity Analysis (2026): Bedroom Distribution
Distribution of Listings by Number of Bedrooms
Room Capacity Insights for Mira-Bhayander
- The dominant room capacity in Mira-Bhayander is 1 bedroom listings, making up 30% of the market. This suggests a strong demand for properties suitable for couples or solo travelers.
- Together, 1 bedroom and 3 bedrooms properties represent 53.3% of the active Airbnb listings in Mira-Bhayander, indicating a high concentration in these sizes.
- A significant 43.3% of listings offer 3+ bedrooms, catering to larger groups and families seeking more space in Mira-Bhayander.
Mira-Bhayander Vacation Rental Guest Capacity Trends (2026)
Distribution of Listings by Guest Capacity
Guest Capacity Insights for Mira-Bhayander
- The most common guest capacity trend in Mira-Bhayander vacation rentals is listings accommodating 8+ guests (50%). This suggests the primary traveler segment is likely larger groups.
- Properties designed for 8+ guests and 2 guests dominate the Mira-Bhayander STR market, accounting for 60.0% of listings.
- 63.4% of properties accommodate 6+ guests, serving the market segment for larger families or group travel in Mira-Bhayander.
- On average, properties in Mira-Bhayander are equipped to host 5.5 guests.
Mira-Bhayander Airbnb Booking Patterns (2026): Available vs. Booked Days
Available Days Distribution
Booked Days Distribution
Booking Pattern Insights for Mira-Bhayander
- The most common availability pattern in Mira-Bhayander falls within the 271-366 days range, representing 76.7% of listings. This suggests many properties have significant open periods on their calendars.
- Approximately 100.0% of listings show high availability (181+ days open annually), indicating potential for increased bookings or specific owner usage patterns.
- For booked days, the 31-90 days range is most frequent in Mira-Bhayander (43.3%), reflecting common guest stay durations or potential owner blocking patterns.
Mira-Bhayander Airbnb Minimum Stay Requirements Analysis
Distribution of Listings by Minimum Night Requirement
1 Night
25 listings
83.3% of total
2 Nights
2 listings
6.7% of total
30+ Nights
3 listings
10% of total
Key Insights
- The most prevalent minimum stay requirement in Mira-Bhayander is 1 Night, adopted by 83.3% of listings. This highlights the market's preference for shorter, flexible bookings.
- A strong majority (90.0%) of the Mira-Bhayander Airbnb data shows acceptance of very short stays (1-2 nights), indicating a dynamic, high-turnover market.
Recommendations
- Align with the market by considering a 1 Night minimum stay, as 83.3% of Mira-Bhayander hosts use this setting.
- Explore offering discounts for stays of 30+ nights to attract the 10% of the market seeking extended stays.
- Adjust minimum nights based on seasonality – potentially shorter during low season and longer during peak demand periods in Mira-Bhayander.
Mira-Bhayander Airbnb Cancellation Policy Trends Analysis (2026)
Flexible
9 listings
30% of total
Moderate
9 listings
30% of total
Firm
6 listings
20% of total
Strict
6 listings
20% of total
Cancellation Policy Insights for Mira-Bhayander
- The prevailing Airbnb cancellation policy trend in Mira-Bhayander is Flexible, used by 30% of listings.
- There's a relatively balanced mix between guest-friendly (60.0%) and stricter (40.0%) policies, offering choices for different guest needs.
Recommendations for Hosts
- Consider adopting a Flexible policy to align with the 30% market standard in Mira-Bhayander.
- Regularly review your cancellation policy against competitors and market demand shifts in Mira-Bhayander.
Mira-Bhayander STR Booking Lead Time Analysis (2026)
Average Booking Lead Time by Month
Booking Lead Time Insights for Mira-Bhayander
- The overall average booking lead time for vacation rentals in Mira-Bhayander is 13 days.
- Guests book furthest in advance for stays during January (average 29 days), likely coinciding with peak travel demand or local events.
- The shortest booking windows occur for stays in April (average 7 days), indicating more last-minute travel plans during this time.
- Seasonally, Winter (20 days avg.) sees the longest lead times, while Spring (11 days avg.) has the shortest, reflecting typical travel planning cycles.
Recommendations for Hosts
- Use the overall average lead time (13 days) as a baseline for your pricing and availability strategy in Mira-Bhayander.
- For January stays, consider implementing length-of-stay discounts or slightly higher rates for bookings made less than 29 days out to capitalize on advance planning.
- Target marketing efforts for the Winter season well in advance (at least 20 days) to capture early planners.
- Monitor your own booking lead times against these Mira-Bhayander averages to identify opportunities for dynamic pricing adjustments.
Popular & Essential Airbnb Amenities in Mira-Bhayander (2026)
Amenity Prevalence
Amenity Insights for Mira-Bhayander
- Essential amenities in Mira-Bhayander that guests expect include: Air conditioning. Lacking these (this) could significantly impact bookings.
- Popular amenities like Wifi, Kitchen, TV are common but not universal. Offering these can provide a competitive edge.
- Warning: Wifi is not universally provided but is considered essential globally. Ensure reliable Wifi is offered.
Recommendations for Hosts
- Ensure your listing includes all essential amenities for Mira-Bhayander: Air conditioning.
- Consider adding popular differentiators like Wifi or Kitchen to increase appeal.
- Highlight unique or less common amenities you offer (e.g., hot tub, dedicated workspace, EV charger) in your listing description and photos.
- Regularly check competitor amenities in Mira-Bhayander to stay competitive.
Mira-Bhayander Airbnb Guest Demographics & Profile Analysis (2026)
Guest Profile Summary for Mira-Bhayander
- The typical guest profile for Airbnb in Mira-Bhayander consists of primarily domestic travelers (69%), often arriving from nearby Mumbai, typically belonging to the Post-2000s (Gen Z/Alpha) group (50%), primarily speaking English or Hindi.
- Domestic travelers account for 68.5% of guests.
- Key international markets include India (68.5%) and United States (13%).
- Top languages spoken are English (42.6%) followed by Hindi (36.1%).
- A significant demographic segment is the Post-2000s (Gen Z/Alpha) group, representing 50% of guests.
Recommendations for Hosts
- Target domestic marketing efforts towards travelers from Mumbai and Mira Bhayandar.
- Tailor amenities and listing descriptions to appeal to the dominant Post-2000s (Gen Z/Alpha) demographic (e.g., highlight fast WiFi, smart home features, local guides).
- Highlight unique local experiences or amenities relevant to the primary guest profile.
- Consider seasonal promotions aligned with peak travel times for key origin markets.
Nearby Short-Term Rental Market Comparison
How does the Mira-Bhayander Airbnb market stack up against its neighbors? Compare key performance metrics like average monthly revenue, ADR, and occupancy rates in surrounding areas to understand the broader regional STR landscape.
| Market | Active Properties | Monthly Revenue | Daily Rate | Avg. Occupancy |
|---|---|---|---|---|
| Chondhi | 15 | $2,777 | $349.15 | 29% |
| Kihim | 11 | $2,317 | $296.88 | 27% |
| Gevhande Apati | 10 | $2,224 | $348.25 | 25% |
| Mahagaon | 12 | $1,989 | $268.55 | 33% |
| Chondi | 42 | $1,484 | $250.47 | 27% |
| Pimpari | 12 | $1,446 | $304.98 | 19% |
| Dhalewadi | 10 | $1,240 | $124.55 | 33% |
| Khandala | 25 | $1,229 | $250.56 | 24% |
| Awas | 26 | $1,128 | $233.10 | 22% |
| Waksai | 46 | $1,003 | $161.82 | 26% |