Kota Airbnb Market Analysis 2026: Short Term Rental Data & Vacation Rental Statistics in Rajasthan, India
Is Airbnb profitable in Kota in 2026? Explore comprehensive Airbnb analytics for Kota, Rajasthan, India to uncover income potential. This 2026 STR market report for Kota, based on AirROI data from May 2024 to April 2025, reveals key trends in the niche market of 18 active listings.
Whether you're considering an Airbnb investment in Kota, optimizing your existing vacation rental, or exploring rental arbitrage opportunities, understanding the Kota Airbnb data is crucial. Leveraging the low regulation environment is key to maximizing your short term rental income potential. Let's dive into the specifics.
Key Kota Airbnb Performance Metrics Overview
Monthly Airbnb Revenue Variations & Income Potential in Kota (2026)
Understanding the monthly revenue variations for Airbnb listings in Kota is key to maximizing your short term rental income potential. Seasonality significantly impacts earnings. Our analysis, based on data from the past 12 months, shows that the peak revenue month for STRs in Kota is typically June, while December often presents the lowest earnings, highlighting opportunities for strategic pricing adjustments during shoulder and low seasons. Explore the typical Airbnb income in Kota across different performance tiers:
- Best-in-class properties (Top 10%) achieve $1,656+ monthly, often utilizing dynamic pricing and superior guest experiences.
- Strong performing properties (Top 25%) earn $588 or more, indicating effective management and desirable locations/amenities.
- Typical properties (Median) generate around $372 per month, representing the average market performance.
- Entry-level properties (Bottom 25%) see earnings around $198, often with potential for optimization.
Average Monthly Airbnb Earnings Trend in Kota
Kota Airbnb Occupancy Rate Trends (2026)
Maximize your bookings by understanding the Kota STR occupancy trends. Seasonal demand shifts significantly influence how often properties are booked. Typically, Junesees the highest demand (peak season occupancy), while December experiences the lowest (low season). Effective strategies, like adjusting minimum stays or offering promotions, can boost occupancy during slower periods. Here's how different property tiers perform in Kota:
- Best-in-class properties (Top 10%) achieve 55%+ occupancy, indicating high desirability and potentially optimized availability.
- Strong performing properties (Top 25%) maintain 42% or higher occupancy, suggesting good market fit and guest satisfaction.
- Typical properties (Median) have an occupancy rate around 32%.
- Entry-level properties (Bottom 25%) average 23% occupancy, potentially facing higher vacancy.
Average Monthly Occupancy Rate Trend in Kota
Average Daily Rate (ADR) Airbnb Trends in Kota (2026)
Effective short term rental pricing strategy in Kota involves understanding monthly ADR fluctuations. The Average Daily Rate (ADR) for Airbnb in Kota typically peaks in December and dips lowest during November. Leveraging Airbnb dynamic pricing tools or strategies based on this seasonality can significantly boost revenue. Here's a look at the typical nightly rates achieved:
- Best-in-class properties (Top 10%) command rates of $88+ per night, often due to premium features or locations.
- Strong performing properties (Top 25%) achieve nightly rates of $26 or more.
- Typical properties (Median) charge around $18 per night.
- Entry-level properties (Bottom 25%) earn around $12 per night.
Average Daily Rate (ADR) Trend by Month in Kota
Get Live Kota Market Intelligence 👇

Explore Real-time Analytics
Airbnb Seasonality Analysis & Trends in Kota (2025)
Peak Season (June, May, November)
- Revenue averages $1,228 per month
- Occupancy rates average 73.9%
- Daily rates average $34
Shoulder Season
- Revenue averages $570 per month
- Occupancy maintains around 26.4%
- Daily rates hold near $36
Low Season (January, April, December)
- Revenue drops to average $192 per month
- Occupancy decreases to average 17.5%
- Daily rates adjust to average $38
Seasonality Insights for Kota
- The Airbnb seasonality in Kota shows highly seasonal trends requiring careful strategy. While the sections above show seasonal averages, it's also insightful to look at the extremes:
- During the high season, the absolute peak month showcases Kota's highest earning potential, with monthly revenues capable of climbing to $1,507, occupancy reaching a high of 86.7%, and ADRs peaking at $40.
- Conversely, the slowest single month of the year, typically falling within the low season, marks the market's lowest point. In this month, revenue might dip to $99, occupancy could drop to 5.9%, and ADRs may adjust down to $34.
- Understanding both the seasonal averages and these monthly peaks and troughs in revenue, occupancy, and ADR is crucial for maximizing your Airbnb profit potential in Kota.
Seasonal Strategies for Maximizing Profit
- Peak Season: Maximize revenue through premium pricing and potentially longer minimum stays. Ensure high availability.
- Low Season: Offer competitive pricing, special promotions (e.g., extended stay discounts), and flexible cancellation policies. Target off-season travelers like remote workers or budget-conscious guests.
- Shoulder Seasons: Implement dynamic pricing that balances peak and low rates. Target weekend travelers or specific events. Offer slightly more flexible terms than peak season.
- Regularly analyze your own performance against these Kota seasonality benchmarks and adjust your pricing and availability strategy accordingly.
Best Areas for Airbnb Investment in Kota (2026)
Exploring the top neighborhoods for short-term rentals in Kota? This section highlights key areas, outlining why they are attractive for hosts and guests, along with notable local attractions. Consider these locations based on your target guest profile and investment strategy.
| Neighborhood / Area | Why Host Here? (Target Guests & Appeal) | Key Attractions & Landmarks |
|---|---|---|
| City Palace | A historic architectural marvel and popular tourist site, attracting visitors interested in Rajasthani culture and heritage. Ideal for guests wanting to stay near a major cultural landmark. | City Palace, Jagdish Temple, Fateh Sagar Lake, Lake Pichola, Bagore Ki Haveli |
| Haveli Road | Known for its traditional havelis and vibrant local markets, this area offers a unique insight into local life and culture. Great for visitors looking for an authentic Rajasthani experience. | Old City Markets, Shopping for local handicrafts, Cultural tours of havelis, Street food of Udaipur, Local festivals |
| Saheliyon-ki-Bari | This beautiful garden is famous for its lush greenery and fountains, attracting those who enjoy serene environments and leisurely walks. Perfect for guests looking for tranquility. | Saheliyon-ki-Bari Garden, Fateh Sagar Lake activities, Rajasthani cultural performances, Heritage walks |
| Bada Mahal | A beautiful palace known for its unique architecture, offering guests scenic views and cultural experiences. Ideal for those interested in royal history and scenic spots. | Bada Mahal, Cultural dance performances, Palace museum, Walking trails with views of the city |
| Sukhadia Circle | This popular leisure spot is known for its restaurants and beautiful lake, attracting both locals and tourists. Great for families and those looking to enjoy local treats. | Sukhadia Circle Park, Boat rides, Local eateries, Evening strolls, Cultural events |
| Jag Mandir | This beautiful island palace offers stunning views and is a sought-after destination for weddings and special occasions, appealing to romantic getaways. | Jag Mandir Palace, Boat rides on Lake Pichola, Dining at the palace, Evening views of the sunset |
| Chittorgarh Fort | A UNESCO World Heritage site with rich history and majestic architecture, attracting history buffs and adventure seekers. Ideal for guests interested in exploring Rajasthan's past. | Chittorgarh Fort, Victory Tower, Rani Padmini Palace, Kumbhalgarh Fort nearby, Forts and heritage tours |
| Monsoon Palace | Located on a hilltop, this palace offers breathtaking panoramic views of the surrounding countryside, ideal for those who appreciate nature and photography. | Monsoon Palace, Sunset views, Wildlife watching, Nature trails, Adventure sports nearby |
Understanding Airbnb License Requirements & STR Laws in Kota (2026)
While Kota, Rajasthan, India currently shows low STR regulations, specific Airbnb license requirements might still exist or change. Always verify the latest short term rental regulations and Airbnb license requirements directly with local government authorities for Kota to ensure full compliance before hosting.
(Source: AirROI data, 2026, finding no licensed listings among those analyzed)
Top Performing Airbnb Properties in Kota (2026)
Benchmark your potential! Explore examples of top-performing Airbnb properties in Kotabased on Trailing Twelve Month (TTM) revenue. Analyze their characteristics, revenue, occupancy rate, and ADR to understand what drives success in this market.

Gurukripa Girls Residency
Private Room • 30 bedrooms
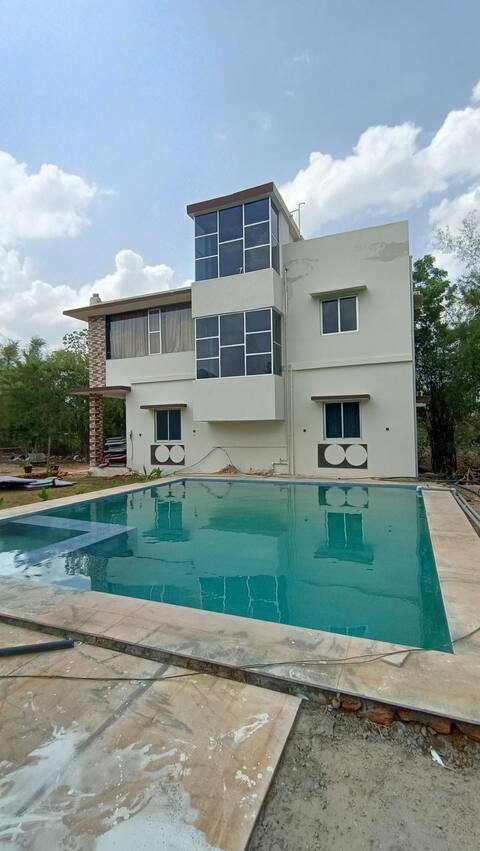
4: Bedroom Pool Villa @By Ovi Stays DATA
Entire Place • 4 bedrooms

A home away from home - Ashirvaad Homestay, Kota
Entire Place • 3 bedrooms
Entire apartment for use
Entire Place • 3 bedrooms
Affluence Abode
Entire Place • 3 bedrooms
Hotel Khatana Palace | Suit Room
Private Room • 1 bedroom
Note: Performance varies based on location, size, amenities, seasonality, and management quality. Data reflects the past 12 months.
Top Performing Airbnb Hosts in Kota (2026)
Learn from the best! This table showcases top-performing Airbnb hosts in Kota based on the number of properties managed and estimated total revenue over the past year. Analyze their scale and performance metrics.
| Host Name | Properties | Grossing Revenue | Stay Reviews | Avg Rating |
|---|---|---|---|---|
| Host #453333656 | 2 | $16,729 | 0 | 0.00/5.0 |
| Host #233297867 | 1 | $14,207 | 0 | 0.00/5.0 |
| Host #424414040 | 1 | $11,711 | 0 | 0.00/5.0 |
| Host #337966225 | 3 | $3,883 | 2 | 0.00/5.0 |
| Host #195757517 | 1 | $2,560 | 0 | 0.00/5.0 |
| Host #124460531 | 1 | $2,505 | 17 | 4.94/5.0 |
| Host #315482344 | 2 | $1,361 | 0 | 0.00/5.0 |
| Host #465823277 | 1 | $800 | 2 | 0.00/5.0 |
| Host #264849318 | 1 | $666 | 0 | 0.00/5.0 |
| Dhananjay | 3 | $365 | 18 | 4.79/5.0 |
Analyzing the strategies of top hosts, such as their property selection, pricing, and guest communication, can offer valuable lessons for optimizing your own Airbnb operations in Kota.
Dive Deeper: Advanced Kota STR Market Data (2026)
Ready to unlock more insights? AirROI provides access to advanced metrics and comprehensive Airbnb data for Kota. Explore detailed analytics beyond this report to refine your investment strategy, optimize pricing, and maximize your vacation rental profits.
Explore Advanced MetricsKota Short-Term Rental Market Composition (2026): Property & Room Types
Room Type Distribution
Property Type Distribution
Market Composition Insights for Kota
- The Kota Airbnb market composition is heavily skewed towards Private Room listings, which make up 77.8% of the 18 active rentals. This indicates strong guest preference for privacy and space.
- Looking at the property type distribution in Kota, Hotel/Boutique properties are the most common (55.6%), reflecting the local real estate landscape.
- Houses represent a significant 22.2% portion, catering likely to families or larger groups.
- The presence of 55.6% Hotel/Boutique listings indicates integration with traditional hospitality.
Kota Airbnb Room Capacity Analysis (2026): Bedroom Distribution
Distribution of Listings by Number of Bedrooms
Room Capacity Insights for Kota
- The dominant room capacity in Kota is 1 bedroom listings, making up 50% of the market. This suggests a strong demand for properties suitable for couples or solo travelers.
- Together, 1 bedroom and 5+ bedrooms properties represent 72.2% of the active Airbnb listings in Kota, indicating a high concentration in these sizes.
- A significant 44.5% of listings offer 3+ bedrooms, catering to larger groups and families seeking more space in Kota.
Kota Vacation Rental Guest Capacity Trends (2026)
Distribution of Listings by Guest Capacity
Guest Capacity Insights for Kota
- The most common guest capacity trend in Kota vacation rentals is listings accommodating 2 guests (33.3%). This suggests the primary traveler segment is likely couples or solo travelers.
- Properties designed for 2 guests and 3 guests dominate the Kota STR market, accounting for 50.0% of listings.
- A significant 44.4% of listings cater specifically to 1-2 guests, highlighting strong demand from couples and solo travelers in Kota.
- 33.4% of properties accommodate 6+ guests, serving the market segment for larger families or group travel in Kota.
- On average, properties in Kota are equipped to host 3.7 guests.
Kota Airbnb Booking Patterns (2026): Available vs. Booked Days
Available Days Distribution
Booked Days Distribution
Booking Pattern Insights for Kota
- The most common availability pattern in Kota falls within the 271-366 days range, representing 88.9% of listings. This suggests many properties have significant open periods on their calendars.
- Approximately 100.0% of listings show high availability (181+ days open annually), indicating potential for increased bookings or specific owner usage patterns.
- For booked days, the 31-90 days range is most frequent in Kota (55.6%), reflecting common guest stay durations or potential owner blocking patterns.
Kota Airbnb Minimum Stay Requirements Analysis
Distribution of Listings by Minimum Night Requirement
1 Night
16 listings
100% of total
Key Insights
- The most prevalent minimum stay requirement in Kota is 1 Night, adopted by 100% of listings. This highlights the market's preference for shorter, flexible bookings.
- A strong majority (100.0%) of the Kota Airbnb data shows acceptance of very short stays (1-2 nights), indicating a dynamic, high-turnover market.
Recommendations
- Align with the market by considering a 1 Night minimum stay, as 100% of Kota hosts use this setting.
- Adjust minimum nights based on seasonality – potentially shorter during low season and longer during peak demand periods in Kota.
Kota Airbnb Cancellation Policy Trends Analysis (2026)
Flexible
4 listings
100% of total
Cancellation Policy Insights for Kota
- The prevailing Airbnb cancellation policy trend in Kota is Flexible, used by 100% of listings.
- The market strongly favors guest-friendly terms, with 100.0% of listings offering Flexible or Moderate policies. This suggests guests in Kota may expect booking flexibility.
Recommendations for Hosts
- Consider adopting a Flexible policy to align with the 100% market standard in Kota.
- Given the high prevalence of Flexible policies (100%), offering this can enhance booking appeal, especially during shoulder seasons.
- Regularly review your cancellation policy against competitors and market demand shifts in Kota.
Kota STR Booking Lead Time Analysis (2026)
Average Booking Lead Time by Month
Booking Lead Time Insights for Kota
- The overall average booking lead time for vacation rentals in Kota is 14 days.
- Guests book furthest in advance for stays during December (average 36 days), likely coinciding with peak travel demand or local events.
- The shortest booking windows occur for stays in June (average 0 days), indicating more last-minute travel plans during this time.
- Seasonally, Winter (15 days avg.) sees the longest lead times, while Summer (2 days avg.) has the shortest, reflecting typical travel planning cycles.
Recommendations for Hosts
- Use the overall average lead time (14 days) as a baseline for your pricing and availability strategy in Kota.
- For December stays, consider implementing length-of-stay discounts or slightly higher rates for bookings made less than 36 days out to capitalize on advance planning.
- During June, focus on last-minute booking availability and promotions, as guests book with very short notice (0 days avg.).
- Target marketing efforts for the Winter season well in advance (at least 15 days) to capture early planners.
- Monitor your own booking lead times against these Kota averages to identify opportunities for dynamic pricing adjustments.
Popular & Essential Airbnb Amenities in Kota (2026)
Amenity Prevalence
Amenity Insights for Kota
- Essential amenities in Kota that guests expect include: TV, Hot water, Free parking on premises, Wifi, Air conditioning. Lacking these (any) could significantly impact bookings.
- Popular amenities like Heating, Essentials, Kitchen are common but not universal. Offering these can provide a competitive edge.
Recommendations for Hosts
- Ensure your listing includes all essential amenities for Kota: TV, Hot water, Free parking on premises, Wifi, Air conditioning.
- Consider adding popular differentiators like Heating or Essentials to increase appeal.
- Highlight unique or less common amenities you offer (e.g., hot tub, dedicated workspace, EV charger) in your listing description and photos.
- Regularly check competitor amenities in Kota to stay competitive.
Kota Airbnb Guest Demographics & Profile Analysis (2026)
Guest Profile Summary for Kota
- The typical guest profile for Airbnb in Kota consists of primarily domestic travelers (100%), often arriving from nearby New Delhi, typically belonging to the Post-2000s (Gen Z/Alpha) group (50%), primarily speaking Hindi or English.
- Domestic travelers account for 100.0% of guests.
- Top languages spoken are Hindi (28.6%) followed by English (28.6%).
- A significant demographic segment is the Post-2000s (Gen Z/Alpha) group, representing 50% of guests.
Recommendations for Hosts
- Target domestic marketing efforts towards travelers from New Delhi and Lucknow.
- Tailor amenities and listing descriptions to appeal to the dominant Post-2000s (Gen Z/Alpha) demographic (e.g., highlight fast WiFi, smart home features, local guides).
- Highlight unique local experiences or amenities relevant to the primary guest profile.
- Consider seasonal promotions aligned with peak travel times for key origin markets.
Nearby Short-Term Rental Market Comparison
How does the Kota Airbnb market stack up against its neighbors? Compare key performance metrics like average monthly revenue, ADR, and occupancy rates in surrounding areas to understand the broader regional STR landscape.
| Market | Active Properties | Monthly Revenue | Daily Rate | Avg. Occupancy |
|---|---|---|---|---|
| Jaipur | 63 | $744 | $131.73 | 23% |
| Jaipur Municipal Corporation | 1,445 | $394 | $60.58 | 25% |
| Pushkar | 63 | $348 | $65.85 | 18% |
| Mahapura | 10 | $342 | $83.34 | 13% |
| Sawai Madhopur | 17 | $300 | $61.36 | 20% |
| Ajmer | 41 | $200 | $41.47 | 20% |