Vattakanal Airbnb Market Analysis 2026: Short Term Rental Data & Vacation Rental Statistics in Tamil Nadu, India
Is Airbnb profitable in Vattakanal in 2026? Explore comprehensive Airbnb analytics for Vattakanal, Tamil Nadu, India to uncover income potential. This 2026 STR market report for Vattakanal, based on AirROI data from February 2025 to January 2026, reveals key trends in the niche market of 29 active listings.
Whether you're considering an Airbnb investment in Vattakanal, optimizing your existing vacation rental, or exploring rental arbitrage opportunities, understanding the Vattakanal Airbnb data is crucial. Leveraging the low regulation environment is key to maximizing your short term rental income potential. Let's dive into the specifics.
Key Vattakanal Airbnb Performance Metrics Overview
Monthly Airbnb Revenue Variations & Income Potential in Vattakanal (2026)
Understanding the monthly revenue variations for Airbnb listings in Vattakanal is key to maximizing your short term rental income potential. Seasonality significantly impacts earnings. Our analysis, based on data from the past 12 months, shows that the peak revenue month for STRs in Vattakanal is typically December, while July often presents the lowest earnings, highlighting opportunities for strategic pricing adjustments during shoulder and low seasons. Explore the typical Airbnb income in Vattakanal across different performance tiers:
- Best-in-class properties (Top 10%) achieve $630+ monthly, often utilizing dynamic pricing and superior guest experiences.
- Strong performing properties (Top 25%) earn $386 or more, indicating effective management and desirable locations/amenities.
- Typical properties (Median) generate around $210 per month, representing the average market performance.
- Entry-level properties (Bottom 25%) see earnings around $111, often with potential for optimization.
Average Monthly Airbnb Earnings Trend in Vattakanal
Vattakanal Airbnb Occupancy Rate Trends (2026)
Maximize your bookings by understanding the Vattakanal STR occupancy trends. Seasonal demand shifts significantly influence how often properties are booked. Typically, Februarysees the highest demand (peak season occupancy), while July experiences the lowest (low season). Effective strategies, like adjusting minimum stays or offering promotions, can boost occupancy during slower periods. Here's how different property tiers perform in Vattakanal:
- Best-in-class properties (Top 10%) achieve 35%+ occupancy, indicating high desirability and potentially optimized availability.
- Strong performing properties (Top 25%) maintain 24% or higher occupancy, suggesting good market fit and guest satisfaction.
- Typical properties (Median) have an occupancy rate around 13%.
- Entry-level properties (Bottom 25%) average 8% occupancy, potentially facing higher vacancy.
Average Monthly Occupancy Rate Trend in Vattakanal
Average Daily Rate (ADR) Airbnb Trends in Vattakanal (2026)
Effective short term rental pricing strategy in Vattakanal involves understanding monthly ADR fluctuations. The Average Daily Rate (ADR) for Airbnb in Vattakanal typically peaks in June and dips lowest during January. Leveraging Airbnb dynamic pricing tools or strategies based on this seasonality can significantly boost revenue. Here's a look at the typical nightly rates achieved:
- Best-in-class properties (Top 10%) command rates of $113+ per night, often due to premium features or locations.
- Strong performing properties (Top 25%) achieve nightly rates of $80 or more.
- Typical properties (Median) charge around $54 per night.
- Entry-level properties (Bottom 25%) earn around $41 per night.
Average Daily Rate (ADR) Trend by Month in Vattakanal
Get Live Vattakanal Market Intelligence 👇

Explore Real-time Analytics
Airbnb Seasonality Analysis & Trends in Vattakanal (2026)
Peak Season (December, August, April)
- Revenue averages $449 per month
- Occupancy rates average 18.7%
- Daily rates average $70
Shoulder Season
- Revenue averages $313 per month
- Occupancy maintains around 17.2%
- Daily rates hold near $70
Low Season (January, May, July)
- Revenue drops to average $253 per month
- Occupancy decreases to average 15.8%
- Daily rates adjust to average $71
Seasonality Insights for Vattakanal
- The Airbnb seasonality in Vattakanal shows highly seasonal trends requiring careful strategy. While the sections above show seasonal averages, it's also insightful to look at the extremes:
- During the high season, the absolute peak month showcases Vattakanal's highest earning potential, with monthly revenues capable of climbing to $555, occupancy reaching a high of 21.7%, and ADRs peaking at $75.
- Conversely, the slowest single month of the year, typically falling within the low season, marks the market's lowest point. In this month, revenue might dip to $232, occupancy could drop to 11.4%, and ADRs may adjust down to $64.
- Understanding both the seasonal averages and these monthly peaks and troughs in revenue, occupancy, and ADR is crucial for maximizing your Airbnb profit potential in Vattakanal.
Seasonal Strategies for Maximizing Profit
- Peak Season: Maximize revenue through premium pricing and potentially longer minimum stays. Ensure high availability.
- Low Season: Offer competitive pricing, special promotions (e.g., extended stay discounts), and flexible cancellation policies. Target off-season travelers like remote workers or budget-conscious guests.
- Shoulder Seasons: Implement dynamic pricing that balances peak and low rates. Target weekend travelers or specific events. Offer slightly more flexible terms than peak season.
- Regularly analyze your own performance against these Vattakanal seasonality benchmarks and adjust your pricing and availability strategy accordingly.
Best Areas for Airbnb Investment in Vattakanal (2026)
Exploring the top neighborhoods for short-term rentals in Vattakanal? This section highlights key areas, outlining why they are attractive for hosts and guests, along with notable local attractions. Consider these locations based on your target guest profile and investment strategy.
| Neighborhood / Area | Why Host Here? (Target Guests & Appeal) | Key Attractions & Landmarks |
|---|---|---|
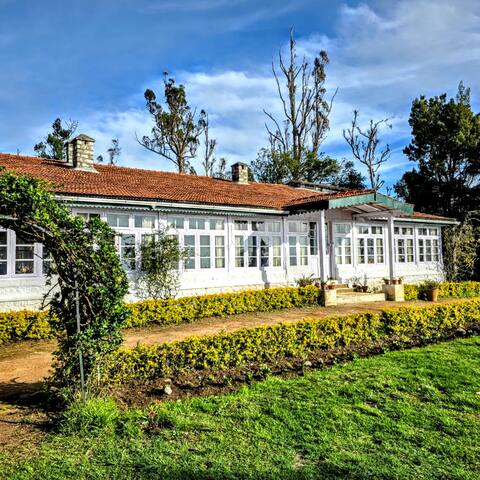
| Vattakanal Village | A charming village located near Kodaikanal, Vattakanal is known for its serene atmosphere and stunning views of the hills. Ideal for tourists seeking tranquility and nature, offering a perfect getaway from city life. | Vattakanal Waterfall, Kodaikanal Lake, Dolphin's Nose, Berijam Lake, Pillar Rocks |
| Kodaikanal Lake | A stunning star-shaped lake in the heart of Kodaikanal, attracting countless visitors for boating and scenic walks. It’s a prime location for Airbnb hosting due to its popularity with tourists. | Boating on Kodaikanal Lake, Coakers Walk, Lake Viewpoint, Bear Shola Falls |
| Pillar Rocks | Famous for its breathtaking view and rock formations, Pillar Rocks is a majestic site that draws nature lovers and adventure seekers. Its picturesque landscape makes it appealing for Airbnb investments. | Pillar Rocks Viewpoint, Berijam Lake, Vattakanal Trekking Trails |
| Dolphin's Nose | A vantage point that offers panoramic views of the valleys and hills, Dolphin's Nose is popular among hikers and those seeking scenic beauty, making it a great spot for hosting visitors. | Hiking Trails, Stunning viewpoints |
| Berijam Lake | A beautiful and lesser-known Lake that is surrounded by dense forests and wildlife, perfect for nature enthusiasts looking for solitude and serenity while visiting Kodaikanal. | Boating at Berijam Lake, Wildlife Photography, Nature Trails |
| Coaker's Walk | This scenic pathway offers incredible views of the mountains and valleys. It is frequented by tourists for a leisurely stroll, making it a great location to host Airbnb guests. | Scenic Viewpoints, Cafes along the path |
| Kodaikanal Solar Observatory | An important center for astronomical research, the Solar Observatory attracts visitors interested in science and astronomy, making it an interesting spot for Airbnb hosts. | Astronomy Tours, Telescopes, Beautiful Gardens |
| Silent Valley View Point | A breathtaking viewpoint that offers stunning panoramas of the surrounding landscape, ideal for travelers seeking peace and nature, thus a good investment for Airbnb. | Mountain Viewpoints, Hiking Trails |
Understanding Airbnb License Requirements & STR Laws in Vattakanal (2026)
While Vattakanal, Tamil Nadu, India currently shows low STR regulations, specific Airbnb license requirements might still exist or change. Always verify the latest short term rental regulations and Airbnb license requirements directly with local government authorities for Vattakanal to ensure full compliance before hosting.
(Source: AirROI data, 2026, finding no licensed listings among those analyzed)
Top Performing Airbnb Properties in Vattakanal (2026)
Benchmark your potential! Explore examples of top-performing Airbnb properties in Vattakanalbased on Trailing Twelve Month (TTM) revenue. Analyze their characteristics, revenue, occupancy rate, and ADR to understand what drives success in this market.
Milhaven Crest - Luxury Heritage Bungalow
Entire Place • 3 bedrooms

Misbha HomeStay.(Ground Floor)
Entire Place • 1 bedroom
Alwin homes balcony cottage
Entire Place • 2 bedrooms

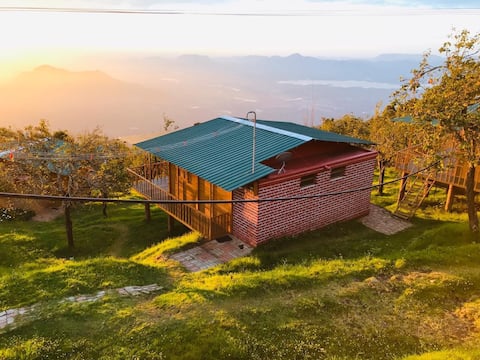
A rustic wooden cabin with a picturesque view
Entire Place • 1 bedroom
venice home's(2br furnished)
Private Room • N/A
Dive in Nature cabin/couple/3pax
Entire Place • 1 bedroom
Note: Performance varies based on location, size, amenities, seasonality, and management quality. Data reflects the past 12 months.
Top Performing Airbnb Hosts in Vattakanal (2026)
Learn from the best! This table showcases top-performing Airbnb hosts in Vattakanal based on the number of properties managed and estimated total revenue over the past year. Analyze their scale and performance metrics.
| Host Name | Properties | Grossing Revenue | Stay Reviews | Avg Rating |
|---|---|---|---|---|
| Nikhila | 1 | $18,192 | 3 | 5.00/5.0 |
| Sreelekh | 6 | $8,020 | 104 | 4.45/5.0 |
| Vattakanal Homestays | 8 | $6,672 | 93 | 4.50/5.0 |
| Venice | 3 | $6,307 | 55 | 4.70/5.0 |
| Selva | 1 | $5,204 | 11 | 4.91/5.0 |
| Alwin | 1 | $5,060 | 16 | 4.56/5.0 |
| Divakar | 1 | $4,143 | 56 | 4.46/5.0 |
| Karthikeyan | 2 | $2,760 | 3 | Not Rated |
| Sarath | 1 | $2,750 | 6 | 4.67/5.0 |
| Sanjitha Johra | 1 | $2,624 | 11 | 4.64/5.0 |
Analyzing the strategies of top hosts, such as their property selection, pricing, and guest communication, can offer valuable lessons for optimizing your own Airbnb operations in Vattakanal.
Dive Deeper: Advanced Vattakanal STR Market Data (2026)
Ready to unlock more insights? AirROI provides access to advanced metrics and comprehensive Airbnb data for Vattakanal. Explore detailed analytics beyond this report to refine your investment strategy, optimize pricing, and maximize your vacation rental profits.
Explore Advanced MetricsVattakanal Short-Term Rental Market Composition (2026): Property & Room Types
Room Type Distribution
Property Type Distribution
Market Composition Insights for Vattakanal
- The Vattakanal Airbnb market composition is heavily skewed towards Entire Home/Apt listings, which make up 58.6% of the 29 active rentals. This indicates strong guest preference for privacy and space.
- However, a notable 41.4% share for Private Rooms suggests opportunities for budget-conscious travelers or hosts renting out spare rooms.
- Looking at the property type distribution in Vattakanal, House properties are the most common (48.3%), reflecting the local real estate landscape.
- Houses represent a significant 48.3% portion, catering likely to families or larger groups.
- The presence of 10.3% Hotel/Boutique listings indicates integration with traditional hospitality.
- Smaller segments like others, apartment/condo, unique stays (combined 10.2%) offer potential for unique stay experiences.
Vattakanal Airbnb Room Capacity Analysis (2026): Bedroom Distribution
Distribution of Listings by Number of Bedrooms
Room Capacity Insights for Vattakanal
- The dominant room capacity in Vattakanal is 1 bedroom listings, making up 41.4% of the market. This suggests a strong demand for properties suitable for couples or solo travelers.
- Together, 1 bedroom and 2 bedrooms properties represent 58.6% of the active Airbnb listings in Vattakanal, indicating a high concentration in these sizes.
- Listings with 3+ bedrooms (3.4%) represent a smaller niche, potentially indicating an underserved market for larger group accommodations in Vattakanal.
Vattakanal Vacation Rental Guest Capacity Trends (2026)
Distribution of Listings by Guest Capacity
Guest Capacity Insights for Vattakanal
- The most common guest capacity trend in Vattakanal vacation rentals is listings accommodating 8+ guests (17.2%). This suggests the primary traveler segment is likely larger groups.
- Properties designed for 8+ guests and 2 guests dominate the Vattakanal STR market, accounting for 31.0% of listings.
- 24.1% of properties accommodate 6+ guests, serving the market segment for larger families or group travel in Vattakanal.
- On average, properties in Vattakanal are equipped to host 3.2 guests.
Vattakanal Airbnb Booking Patterns (2026): Available vs. Booked Days
Available Days Distribution
Booked Days Distribution
Booking Pattern Insights for Vattakanal
- The most common availability pattern in Vattakanal falls within the 271-366 days range, representing 93.1% of listings. This suggests many properties have significant open periods on their calendars.
- Approximately 100.0% of listings show high availability (181+ days open annually), indicating potential for increased bookings or specific owner usage patterns.
- For booked days, the 1-30 days range is most frequent in Vattakanal (55.2%), reflecting common guest stay durations or potential owner blocking patterns.
Vattakanal Airbnb Minimum Stay Requirements Analysis
Distribution of Listings by Minimum Night Requirement
1 Night
22 listings
75.9% of total
2 Nights
4 listings
13.8% of total
30+ Nights
3 listings
10.3% of total
Key Insights
- The most prevalent minimum stay requirement in Vattakanal is 1 Night, adopted by 75.9% of listings. This highlights the market's preference for shorter, flexible bookings.
- A strong majority (89.7%) of the Vattakanal Airbnb data shows acceptance of very short stays (1-2 nights), indicating a dynamic, high-turnover market.
- A significant segment (10.3%) caters to monthly stays (30+ nights) in Vattakanal, pointing to opportunities in the extended-stay market.
Recommendations
- Align with the market by considering a 1 Night minimum stay, as 75.9% of Vattakanal hosts use this setting.
- Explore offering discounts for stays of 30+ nights to attract the 10.3% of the market seeking extended stays.
- Adjust minimum nights based on seasonality – potentially shorter during low season and longer during peak demand periods in Vattakanal.
Vattakanal Airbnb Cancellation Policy Trends Analysis (2026)
Flexible
15 listings
51.7% of total
Moderate
6 listings
20.7% of total
Firm
5 listings
17.2% of total
Strict
3 listings
10.3% of total
Cancellation Policy Insights for Vattakanal
- The prevailing Airbnb cancellation policy trend in Vattakanal is Flexible, used by 51.7% of listings.
- The market strongly favors guest-friendly terms, with 72.4% of listings offering Flexible or Moderate policies. This suggests guests in Vattakanal may expect booking flexibility.
Recommendations for Hosts
- Consider adopting a Flexible policy to align with the 51.7% market standard in Vattakanal.
- Given the high prevalence of Flexible policies (51.7%), offering this can enhance booking appeal, especially during shoulder seasons.
- Using a Strict policy might deter some guests, as only 10.3% of listings use it. Evaluate if potential revenue protection outweighs possible lower booking rates.
- Regularly review your cancellation policy against competitors and market demand shifts in Vattakanal.
Vattakanal STR Booking Lead Time Analysis (2026)
Average Booking Lead Time by Month
Booking Lead Time Insights for Vattakanal
- The overall average booking lead time for vacation rentals in Vattakanal is 12 days.
- Guests book furthest in advance for stays during November (average 38 days), likely coinciding with peak travel demand or local events.
- The shortest booking windows occur for stays in March (average 5 days), indicating more last-minute travel plans during this time.
- Seasonally, Winter (23 days avg.) sees the longest lead times, while Spring (8 days avg.) has the shortest, reflecting typical travel planning cycles.
Recommendations for Hosts
- Use the overall average lead time (12 days) as a baseline for your pricing and availability strategy in Vattakanal.
- For November stays, consider implementing length-of-stay discounts or slightly higher rates for bookings made less than 38 days out to capitalize on advance planning.
- Target marketing efforts for the Winter season well in advance (at least 23 days) to capture early planners.
- Monitor your own booking lead times against these Vattakanal averages to identify opportunities for dynamic pricing adjustments.
Popular & Essential Airbnb Amenities in Vattakanal (2026)
Amenity Prevalence
Amenity Insights for Vattakanal
- Popular amenities like Wifi, Pets allowed, Smoking allowed are common but not universal. Offering these can provide a competitive edge.
- Warning: Wifi is not universally provided but is considered essential globally. Ensure reliable Wifi is offered.
Recommendations for Hosts
- Consider adding popular differentiators like Wifi or Pets allowed to increase appeal.
- Highlight unique or less common amenities you offer (e.g., hot tub, dedicated workspace, EV charger) in your listing description and photos.
- Regularly check competitor amenities in Vattakanal to stay competitive.
Vattakanal Airbnb Guest Demographics & Profile Analysis (2026)
Guest Profile Summary for Vattakanal
- The typical guest profile for Airbnb in Vattakanal consists of primarily domestic travelers (86%), often arriving from nearby Bengaluru, typically belonging to the Post-2000s (Gen Z/Alpha) group (50%), primarily speaking English or Hindi.
- Domestic travelers account for 86.4% of guests.
- Key international markets include India (86.4%) and United States (4.5%).
- Top languages spoken are English (37.8%) followed by Hindi (22.2%).
- A significant demographic segment is the Post-2000s (Gen Z/Alpha) group, representing 50% of guests.
Recommendations for Hosts
- Target domestic marketing efforts towards travelers from Bengaluru and Chennai.
- Tailor amenities and listing descriptions to appeal to the dominant Post-2000s (Gen Z/Alpha) demographic (e.g., highlight fast WiFi, smart home features, local guides).
- Highlight unique local experiences or amenities relevant to the primary guest profile.
- Consider seasonal promotions aligned with peak travel times for key origin markets.
Nearby Short-Term Rental Market Comparison
How does the Vattakanal Airbnb market stack up against its neighbors? Compare key performance metrics like average monthly revenue, ADR, and occupancy rates in surrounding areas to understand the broader regional STR landscape.
| Market | Active Properties | Monthly Revenue | Daily Rate | Avg. Occupancy |
|---|---|---|---|---|
| Munambam | 10 | $1,444 | $118.22 | 35% |
| Muhamma | 10 | $935 | $233.98 | 20% |
| Pothamedu | 13 | $920 | $128.46 | 26% |
| Vilpatti | 42 | $721 | $102.89 | 28% |
| Adimali | 11 | $677 | $83.99 | 31% |
| Ambalappuzha | 11 | $674 | $112.64 | 25% |
| Achanakal hatty | 15 | $667 | $77.56 | 29% |
| Lovedale | 17 | $634 | $150.15 | 22% |
| Udhagamandalam | 203 | $621 | $100.87 | 23% |
| Vazhikadavu | 12 | $528 | $83.81 | 24% |