Vilpatti Airbnb Market Analysis 2026: Short Term Rental Data & Vacation Rental Statistics in Tamil Nadu, India
Is Airbnb profitable in Vilpatti in 2026? Explore comprehensive Airbnb analytics for Vilpatti, Tamil Nadu, India to uncover income potential. This 2026 STR market report for Vilpatti, based on AirROI data from February 2025 to January 2026, reveals key trends in the niche market of 42 active listings.
Whether you're considering an Airbnb investment in Vilpatti, optimizing your existing vacation rental, or exploring rental arbitrage opportunities, understanding the Vilpatti Airbnb data is crucial. Leveraging the low regulation environment is key to maximizing your short term rental income potential. Let's dive into the specifics.
Key Vilpatti Airbnb Performance Metrics Overview
Monthly Airbnb Revenue Variations & Income Potential in Vilpatti (2026)
Understanding the monthly revenue variations for Airbnb listings in Vilpatti is key to maximizing your short term rental income potential. Seasonality significantly impacts earnings. Our analysis, based on data from the past 12 months, shows that the peak revenue month for STRs in Vilpatti is typically May, while February often presents the lowest earnings, highlighting opportunities for strategic pricing adjustments during shoulder and low seasons. Explore the typical Airbnb income in Vilpatti across different performance tiers:
- Best-in-class properties (Top 10%) achieve $2,096+ monthly, often utilizing dynamic pricing and superior guest experiences.
- Strong performing properties (Top 25%) earn $1,265 or more, indicating effective management and desirable locations/amenities.
- Typical properties (Median) generate around $674 per month, representing the average market performance.
- Entry-level properties (Bottom 25%) see earnings around $346, often with potential for optimization.
Average Monthly Airbnb Earnings Trend in Vilpatti
Vilpatti Airbnb Occupancy Rate Trends (2026)
Maximize your bookings by understanding the Vilpatti STR occupancy trends. Seasonal demand shifts significantly influence how often properties are booked. Typically, Maysees the highest demand (peak season occupancy), while November experiences the lowest (low season). Effective strategies, like adjusting minimum stays or offering promotions, can boost occupancy during slower periods. Here's how different property tiers perform in Vilpatti:
- Best-in-class properties (Top 10%) achieve 63%+ occupancy, indicating high desirability and potentially optimized availability.
- Strong performing properties (Top 25%) maintain 43% or higher occupancy, suggesting good market fit and guest satisfaction.
- Typical properties (Median) have an occupancy rate around 27%.
- Entry-level properties (Bottom 25%) average 15% occupancy, potentially facing higher vacancy.
Average Monthly Occupancy Rate Trend in Vilpatti
Average Daily Rate (ADR) Airbnb Trends in Vilpatti (2026)
Effective short term rental pricing strategy in Vilpatti involves understanding monthly ADR fluctuations. The Average Daily Rate (ADR) for Airbnb in Vilpatti typically peaks in May and dips lowest during September. Leveraging Airbnb dynamic pricing tools or strategies based on this seasonality can significantly boost revenue. Here's a look at the typical nightly rates achieved:
- Best-in-class properties (Top 10%) command rates of $173+ per night, often due to premium features or locations.
- Strong performing properties (Top 25%) achieve nightly rates of $131 or more.
- Typical properties (Median) charge around $91 per night.
- Entry-level properties (Bottom 25%) earn around $58 per night.
Average Daily Rate (ADR) Trend by Month in Vilpatti
Get Live Vilpatti Market Intelligence 👇

Explore Real-time Analytics
Airbnb Seasonality Analysis & Trends in Vilpatti (2026)
Peak Season (May, July, April)
- Revenue averages $1,275 per month
- Occupancy rates average 43.8%
- Daily rates average $102
Shoulder Season
- Revenue averages $916 per month
- Occupancy maintains around 29.9%
- Daily rates hold near $100
Low Season (January, February, November)
- Revenue drops to average $629 per month
- Occupancy decreases to average 23.4%
- Daily rates adjust to average $100
Seasonality Insights for Vilpatti
- The Airbnb seasonality in Vilpatti shows highly seasonal trends requiring careful strategy. While the sections above show seasonal averages, it's also insightful to look at the extremes:
- During the high season, the absolute peak month showcases Vilpatti's highest earning potential, with monthly revenues capable of climbing to $1,565, occupancy reaching a high of 52.5%, and ADRs peaking at $105.
- Conversely, the slowest single month of the year, typically falling within the low season, marks the market's lowest point. In this month, revenue might dip to $579, occupancy could drop to 21.4%, and ADRs may adjust down to $96.
- Understanding both the seasonal averages and these monthly peaks and troughs in revenue, occupancy, and ADR is crucial for maximizing your Airbnb profit potential in Vilpatti.
Seasonal Strategies for Maximizing Profit
- Peak Season: Maximize revenue through premium pricing and potentially longer minimum stays. Ensure high availability.
- Low Season: Offer competitive pricing, special promotions (e.g., extended stay discounts), and flexible cancellation policies. Target off-season travelers like remote workers or budget-conscious guests.
- Shoulder Seasons: Implement dynamic pricing that balances peak and low rates. Target weekend travelers or specific events. Offer slightly more flexible terms than peak season.
- Regularly analyze your own performance against these Vilpatti seasonality benchmarks and adjust your pricing and availability strategy accordingly.
Best Areas for Airbnb Investment in Vilpatti (2026)
Exploring the top neighborhoods for short-term rentals in Vilpatti? This section highlights key areas, outlining why they are attractive for hosts and guests, along with notable local attractions. Consider these locations based on your target guest profile and investment strategy.
| Neighborhood / Area | Why Host Here? (Target Guests & Appeal) | Key Attractions & Landmarks |
|---|---|---|
| Kodai Lake | A popular tourist destination known for its scenic beauty and pleasant climate, attracting visitors year-round. Ideal for those looking to experience tranquility amidst nature with boating and walking paths. | Kodai Lake, Coaker's Walk, Green Valley View, Bryant Park, Pillar Rocks, Dolphin's Nose |
| Berijam Lake | Located a short drive from Kodaikanal, this secluded lake offers stunning views and serenity. Great for nature lovers and those seeking a peaceful retreat away from the crowds. | Berijam Lake, Flora and Fauna, Bamboo Forest, Pine Forest, Waterfalls |
| Silver Cascade Falls | A well-known waterfall near Kodaikanal that attracts many tourists. A prime spot for photography and enjoying the natural beauty, making it a great area for Airbnb hosting. | Silver Cascade Falls, Nearby viewpoints, Nature walks, Photography spots |
| Kodaikanal Road | Closer to the main towns and transport links, this area is strategically favorable for visitors who want easy access to both the city and the hill station. | Local markets, Transport facilities, Nearby restaurants, Shopping areas |
| Mount Zion | An alternative location offering beautiful views and hiking opportunities. Attracts both adventure seekers and those looking for scenic stays. | Hiking trails, Viewpoints, Local wildlife, Peaceful surroundings |
| Pillar Rocks | Famous for its majestic cliffs and unique rock formations, this area is a favorite among trekkers and nature photographers, perfect for unique Airbnb experiences. | Pillar Rocks, Trekking routes, Nature sights, Photographic spots |
| Coaker's Walk | A popular walking path along the edge of the hill providing breathtaking views of the plains and valleys. Ideal for Airbnb guests looking for scenic walks and moments. | Coaker's Walk, Viewpoints, Nearby eateries, Nature walks |
| Kodaikanal Fruit Market | A vibrant local market that's perfect for those who want an authentic experience of the region's culture and cuisine, attracting food lovers and travelers. | Local fruits, Cultural experience, Food stalls, Local crafts |
Understanding Airbnb License Requirements & STR Laws in Vilpatti (2026)
While Vilpatti, Tamil Nadu, India currently shows low STR regulations, specific Airbnb license requirements might still exist or change. Always verify the latest short term rental regulations and Airbnb license requirements directly with local government authorities for Vilpatti to ensure full compliance before hosting.
(Source: AirROI data, 2026, based on 2% licensed listings)
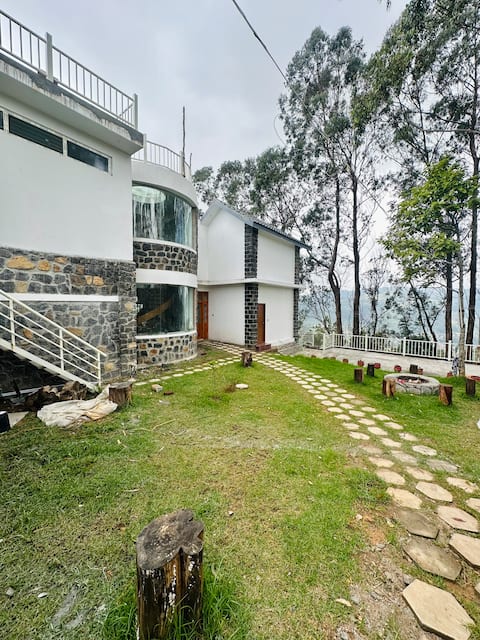
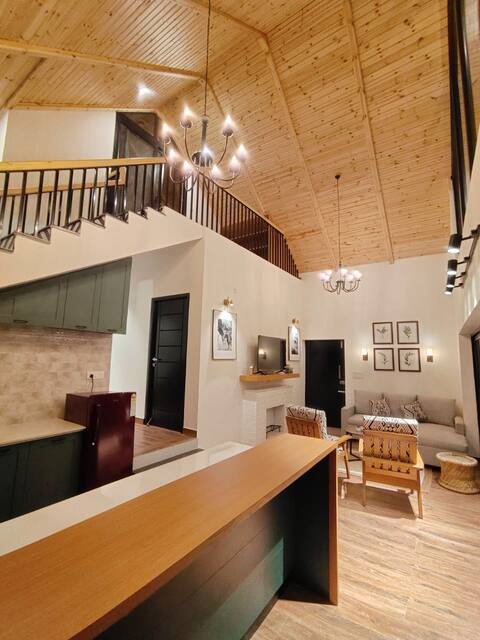
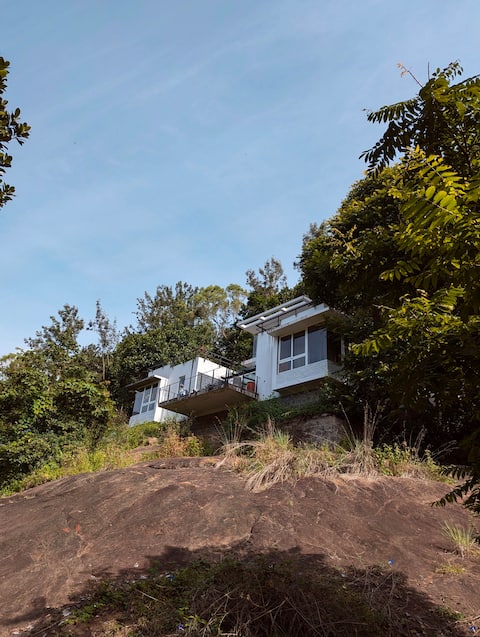
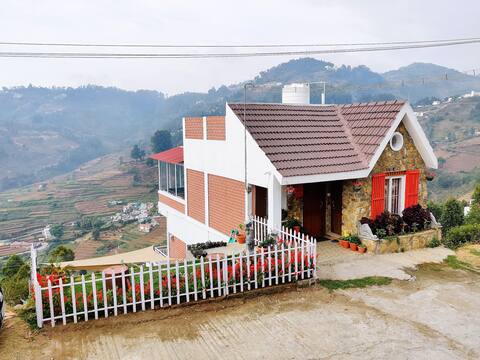
Top Performing Airbnb Properties in Vilpatti (2026)
Benchmark your potential! Explore examples of top-performing Airbnb properties in Vilpattibased on Trailing Twelve Month (TTM) revenue. Analyze their characteristics, revenue, occupancy rate, and ADR to understand what drives success in this market.
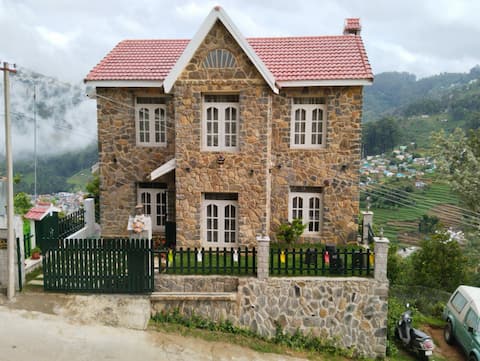
Cloud 11
Entire Place • 4 bedrooms
Alpine Abode Stay
Entire Place • 3 bedrooms
Arjuna's homestay!
Entire Place • 3 bedrooms
Sipa's HideOut. - A cozy and serene holiday home.
Entire Place • 2 bedrooms
Zhagaram cottage -House of Mist
Entire Place • 2 bedrooms
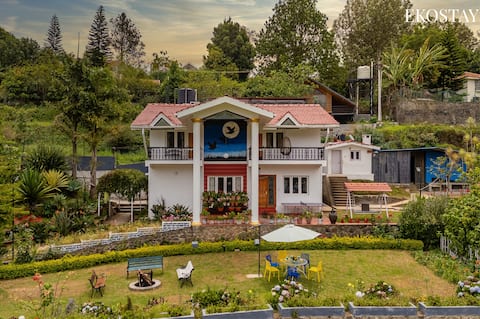
Moonlight Villa - Ekostay
Entire Place • 4 bedrooms
Note: Performance varies based on location, size, amenities, seasonality, and management quality. Data reflects the past 12 months.
Top Performing Airbnb Hosts in Vilpatti (2026)
Learn from the best! This table showcases top-performing Airbnb hosts in Vilpatti based on the number of properties managed and estimated total revenue over the past year. Analyze their scale and performance metrics.
| Host Name | Properties | Grossing Revenue | Stay Reviews | Avg Rating |
|---|---|---|---|---|
| Elavanchi | 6 | $46,053 | 109 | 4.82/5.0 |
| Zainab | 4 | $45,528 | 19 | 4.90/5.0 |
| Arjuna | 3 | $42,783 | 292 | 4.96/5.0 |
| Ashok Kumar | 5 | $30,115 | 175 | 4.46/5.0 |
| Pradeep | 1 | $28,014 | 68 | 4.97/5.0 |
| Sabarinathan | 1 | $22,637 | 92 | 4.85/5.0 |
| A.Prabu | 1 | $19,897 | 166 | 4.98/5.0 |
| Ali | 1 | $18,286 | 26 | 4.88/5.0 |
| Hariharan | 1 | $17,828 | 78 | 4.71/5.0 |
| Arshiya | 1 | $16,025 | 101 | 4.91/5.0 |
Analyzing the strategies of top hosts, such as their property selection, pricing, and guest communication, can offer valuable lessons for optimizing your own Airbnb operations in Vilpatti.
Dive Deeper: Advanced Vilpatti STR Market Data (2026)
Ready to unlock more insights? AirROI provides access to advanced metrics and comprehensive Airbnb data for Vilpatti. Explore detailed analytics beyond this report to refine your investment strategy, optimize pricing, and maximize your vacation rental profits.
Explore Advanced MetricsVilpatti Short-Term Rental Market Composition (2026): Property & Room Types
Room Type Distribution
Property Type Distribution
Market Composition Insights for Vilpatti
- The Vilpatti Airbnb market composition is heavily skewed towards Entire Home/Apt listings, which make up 76.2% of the 42 active rentals. This indicates strong guest preference for privacy and space.
- Looking at the property type distribution in Vilpatti, House properties are the most common (59.5%), reflecting the local real estate landscape.
- Houses represent a significant 59.5% portion, catering likely to families or larger groups.
- The presence of 31% Hotel/Boutique listings indicates integration with traditional hospitality.
- Smaller segments like apartment/condo (combined 2.4%) offer potential for unique stay experiences.
Vilpatti Airbnb Room Capacity Analysis (2026): Bedroom Distribution
Distribution of Listings by Number of Bedrooms
Room Capacity Insights for Vilpatti
- The dominant room capacity in Vilpatti is 2 bedrooms listings, making up 28.6% of the market. This suggests a strong demand for properties suitable for couples or solo travelers.
- Together, 2 bedrooms and 3 bedrooms properties represent 54.8% of the active Airbnb listings in Vilpatti, indicating a high concentration in these sizes.
- A significant 45.2% of listings offer 3+ bedrooms, catering to larger groups and families seeking more space in Vilpatti.
Vilpatti Vacation Rental Guest Capacity Trends (2026)
Distribution of Listings by Guest Capacity
Guest Capacity Insights for Vilpatti
- The most common guest capacity trend in Vilpatti vacation rentals is listings accommodating 8+ guests (42.9%). This suggests the primary traveler segment is likely larger groups.
- Properties designed for 8+ guests and 6 guests dominate the Vilpatti STR market, accounting for 64.3% of listings.
- 66.7% of properties accommodate 6+ guests, serving the market segment for larger families or group travel in Vilpatti.
- On average, properties in Vilpatti are equipped to host 5.7 guests.
Vilpatti Airbnb Booking Patterns (2026): Available vs. Booked Days
Available Days Distribution
Booked Days Distribution
Booking Pattern Insights for Vilpatti
- The most common availability pattern in Vilpatti falls within the 271-366 days range, representing 57.1% of listings. This suggests many properties have significant open periods on their calendars.
- Approximately 85.7% of listings show high availability (181+ days open annually), indicating potential for increased bookings or specific owner usage patterns.
- For booked days, the 31-90 days range is most frequent in Vilpatti (38.1%), reflecting common guest stay durations or potential owner blocking patterns.
- A notable 14.3% of properties secure long booking periods (181+ days booked per year), highlighting successful long-term rental strategies or significant owner usage.
Vilpatti Airbnb Minimum Stay Requirements Analysis
Distribution of Listings by Minimum Night Requirement
1 Night
39 listings
92.9% of total
2 Nights
1 listings
2.4% of total
30+ Nights
2 listings
4.8% of total
Key Insights
- The most prevalent minimum stay requirement in Vilpatti is 1 Night, adopted by 92.9% of listings. This highlights the market's preference for shorter, flexible bookings.
- A strong majority (95.3%) of the Vilpatti Airbnb data shows acceptance of very short stays (1-2 nights), indicating a dynamic, high-turnover market.
Recommendations
- Align with the market by considering a 1 Night minimum stay, as 92.9% of Vilpatti hosts use this setting.
- Adjust minimum nights based on seasonality – potentially shorter during low season and longer during peak demand periods in Vilpatti.
Vilpatti Airbnb Cancellation Policy Trends Analysis (2026)
Limited
1 listings
2.4% of total
Super Strict 30 Days
1 listings
2.4% of total
Flexible
19 listings
45.2% of total
Moderate
11 listings
26.2% of total
Firm
9 listings
21.4% of total
Strict
1 listings
2.4% of total
Cancellation Policy Insights for Vilpatti
- The prevailing Airbnb cancellation policy trend in Vilpatti is Flexible, used by 45.2% of listings.
- The market strongly favors guest-friendly terms, with 71.4% of listings offering Flexible or Moderate policies. This suggests guests in Vilpatti may expect booking flexibility.
- Strict cancellation policies are quite rare (2.4%), potentially making listings with this policy less competitive unless justified by high demand or property type.
Recommendations for Hosts
- Consider adopting a Flexible policy to align with the 45.2% market standard in Vilpatti.
- Using a Strict policy might deter some guests, as only 2.4% of listings use it. Evaluate if potential revenue protection outweighs possible lower booking rates.
- Regularly review your cancellation policy against competitors and market demand shifts in Vilpatti.
Vilpatti STR Booking Lead Time Analysis (2026)
Average Booking Lead Time by Month
Booking Lead Time Insights for Vilpatti
- The overall average booking lead time for vacation rentals in Vilpatti is 16 days.
- Guests book furthest in advance for stays during December (average 22 days), likely coinciding with peak travel demand or local events.
- The shortest booking windows occur for stays in March (average 11 days), indicating more last-minute travel plans during this time.
- Seasonally, Winter (21 days avg.) sees the longest lead times, while Spring (15 days avg.) has the shortest, reflecting typical travel planning cycles.
Recommendations for Hosts
- Use the overall average lead time (16 days) as a baseline for your pricing and availability strategy in Vilpatti.
- Target marketing efforts for the Winter season well in advance (at least 21 days) to capture early planners.
- Monitor your own booking lead times against these Vilpatti averages to identify opportunities for dynamic pricing adjustments.
Popular & Essential Airbnb Amenities in Vilpatti (2026)
Amenity Prevalence
Amenity Insights for Vilpatti
- Essential amenities in Vilpatti that guests expect include: Wifi, Free parking on premises. Lacking these (any) could significantly impact bookings.
- Popular amenities like TV, Hot water, First aid kit are common but not universal. Offering these can provide a competitive edge.
Recommendations for Hosts
- Ensure your listing includes all essential amenities for Vilpatti: Wifi, Free parking on premises.
- Prioritize adding missing essentials: Free parking on premises.
- Consider adding popular differentiators like TV or Hot water to increase appeal.
- Highlight unique or less common amenities you offer (e.g., hot tub, dedicated workspace, EV charger) in your listing description and photos.
- Regularly check competitor amenities in Vilpatti to stay competitive.
Vilpatti Airbnb Guest Demographics & Profile Analysis (2026)
Guest Profile Summary for Vilpatti
- The typical guest profile for Airbnb in Vilpatti consists of primarily domestic travelers (87%), often arriving from nearby Bengaluru, typically belonging to the Post-2000s (Gen Z/Alpha) group (50%), primarily speaking English or Hindi.
- Domestic travelers account for 86.5% of guests.
- Key international markets include India (86.5%) and United States (4.8%).
- Top languages spoken are English (42.1%) followed by Hindi (27.1%).
- A significant demographic segment is the Post-2000s (Gen Z/Alpha) group, representing 50% of guests.
Recommendations for Hosts
- Target domestic marketing efforts towards travelers from Bengaluru and Chennai.
- Tailor amenities and listing descriptions to appeal to the dominant Post-2000s (Gen Z/Alpha) demographic (e.g., highlight fast WiFi, smart home features, local guides).
- Highlight unique local experiences or amenities relevant to the primary guest profile.
- Consider seasonal promotions aligned with peak travel times for key origin markets.
Nearby Short-Term Rental Market Comparison
How does the Vilpatti Airbnb market stack up against its neighbors? Compare key performance metrics like average monthly revenue, ADR, and occupancy rates in surrounding areas to understand the broader regional STR landscape.
| Market | Active Properties | Monthly Revenue | Daily Rate | Avg. Occupancy |
|---|---|---|---|---|
| Munambam | 10 | $1,444 | $118.22 | 35% |
| Muhamma | 10 | $935 | $233.98 | 20% |
| Pothamedu | 13 | $920 | $128.46 | 26% |
| Adimali | 11 | $677 | $83.99 | 31% |
| Ambalappuzha | 11 | $674 | $112.64 | 25% |
| Achanakal hatty | 15 | $667 | $77.56 | 29% |
| Lovedale | 17 | $634 | $150.15 | 22% |
| Udhagamandalam | 203 | $621 | $100.87 | 23% |
| Vazhikadavu | 12 | $528 | $83.81 | 24% |
| Coonoor | 61 | $515 | $103.42 | 24% |