Deri Airbnb Market Analysis 2025: Short Term Rental Data & Vacation Rental Statistics in Uttar Pradesh, India
Is Airbnb profitable in Deri in 2025? Explore comprehensive Airbnb analytics for Deri, Uttar Pradesh, India to uncover income potential. This 2025 STR market report for Deri, based on AirROI data from May 2024 to April 2025, reveals key trends in the niche market of 35 active listings.
Whether you're considering an Airbnb investment in Deri, optimizing your existing vacation rental, or exploring rental arbitrage opportunities, understanding the Deri Airbnb data is crucial. Leveraging the low regulation environment is key to maximizing your short term rental income potential. Let's dive into the specifics.
Key Deri Airbnb Performance Metrics Overview
Monthly Airbnb Revenue Variations & Income Potential in Deri (2025)
Understanding the monthly revenue variations for Airbnb listings in Deri is key to maximizing your short term rental income potential. Seasonality significantly impacts earnings. Our analysis, based on data from the past 12 months, shows that the peak revenue month for STRs in Deri is typically May, while August often presents the lowest earnings, highlighting opportunities for strategic pricing adjustments during shoulder and low seasons. Explore the typical Airbnb income in Deri across different performance tiers:
- Best-in-class properties (Top 10%) achieve $2,912+ monthly, often utilizing dynamic pricing and superior guest experiences.
- Strong performing properties (Top 25%) earn $2,448 or more, indicating effective management and desirable locations/amenities.
- Typical properties (Median) generate around $1,714 per month, representing the average market performance.
- Entry-level properties (Bottom 25%) see earnings around $874, often with potential for optimization.
Average Monthly Airbnb Earnings Trend in Deri
Deri Airbnb Occupancy Rate Trends (2025)
Maximize your bookings by understanding the Deri STR occupancy trends. Seasonal demand shifts significantly influence how often properties are booked. Typically, Maysees the highest demand (peak season occupancy), while August experiences the lowest (low season). Effective strategies, like adjusting minimum stays or offering promotions, can boost occupancy during slower periods. Here's how different property tiers perform in Deri:
- Best-in-class properties (Top 10%) achieve 37%+ occupancy, indicating high desirability and potentially optimized availability.
- Strong performing properties (Top 25%) maintain 36% or higher occupancy, suggesting good market fit and guest satisfaction.
- Typical properties (Median) have an occupancy rate around 24%.
- Entry-level properties (Bottom 25%) average 17% occupancy, potentially facing higher vacancy.
Average Monthly Occupancy Rate Trend in Deri
Average Daily Rate (ADR) Airbnb Trends in Deri (2025)
Effective short term rental pricing strategy in Deri involves understanding monthly ADR fluctuations. The Average Daily Rate (ADR) for Airbnb in Deri typically peaks in November and dips lowest during September. Leveraging Airbnb dynamic pricing tools or strategies based on this seasonality can significantly boost revenue. Here's a look at the typical nightly rates achieved:
- Best-in-class properties (Top 10%) command rates of $274+ per night, often due to premium features or locations.
- Strong performing properties (Top 25%) achieve nightly rates of $211 or more.
- Typical properties (Median) charge around $149 per night.
- Entry-level properties (Bottom 25%) earn around $72 per night.
Average Daily Rate (ADR) Trend by Month in Deri
Get Live Deri Market Intelligence 👇

Explore Real-time Analytics
Airbnb Seasonality Analysis & Trends in Deri (2025)
Peak Season (May, June, March)
- Revenue averages $4,400 per month
- Occupancy rates average 34.0%
- Daily rates average $158
Shoulder Season
- Revenue averages $1,120 per month
- Occupancy maintains around 24.9%
- Daily rates hold near $152
Low Season (January, April, August)
- Revenue drops to average $542 per month
- Occupancy decreases to average 11.9%
- Daily rates adjust to average $151
Seasonality Insights for Deri
- The Airbnb seasonality in Deri shows highly seasonal trends requiring careful strategy. While the sections above show seasonal averages, it's also insightful to look at the extremes:
- During the high season, the absolute peak month showcases Deri's highest earning potential, with monthly revenues capable of climbing to $6,369, occupancy reaching a high of 67.7%, and ADRs peaking at $184.
- Conversely, the slowest single month of the year, typically falling within the low season, marks the market's lowest point. In this month, revenue might dip to $373, occupancy could drop to 0.0%, and ADRs may adjust down to $135.
- Understanding both the seasonal averages and these monthly peaks and troughs in revenue, occupancy, and ADR is crucial for maximizing your Airbnb profit potential in Deri.
Seasonal Strategies for Maximizing Profit
- Peak Season: Maximize revenue through premium pricing and potentially longer minimum stays. Ensure high availability.
- Low Season: Offer competitive pricing, special promotions (e.g., extended stay discounts), and flexible cancellation policies. Target off-season travelers like remote workers or budget-conscious guests.
- Shoulder Seasons: Implement dynamic pricing that balances peak and low rates. Target weekend travelers or specific events. Offer slightly more flexible terms than peak season.
- Regularly analyze your own performance against these Deri seasonality benchmarks and adjust your pricing and availability strategy accordingly.
Best Areas for Airbnb Investment in Deri (2025)
Exploring the top neighborhoods for short-term rentals in Deri? This section highlights key areas, outlining why they are attractive for hosts and guests, along with notable local attractions. Consider these locations based on your target guest profile and investment strategy.
| Neighborhood / Area | Why Host Here? (Target Guests & Appeal) | Key Attractions & Landmarks |
|---|---|---|
| Deri Market | The bustling heart of Deri, known for its vibrant local markets and shops. Ideal for tourists looking to experience the local culture and buy handmade goods. | Local handicraft shops, Street food stalls, Cultural events, Public parks |
| Deri Lake | A serene spot for relaxation and nature lovers, offering scenic views and outdoor activities. Attracts families and tourists seeking tranquility away from the city hustle. | Boating, Picnic areas, Birdwatching, Nature trails |
| Deri Temple Area | A culturally rich area with historical temples that draw visitors for spiritual retreats and architectural beauty. Popular among tourists interested in local traditions. | Historic temples, Cultural festivals, Art exhibitions |
| Deri Rural Communities | Charming rural surroundings that showcase traditional lifestyles. Perfect for visitors wanting to experience the authentic rural India, complete with farm stays and nature tours. | Farm tours, Village festivals, Traditional cooking classes |
| Deri Educational Institutions | Home to several educational institutions, attracting students and visiting families. A good area for short-term rentals catering to families visiting students. | Colleges and universities, Cultural programs, Libraries |
| Deri Festivals Venue | Key location for local festivals and events, drawing tourists during festival seasons. A great investment for hosting guests during vibrant celebrations. | Festival celebrations, Local crafts fairs, Food festivals |
| Deri Riverside | Picturesque riverside area perfect for leisure activities. A great location for guests who enjoy outdoor adventures and water sports. | Riverboat rides, Fishing, Riverside dining |
| Deri Nightlife District | The go-to place for nightlife in the region, with cafes, restaurants, and entertainment options. A hotspot for young travelers looking for a vibrant night scene. | Live music venues, Nightclubs, Late-night eateries |
Understanding Airbnb License Requirements & STR Laws in Deri (2025)
While Deri, Uttar Pradesh, India currently shows low STR regulations, specific Airbnb license requirements might still exist or change. Always verify the latest short term rental regulations and Airbnb license requirements directly with local government authorities for Deri to ensure full compliance before hosting.
(Source: AirROI data, 2025, finding no licensed listings among those analyzed)
Top Performing Airbnb Properties in Deri (2025)
Benchmark your potential! Explore examples of top-performing Airbnb properties in Deribased on Trailing Twelve Month (TTM) revenue. Analyze their characteristics, revenue, occupancy rate, and ADR to understand what drives success in this market.
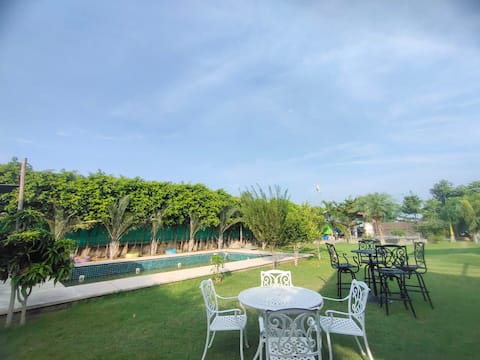
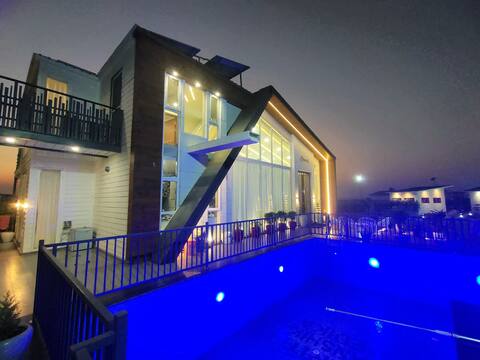
luxurious Villa with pool-6 Beds
Entire Place • 3 bedrooms
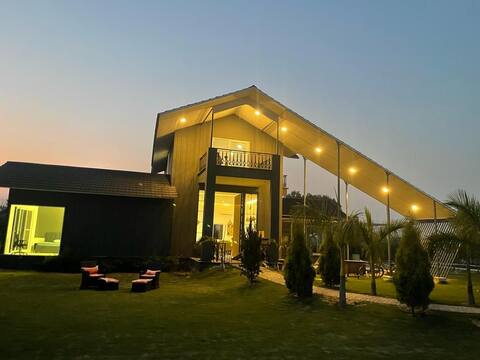
Villa with Swimming pool 6-Beds
Entire Place • 3 bedrooms
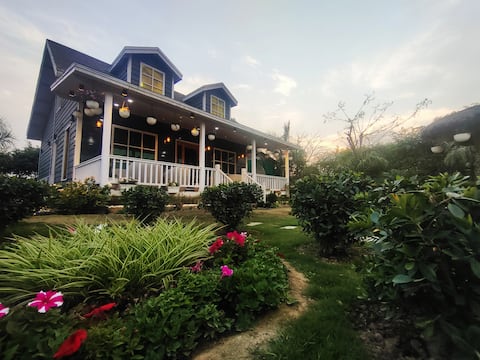
3bhk Pet Friendly Farm With Pool
Entire Place • 3 bedrooms
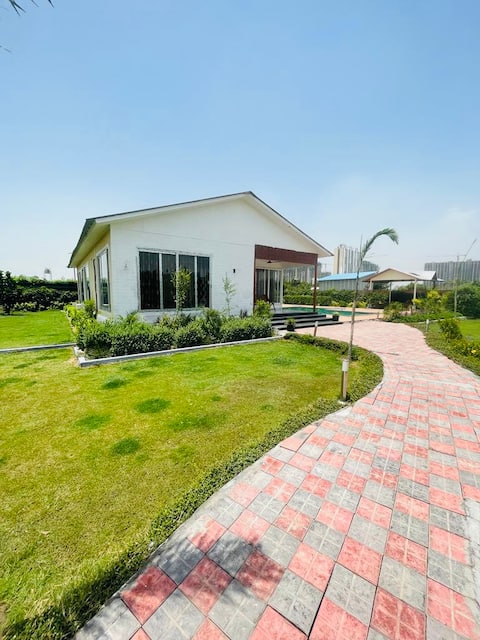
Bhagman Farm - Pet Friendly, Pool & Organic Farm
Entire Place • 3 bedrooms
6 Bhk Farm For Big Party!
Entire Place • 6 bedrooms
Modern Farm House For Party
Entire Place • 4 bedrooms
Note: Performance varies based on location, size, amenities, seasonality, and management quality. Data reflects the past 12 months.
Top Performing Airbnb Hosts in Deri (2025)
Learn from the best! This table showcases top-performing Airbnb hosts in Deri based on the number of properties managed and estimated total revenue over the past year. Analyze their scale and performance metrics.
| Host Name | Properties | Grossing Revenue | Stay Reviews | Avg Rating |
|---|---|---|---|---|
| Host #445774283 | 27 | $354,774 | 1 | 0.00/5.0 |
| Host #498647614 | 1 | $23,285 | 0 | 0.00/5.0 |
| Host #567917835 | 1 | $15,190 | 0 | 0.00/5.0 |
| Host #136243467 | 1 | $14,433 | 0 | 0.00/5.0 |
| Host #448717303 | 1 | $12,032 | 0 | 0.00/5.0 |
| Host #536753107 | 1 | $11,919 | 0 | 0.00/5.0 |
| Host #433413740 | 1 | $11,908 | 0 | 0.00/5.0 |
| Host #428268768 | 1 | $11,761 | 0 | 0.00/5.0 |
| Host #143882823 | 1 | $516 | 3 | 5.00/5.0 |
Analyzing the strategies of top hosts, such as their property selection, pricing, and guest communication, can offer valuable lessons for optimizing your own Airbnb operations in Deri.
Dive Deeper: Advanced Deri STR Market Data (2025)
Ready to unlock more insights? AirROI provides access to advanced metrics and comprehensive Airbnb data for Deri. Explore detailed analytics beyond this report to refine your investment strategy, optimize pricing, and maximize your vacation rental profits.
Explore Advanced MetricsDeri Short-Term Rental Market Composition (2025): Property & Room Types
Room Type Distribution
Property Type Distribution
Market Composition Insights for Deri
- The Deri Airbnb market composition is heavily skewed towards Entire Home/Apt listings, which make up 60% of the 35 active rentals. This indicates strong guest preference for privacy and space.
- However, a notable 40% share for Private Rooms suggests opportunities for budget-conscious travelers or hosts renting out spare rooms.
- Looking at the property type distribution in Deri, Outdoor/Unique properties are the most common (80%), reflecting the local real estate landscape.
- Houses represent a significant 17.1% portion, catering likely to families or larger groups.
- Smaller segments like apartment/condo (combined 2.9%) offer potential for unique stay experiences.
Deri Airbnb Room Capacity Analysis (2025): Bedroom Distribution
Distribution of Listings by Number of Bedrooms
Room Capacity Insights for Deri
- The dominant room capacity in Deri is 2 bedrooms listings, making up 40% of the market. This suggests a strong demand for properties suitable for couples or solo travelers.
- Together, 2 bedrooms and 3 bedrooms properties represent 77.1% of the active Airbnb listings in Deri, indicating a high concentration in these sizes.
- A significant 51.4% of listings offer 3+ bedrooms, catering to larger groups and families seeking more space in Deri.
Deri Vacation Rental Guest Capacity Trends (2025)
Distribution of Listings by Guest Capacity
Guest Capacity Insights for Deri
- The most common guest capacity trend in Deri vacation rentals is listings accommodating 8+ guests (88.6%). This suggests the primary traveler segment is likely larger groups.
- Properties designed for 8+ guests and 2 guests dominate the Deri STR market, accounting for 94.3% of listings.
- 91.5% of properties accommodate 6+ guests, serving the market segment for larger families or group travel in Deri.
- On average, properties in Deri are equipped to host 7.5 guests.
Deri Airbnb Booking Patterns (2025): Available vs. Booked Days
Available Days Distribution
Booked Days Distribution
Booking Pattern Insights for Deri
- The most common availability pattern in Deri falls within the 271-366 days range, representing 97.1% of listings. This suggests many properties have significant open periods on their calendars.
- Approximately 100.0% of listings show high availability (181+ days open annually), indicating potential for increased bookings or specific owner usage patterns.
- For booked days, the 31-90 days range is most frequent in Deri (91.4%), reflecting common guest stay durations or potential owner blocking patterns.
Deri Airbnb Minimum Stay Requirements Analysis
Distribution of Listings by Minimum Night Requirement
1 Night
34 listings
100% of total
Key Insights
- The most prevalent minimum stay requirement in Deri is 1 Night, adopted by 100% of listings. This highlights the market's preference for shorter, flexible bookings.
- A strong majority (100.0%) of the Deri Airbnb data shows acceptance of very short stays (1-2 nights), indicating a dynamic, high-turnover market.
Recommendations
- Align with the market by considering a 1 Night minimum stay, as 100% of Deri hosts use this setting.
- Adjust minimum nights based on seasonality – potentially shorter during low season and longer during peak demand periods in Deri.
Deri Airbnb Cancellation Policy Trends (2025)
Cancellation policy data is currently unavailable for Deri.
Deri STR Booking Lead Time Analysis (2025)
Average Booking Lead Time by Month
Booking Lead Time Insights for Deri
- The overall average booking lead time for vacation rentals in Deri is 7 days.
- Guests book furthest in advance for stays during November (average 77 days), likely coinciding with peak travel demand or local events.
- The shortest booking windows occur for stays in June (average 0 days), indicating more last-minute travel plans during this time.
- Seasonally, Fall (31 days avg.) sees the longest lead times, while Summer (3 days avg.) has the shortest, reflecting typical travel planning cycles.
Recommendations for Hosts
- Use the overall average lead time (7 days) as a baseline for your pricing and availability strategy in Deri.
- For November stays, consider implementing length-of-stay discounts or slightly higher rates for bookings made less than 77 days out to capitalize on advance planning.
- Target marketing efforts for the Fall season well in advance (at least 31 days) to capture early planners.
- Monitor your own booking lead times against these Deri averages to identify opportunities for dynamic pricing adjustments.
Popular & Essential Airbnb Amenities in Deri (2025)
Amenity Prevalence
No amenities with partial availability (less than 100%) were found to display in the chart. All essential amenities might be present in all listings. Check insights below.
Amenity Insights for Deri
- Essential amenities in Deri that guests expect include: Free parking on premises, Dryer, Pool, Air conditioning, Carbon monoxide alarm, Dedicated workspace, Wifi, Heating, TV, Hot water. Lacking these (any) could significantly impact bookings.
Recommendations for Hosts
- Ensure your listing includes all essential amenities for Deri: Free parking on premises, Dryer, Pool, Air conditioning, Carbon monoxide alarm, Dedicated workspace, Wifi, Heating, TV, Hot water.
- Highlight unique or less common amenities you offer (e.g., hot tub, dedicated workspace, EV charger) in your listing description and photos.
- Regularly check competitor amenities in Deri to stay competitive.
Deri Airbnb Guest Demographics & Profile (2025)
Traveler profile data is currently unavailable for Deri.
Nearby Short-Term Rental Market Comparison
How does the Deri Airbnb market stack up against its neighbors? Compare key performance metrics like average monthly revenue, ADR, and occupancy rates in surrounding areas to understand the broader regional STR landscape.
| Market | Active Properties | Monthly Revenue | Daily Rate | Avg. Occupancy |
|---|---|---|---|---|
| Bissar Akbarpur | 11 | $2,609 | $331.45 | 24% |
| Manger | 19 | $1,621 | $252.44 | 20% |
| Dera | 39 | $1,543 | $270.15 | 15% |
| Noida | 55 | $1,174 | $199.11 | 16% |
| Bajidpur | 93 | $958 | $171.87 | 18% |
| libiza town | 15 | $821 | $147.26 | 21% |
| Nagli Sakpur | 19 | $753 | $125.69 | 21% |
| Gurugram | 947 | $697 | $92.61 | 26% |
| Greater Noida | 154 | $637 | $99.88 | 23% |
| Kondli | 11 | $617 | $93.28 | 23% |