Naini Airbnb Market Analysis 2026: Short Term Rental Data & Vacation Rental Statistics in Uttar Pradesh, India
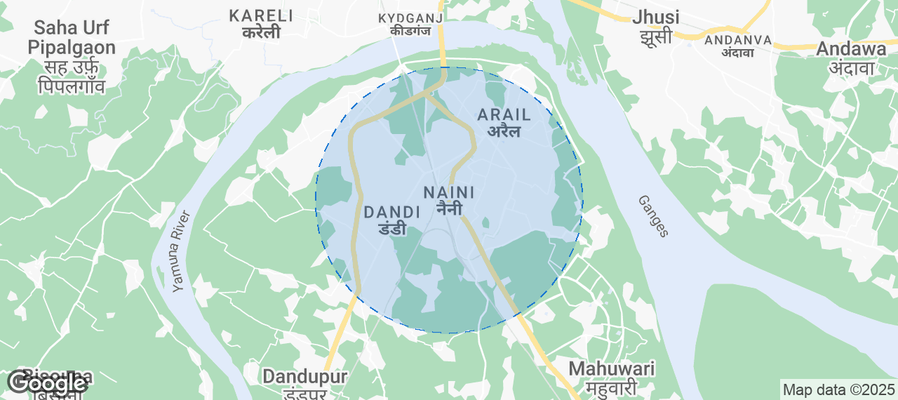
Is Airbnb profitable in Naini in 2026? Explore comprehensive Airbnb analytics for Naini, Uttar Pradesh, India to uncover income potential. This 2026 STR market report for Naini, based on AirROI data from December 2024 to November 2025, reveals key trends in the niche market of 19 active listings.
Whether you're considering an Airbnb investment in Naini, optimizing your existing vacation rental, or exploring rental arbitrage opportunities, understanding the Naini Airbnb data is crucial. Understanding the local regulations is key to maximizing your short term rental income potential. Let's dive into the specifics.
Key Naini Airbnb Performance Metrics Overview
Monthly Airbnb Revenue Variations & Income Potential in Naini (2026)
Understanding the monthly revenue variations for Airbnb listings in Naini is key to maximizing your short term rental income potential. Seasonality significantly impacts earnings. Our analysis, based on data from the past 12 months, shows that the peak revenue month for STRs in Naini is typically February, while December often presents the lowest earnings, highlighting opportunities for strategic pricing adjustments during shoulder and low seasons. Explore the typical Airbnb income in Naini across different performance tiers:
- Best-in-class properties (Top 10%) achieve $746+ monthly, often utilizing dynamic pricing and superior guest experiences.
- Strong performing properties (Top 25%) earn $501 or more, indicating effective management and desirable locations/amenities.
- Typical properties (Median) generate around $289 per month, representing the average market performance.
- Entry-level properties (Bottom 25%) see earnings around $226, often with potential for optimization.
Average Monthly Airbnb Earnings Trend in Naini
Naini Airbnb Occupancy Rate Trends (2026)
Maximize your bookings by understanding the Naini STR occupancy trends. Seasonal demand shifts significantly influence how often properties are booked. Typically, Februarysees the highest demand (peak season occupancy), while December experiences the lowest (low season). Effective strategies, like adjusting minimum stays or offering promotions, can boost occupancy during slower periods. Here's how different property tiers perform in Naini:
- Best-in-class properties (Top 10%) achieve 27%+ occupancy, indicating high desirability and potentially optimized availability.
- Strong performing properties (Top 25%) maintain 25% or higher occupancy, suggesting good market fit and guest satisfaction.
- Typical properties (Median) have an occupancy rate around 19%.
- Entry-level properties (Bottom 25%) average 13% occupancy, potentially facing higher vacancy.
Average Monthly Occupancy Rate Trend in Naini
Average Daily Rate (ADR) Airbnb Trends in Naini (2026)
Effective short term rental pricing strategy in Naini involves understanding monthly ADR fluctuations. The Average Daily Rate (ADR) for Airbnb in Naini typically peaks in February and dips lowest during November. Leveraging Airbnb dynamic pricing tools or strategies based on this seasonality can significantly boost revenue. Here's a look at the typical nightly rates achieved:
- Best-in-class properties (Top 10%) command rates of $154+ per night, often due to premium features or locations.
- Strong performing properties (Top 25%) achieve nightly rates of $67 or more.
- Typical properties (Median) charge around $42 per night.
- Entry-level properties (Bottom 25%) earn around $25 per night.
Average Daily Rate (ADR) Trend by Month in Naini
Get Live Naini Market Intelligence 👇
Explore Real-time Analytics
Airbnb Seasonality Analysis & Trends in Naini (2025)
Peak Season (February, May, November)
- Revenue averages $638 per month
- Occupancy rates average 27.6%
- Daily rates average $60
Shoulder Season
- Revenue averages $87 per month
- Occupancy maintains around 5.0%
- Daily rates hold near $60
Low Season (August, September, October)
- Revenue drops to average $0 per month
- Occupancy decreases to average 0.0%
- Daily rates adjust to average $54
Seasonality Insights for Naini
- The Airbnb seasonality in Naini shows highly seasonal trends requiring careful strategy. While the sections above show seasonal averages, it's also insightful to look at the extremes:
- During the high season, the absolute peak month showcases Naini's highest earning potential, with monthly revenues capable of climbing to $1,131, occupancy reaching a high of 59.7%, and ADRs peaking at $67.
- Conversely, the slowest single month of the year, typically falling within the low season, marks the market's lowest point. In this month, revenue might dip to $0, occupancy could drop to 0.0%, and ADRs may adjust down to $53.
- Understanding both the seasonal averages and these monthly peaks and troughs in revenue, occupancy, and ADR is crucial for maximizing your Airbnb profit potential in Naini.
Seasonal Strategies for Maximizing Profit
- Peak Season: Maximize revenue through premium pricing and potentially longer minimum stays. Ensure high availability.
- Low Season: Offer competitive pricing, special promotions (e.g., extended stay discounts), and flexible cancellation policies. Target off-season travelers like remote workers or budget-conscious guests.
- Shoulder Seasons: Implement dynamic pricing that balances peak and low rates. Target weekend travelers or specific events. Offer slightly more flexible terms than peak season.
- Regularly analyze your own performance against these Naini seasonality benchmarks and adjust your pricing and availability strategy accordingly.
Best Areas for Airbnb Investment in Naini (2026)
Exploring the top neighborhoods for short-term rentals in Naini? This section highlights key areas, outlining why they are attractive for hosts and guests, along with notable local attractions. Consider these locations based on your target guest profile and investment strategy.
| Neighborhood / Area | Why Host Here? (Target Guests & Appeal) | Key Attractions & Landmarks |
|---|---|---|
| Naini Lakeside | A tranquil area by the beautiful lakes, Naini Lakeside attracts tourists looking for serene experiences in nature along with adventure activities around the lakes. | Naini Lake, Naina Devi Temple, Boating, Lansdowne, Snow View Point, Tiffin Top |
| Mallital | Located near the famous Mall Road, Mallital is bustling with shops, eateries, and access to various tourist attractions, making it ideal for visitors. | Mall Road, Bhotia Market, Bhimtal, Naini Peak, Tibetan Market, Cafe Chandra |
| Naina Devi Temple | This area draws many spiritual tourists coming to visit the revered Naina Devi Temple, providing ample opportunity for hosting guests seeking religious tourism. | Naina Devi Temple, Naini Lake, Cultural Festivals, Bhajan Mandali Events, Local Handicraft Stalls |
| Kumaon | Known for its picturesque landscapes and wildlife, Kumaon attracts nature lovers and adventure seekers, ideal for eco-tourism. | Jim Corbett National Park, Mukteshwar, Naukuchiatal, Bhimtal, Almora, Pangot |
| Nainital Town Centre | The heart of Nainital filled with bustling markets, shops, and a vibrant atmosphere, perfect for tourists looking for convenience and entertainment. | Naini Lake, Mall Road, Local Handicrafts, Cafes and Restaurants, Museums, Adventure Park |
| Tiffin Top | A scenic viewpoint that attracts trekkers and nature enthusiasts, Tiffin Top offers breathtaking views and is popular among visitors seeking outdoor experiences. | Tiffin Top Trek, Khurpatal, Land's End, Nature Walks, Photography Spots, Local Flora |
| Kilbury Road | A quieter area providing beautiful nature trails and panoramic views of the mountains, making it attractive for guests seeking a peaceful getaway. | Kilbury Bird Sanctuary, Hiking Trails, Viewpoints, Nature Retreats, Picnic Spots |
| Bhimtal | A nearby lake destination that offers a mix of adventure and relaxation, appealing to those looking for a weekend getaway from Nainital. | Bhimtal Lake, Island in Bhimtal, Boat Rides, Adventure Activities, Local Market, Temples |
Understanding Airbnb License Requirements & STR Laws in Naini (2026)
With 11% of listings showing registration in 2026, understanding potential Airbnb license requirements is crucial in Naini. Always verify the latest short term rental regulations and Airbnb license requirements directly with local government authorities for Naini to ensure full compliance before hosting.
(Source: AirROI data, 2026, based on 11% licensed listings)
Top Performing Airbnb Properties in Naini (2026)
Benchmark your potential! Explore examples of top-performing Airbnb properties in Nainibased on Trailing Twelve Month (TTM) revenue. Analyze their characteristics, revenue, occupancy rate, and ADR to understand what drives success in this market.
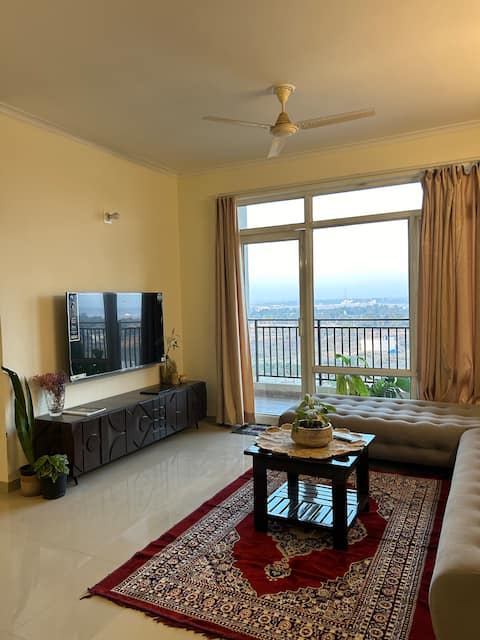
Stay by the Ghats!
Entire Place • 3 bedrooms
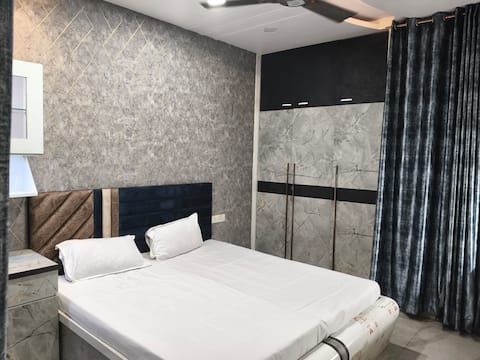
kraj inn villa
Entire Place • 3 bedrooms

Vastu Homes - Inner Peace.
Entire Place • 2 bedrooms
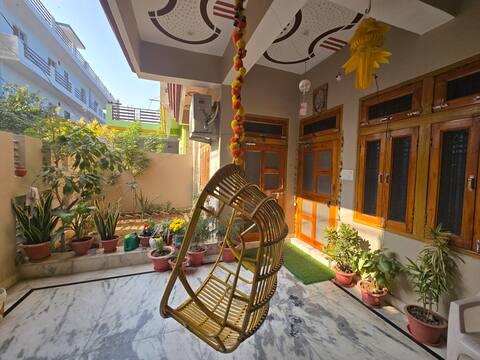
Kumbh stays - newly built 2BHK, 4kms from Sangam
Entire Place • 2 bedrooms
Triveni Niwas ( Second floor with 2 rooms )
Private Room • 2 bedrooms
Independent House In Naini Arail Prayagraj
Private Room • 2 bedrooms
Note: Performance varies based on location, size, amenities, seasonality, and management quality. Data reflects the past 12 months.
Top Performing Airbnb Hosts in Naini (2026)
Learn from the best! This table showcases top-performing Airbnb hosts in Naini based on the number of properties managed and estimated total revenue over the past year. Analyze their scale and performance metrics.
| Host Name | Properties | Grossing Revenue | Stay Reviews | Avg Rating |
|---|---|---|---|---|
| Rishika | 1 | $8,007 | 8 | 5.00/5.0 |
| Durgesh | 7 | $6,963 | 38 | 4.97/5.0 |
| Utsav | 2 | $4,016 | 6 | 4.33/5.0 |
| Vijay Kumar Kesarwani | 1 | $3,173 | 2 | Not Rated |
| Sumit | 1 | $2,184 | 1 | Not Rated |
| Ankit | 3 | $1,908 | 0 | Not Rated |
| Rahul Kumar | 1 | $1,610 | 11 | 4.00/5.0 |
| Sahil | 2 | $969 | 3 | Not Rated |
| Akash | 1 | $494 | 16 | 4.75/5.0 |
Analyzing the strategies of top hosts, such as their property selection, pricing, and guest communication, can offer valuable lessons for optimizing your own Airbnb operations in Naini.
Dive Deeper: Advanced Naini STR Market Data (2026)
Ready to unlock more insights? AirROI provides access to advanced metrics and comprehensive Airbnb data for Naini. Explore detailed analytics beyond this report to refine your investment strategy, optimize pricing, and maximize your vacation rental profits.
Explore Advanced MetricsNaini Short-Term Rental Market Composition (2026): Property & Room Types
Room Type Distribution
Property Type Distribution
Market Composition Insights for Naini
- The Naini Airbnb market composition is heavily skewed towards Private Room listings, which make up 63.2% of the 19 active rentals. This indicates strong guest preference for privacy and space.
- Looking at the property type distribution in Naini, House properties are the most common (78.9%), reflecting the local real estate landscape.
- Houses represent a significant 78.9% portion, catering likely to families or larger groups.
Naini Airbnb Room Capacity Analysis (2026): Bedroom Distribution
Distribution of Listings by Number of Bedrooms
Room Capacity Insights for Naini
- The dominant room capacity in Naini is 2 bedrooms listings, making up 26.3% of the market. This suggests a strong demand for properties suitable for couples or solo travelers.
- Together, 2 bedrooms and 1 bedroom properties represent 42.1% of the active Airbnb listings in Naini, indicating a high concentration in these sizes.
Naini Vacation Rental Guest Capacity Trends (2026)
Distribution of Listings by Guest Capacity
Guest Capacity Insights for Naini
- The most common guest capacity trend in Naini vacation rentals is listings accommodating 6 guests (21.1%). This suggests the primary traveler segment is likely larger groups.
- Properties designed for 6 guests and 3 guests dominate the Naini STR market, accounting for 26.4% of listings.
- 26.4% of properties accommodate 6+ guests, serving the market segment for larger families or group travel in Naini.
- On average, properties in Naini are equipped to host 2.2 guests.
Naini Airbnb Booking Patterns (2026): Available vs. Booked Days
Available Days Distribution
Booked Days Distribution
Booking Pattern Insights for Naini
- The most common availability pattern in Naini falls within the 271-366 days range, representing 100% of listings. This suggests many properties have significant open periods on their calendars.
- Approximately 100.0% of listings show high availability (181+ days open annually), indicating potential for increased bookings or specific owner usage patterns.
- For booked days, the 1-30 days range is most frequent in Naini (57.9%), reflecting common guest stay durations or potential owner blocking patterns.
Naini Airbnb Minimum Stay Requirements Analysis
Distribution of Listings by Minimum Night Requirement
1 Night
19 listings
100% of total
Key Insights
- The most prevalent minimum stay requirement in Naini is 1 Night, adopted by 100% of listings. This highlights the market's preference for shorter, flexible bookings.
- A strong majority (100.0%) of the Naini Airbnb data shows acceptance of very short stays (1-2 nights), indicating a dynamic, high-turnover market.
Recommendations
- Align with the market by considering a 1 Night minimum stay, as 100% of Naini hosts use this setting.
- Adjust minimum nights based on seasonality – potentially shorter during low season and longer during peak demand periods in Naini.
Naini Airbnb Cancellation Policy Trends Analysis (2026)
Flexible
5 listings
26.3% of total
Moderate
4 listings
21.1% of total
Firm
9 listings
47.4% of total
Strict
1 listings
5.3% of total
Cancellation Policy Insights for Naini
- The prevailing Airbnb cancellation policy trend in Naini is Firm, used by 47.4% of listings.
- A majority (52.7%) of hosts in Naini utilize Firm or Strict policies, indicating a market where hosts prioritize booking security.
- Strict cancellation policies are quite rare (5.3%), potentially making listings with this policy less competitive unless justified by high demand or property type.
Recommendations for Hosts
- Consider adopting a Firm policy to align with the 47.4% market standard in Naini.
- Using a Strict policy might deter some guests, as only 5.3% of listings use it. Evaluate if potential revenue protection outweighs possible lower booking rates.
- Regularly review your cancellation policy against competitors and market demand shifts in Naini.
Naini STR Booking Lead Time Analysis (2026)
Average Booking Lead Time by Month
Booking Lead Time Insights for Naini
- The overall average booking lead time for vacation rentals in Naini is 16 days.
- Guests book furthest in advance for stays during February (average 19 days), likely coinciding with peak travel demand or local events.
- The shortest booking windows occur for stays in October (average 0 days), indicating more last-minute travel plans during this time.
- Seasonally, Winter (12 days avg.) sees the longest lead times, while Summer (0 days avg.) has the shortest, reflecting typical travel planning cycles.
Recommendations for Hosts
- Use the overall average lead time (16 days) as a baseline for your pricing and availability strategy in Naini.
- During October, focus on last-minute booking availability and promotions, as guests book with very short notice (0 days avg.).
- Target marketing efforts for the Winter season well in advance (at least 12 days) to capture early planners.
- Monitor your own booking lead times against these Naini averages to identify opportunities for dynamic pricing adjustments.
Popular & Essential Airbnb Amenities in Naini (2026)
Amenity Prevalence
Amenity Insights for Naini
- Popular amenities like Free parking on premises, Wifi, Dedicated workspace are common but not universal. Offering these can provide a competitive edge.
- Warning: Wifi is not universally provided but is considered essential globally. Ensure reliable Wifi is offered.
Recommendations for Hosts
- Consider adding popular differentiators like Free parking on premises or Wifi to increase appeal.
- Highlight unique or less common amenities you offer (e.g., hot tub, dedicated workspace, EV charger) in your listing description and photos.
- Regularly check competitor amenities in Naini to stay competitive.
Naini Airbnb Guest Demographics & Profile Analysis (2026)
Guest Profile Summary for Naini
- The typical guest profile for Airbnb in Naini consists of a mix of domestic (44%) and international guests, with top international origins including United States, typically belonging to the Post-2000s (Gen Z/Alpha) group (50%), primarily speaking English or Hindi.
- Domestic travelers account for 44.4% of guests.
- Key international markets include India (44.4%) and United States (16.7%).
- Top languages spoken are English (40.5%) followed by Hindi (28.6%).
- A significant demographic segment is the Post-2000s (Gen Z/Alpha) group, representing 50% of guests.
Recommendations for Hosts
- Balance marketing efforts between domestic and international channels based on the guest mix.
- Tailor amenities and listing descriptions to appeal to the dominant Post-2000s (Gen Z/Alpha) demographic (e.g., highlight fast WiFi, smart home features, local guides).
- Highlight unique local experiences or amenities relevant to the primary guest profile.
- Consider seasonal promotions aligned with peak travel times for key origin markets.
Nearby Short-Term Rental Market Comparison
How does the Naini Airbnb market stack up against its neighbors? Compare key performance metrics like average monthly revenue, ADR, and occupancy rates in surrounding areas to understand the broader regional STR landscape.