Bhagyura Airbnb Market Analysis 2026: Short Term Rental Data & Vacation Rental Statistics in Uttarakhand, India
Is Airbnb profitable in Bhagyura in 2026? Explore comprehensive Airbnb analytics for Bhagyura, Uttarakhand, India to uncover income potential. This 2026 STR market report for Bhagyura, based on AirROI data from February 2025 to January 2026, reveals key trends in the niche market of 19 active listings.
Whether you're considering an Airbnb investment in Bhagyura, optimizing your existing vacation rental, or exploring rental arbitrage opportunities, understanding the Bhagyura Airbnb data is crucial. Leveraging the low regulation environment is key to maximizing your short term rental income potential. Let's dive into the specifics.
Key Bhagyura Airbnb Performance Metrics Overview
Monthly Airbnb Revenue Variations & Income Potential in Bhagyura (2026)
Understanding the monthly revenue variations for Airbnb listings in Bhagyura is key to maximizing your short term rental income potential. Seasonality significantly impacts earnings. Our analysis, based on data from the past 12 months, shows that the peak revenue month for STRs in Bhagyura is typically February, while September often presents the lowest earnings, highlighting opportunities for strategic pricing adjustments during shoulder and low seasons. Explore the typical Airbnb income in Bhagyura across different performance tiers:
- Best-in-class properties (Top 10%) achieve $1,228+ monthly, often utilizing dynamic pricing and superior guest experiences.
- Strong performing properties (Top 25%) earn $544 or more, indicating effective management and desirable locations/amenities.
- Typical properties (Median) generate around $235 per month, representing the average market performance.
- Entry-level properties (Bottom 25%) see earnings around $139, often with potential for optimization.
Average Monthly Airbnb Earnings Trend in Bhagyura
Bhagyura Airbnb Occupancy Rate Trends (2026)
Maximize your bookings by understanding the Bhagyura STR occupancy trends. Seasonal demand shifts significantly influence how often properties are booked. Typically, Februarysees the highest demand (peak season occupancy), while September experiences the lowest (low season). Effective strategies, like adjusting minimum stays or offering promotions, can boost occupancy during slower periods. Here's how different property tiers perform in Bhagyura:
- Best-in-class properties (Top 10%) achieve 40%+ occupancy, indicating high desirability and potentially optimized availability.
- Strong performing properties (Top 25%) maintain 25% or higher occupancy, suggesting good market fit and guest satisfaction.
- Typical properties (Median) have an occupancy rate around 13%.
- Entry-level properties (Bottom 25%) average 8% occupancy, potentially facing higher vacancy.
Average Monthly Occupancy Rate Trend in Bhagyura
Average Daily Rate (ADR) Airbnb Trends in Bhagyura (2026)
Effective short term rental pricing strategy in Bhagyura involves understanding monthly ADR fluctuations. The Average Daily Rate (ADR) for Airbnb in Bhagyura typically peaks in June and dips lowest during September. Leveraging Airbnb dynamic pricing tools or strategies based on this seasonality can significantly boost revenue. Here's a look at the typical nightly rates achieved:
- Best-in-class properties (Top 10%) command rates of $199+ per night, often due to premium features or locations.
- Strong performing properties (Top 25%) achieve nightly rates of $109 or more.
- Typical properties (Median) charge around $56 per night.
- Entry-level properties (Bottom 25%) earn around $31 per night.
Average Daily Rate (ADR) Trend by Month in Bhagyura
Get Live Bhagyura Market Intelligence 👇

Explore Real-time Analytics
Airbnb Seasonality Analysis & Trends in Bhagyura (2026)
Peak Season (February, March, June)
- Revenue averages $723 per month
- Occupancy rates average 22.3%
- Daily rates average $90
Shoulder Season
- Revenue averages $473 per month
- Occupancy maintains around 18.0%
- Daily rates hold near $84
Low Season (January, September, November)
- Revenue drops to average $239 per month
- Occupancy decreases to average 12.8%
- Daily rates adjust to average $74
Seasonality Insights for Bhagyura
- The Airbnb seasonality in Bhagyura shows highly seasonal trends requiring careful strategy. While the sections above show seasonal averages, it's also insightful to look at the extremes:
- During the high season, the absolute peak month showcases Bhagyura's highest earning potential, with monthly revenues capable of climbing to $751, occupancy reaching a high of 24.6%, and ADRs peaking at $97.
- Conversely, the slowest single month of the year, typically falling within the low season, marks the market's lowest point. In this month, revenue might dip to $205, occupancy could drop to 12.2%, and ADRs may adjust down to $73.
- Understanding both the seasonal averages and these monthly peaks and troughs in revenue, occupancy, and ADR is crucial for maximizing your Airbnb profit potential in Bhagyura.
Seasonal Strategies for Maximizing Profit
- Peak Season: Maximize revenue through premium pricing and potentially longer minimum stays. Ensure high availability.
- Low Season: Offer competitive pricing, special promotions (e.g., extended stay discounts), and flexible cancellation policies. Target off-season travelers like remote workers or budget-conscious guests.
- Shoulder Seasons: Implement dynamic pricing that balances peak and low rates. Target weekend travelers or specific events. Offer slightly more flexible terms than peak season.
- Regularly analyze your own performance against these Bhagyura seasonality benchmarks and adjust your pricing and availability strategy accordingly.
Best Areas for Airbnb Investment in Bhagyura (2026)
Exploring the top neighborhoods for short-term rentals in Bhagyura? This section highlights key areas, outlining why they are attractive for hosts and guests, along with notable local attractions. Consider these locations based on your target guest profile and investment strategy.
| Neighborhood / Area | Why Host Here? (Target Guests & Appeal) | Key Attractions & Landmarks |
|---|---|---|
| Rudraprayag | Known for its scenic beauty and proximity to the sacred confluence of Alaknanda and Mandakini rivers, Rudraprayag attracts tourists seeking a serene spiritual experience and nature lovers alike. | Rudranath Temple, Kedarnath, Chopta, Kedarnath Wildlife Sanctuary, Dhari Devi Temple |
| Auli | Auli is a popular hill station famous for its ski resort and breathtaking views of the Himalayas. It attracts adventure seekers and snow sports enthusiasts. | Auli Ski Resort, Gurso Bugyal, Chenab Lake, Auli Artificial Lake, Nanda Devi National Park |
| Nainital | Nainital is a charming hill station with a beautiful lake at its center. Known for its pleasant weather and tourist-friendly environment, it's a hotspot for visitors all year round. | Naini Lake, Naina Devi Temple, Snow View Point, Tiffin Top, Boating Club |
| Mussoorie | Mussoorie is a popular hill station known for its colonial architecture and stunning views of the Himalayas. It attracts honeymooners, families, and adventure enthusiasts. | Kempty Falls, Gun Hill, Camel's Back Road, Mussoorie Lake, Lal Tibba |
| Haridwar | Haridwar is a sacred city on the banks of the Ganges, known for its ghats and temples. It's a prime location for spiritual tourism and attracts thousands of pilgrims. | Har Ki Pauri, Chandi Devi Temple, Mansa Devi Temple, Rajaji National Park, Ganga Aarti |
| Rishikesh | Rishikesh is famed as the 'Yoga Capital of the World'. It attracts wellness seekers, adventure tourists, and spiritual practitioners looking for a holistic experience. | Laxman Jhula, Triveni Ghat, Parmarth Niketan Ashram, River Rafting in Ganges, Yoga Retreats |
| Joshimath | Joshimath is a major pilgrimage stop and gateway to various Himalayan treks and temples. It attracts trekkers and spiritual tourists seeking to explore the higher Himalayas. | Narsingh Temple, Auli Ropeway, Joshimath Skiing, Tapovan, Valley of Flowers |
| Bageshwar | Bageshwar is a quieter hill station known for its tranquility and Hindu pilgrimage sites. It attracts visitors looking to escape the hustle and bustle of city life. | Bageshwar Temple, Kanda, Baijnath Temple, Pindari Glacier Trek, Sunderdhunga Glacier Trek |
Understanding Airbnb License Requirements & STR Laws in Bhagyura (2026)
While Bhagyura, Uttarakhand, India currently shows low STR regulations, specific Airbnb license requirements might still exist or change. Always verify the latest short term rental regulations and Airbnb license requirements directly with local government authorities for Bhagyura to ensure full compliance before hosting.
(Source: AirROI data, 2026, finding no licensed listings among those analyzed)
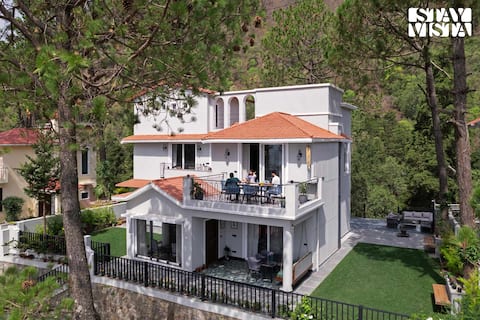
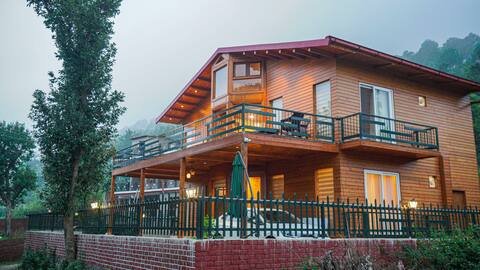
Top Performing Airbnb Properties in Bhagyura (2026)
Benchmark your potential! Explore examples of top-performing Airbnb properties in Bhagyurabased on Trailing Twelve Month (TTM) revenue. Analyze their characteristics, revenue, occupancy rate, and ADR to understand what drives success in this market.
4BR Kaira @ Bhimtal w/Mountain View & WiFi
Entire Place • 4 bedrooms

King Room | Moustache Bhimtal Luxuria
Private Room • 1 bedroom

Pothia - a lovely vacation home with scenic views
Entire Place • 2 bedrooms

WoodWalk: Private Bhimtal Homestay 8 + Kainchi Dham
Entire Place • 3 bedrooms

Whistling Blossom- your private villa in Bhimtal!
Entire Place • 2 bedrooms
Luxury 5 Bedroom Villa | Bhimtal Country Homes
Entire Place • 5 bedrooms
Note: Performance varies based on location, size, amenities, seasonality, and management quality. Data reflects the past 12 months.
Top Performing Airbnb Hosts in Bhagyura (2026)
Learn from the best! This table showcases top-performing Airbnb hosts in Bhagyura based on the number of properties managed and estimated total revenue over the past year. Analyze their scale and performance metrics.
| Host Name | Properties | Grossing Revenue | Stay Reviews | Avg Rating |
|---|---|---|---|---|
| Neha | 1 | $22,038 | 1 | Not Rated |
| Abhishek | 2 | $9,172 | 5 | 4.75/5.0 |
| Kartikey | 1 | $4,856 | 115 | 4.92/5.0 |
| Khayat | 3 | $4,549 | 15 | 4.85/5.0 |
| WoodWalk Homestay | 1 | $4,234 | 20 | 4.55/5.0 |
| Ria | 1 | $3,295 | 81 | 4.86/5.0 |
| Amit | 1 | $1,845 | 8 | 4.50/5.0 |
| Om Prakash | 2 | $1,594 | 32 | 4.90/5.0 |
| Karan | 1 | $1,561 | 4 | 5.00/5.0 |
| Amit | 1 | $1,379 | 19 | 4.89/5.0 |
Analyzing the strategies of top hosts, such as their property selection, pricing, and guest communication, can offer valuable lessons for optimizing your own Airbnb operations in Bhagyura.
Dive Deeper: Advanced Bhagyura STR Market Data (2026)
Ready to unlock more insights? AirROI provides access to advanced metrics and comprehensive Airbnb data for Bhagyura. Explore detailed analytics beyond this report to refine your investment strategy, optimize pricing, and maximize your vacation rental profits.
Explore Advanced MetricsBhagyura Short-Term Rental Market Composition (2026): Property & Room Types
Room Type Distribution
Property Type Distribution
Market Composition Insights for Bhagyura
- The Bhagyura Airbnb market composition is heavily skewed towards Entire Home/Apt listings, which make up 68.4% of the 19 active rentals. This indicates strong guest preference for privacy and space.
- However, a notable 31.6% share for Private Rooms suggests opportunities for budget-conscious travelers or hosts renting out spare rooms.
- Looking at the property type distribution in Bhagyura, House properties are the most common (68.4%), reflecting the local real estate landscape.
- Houses represent a significant 68.4% portion, catering likely to families or larger groups.
- The presence of 10.5% Hotel/Boutique listings indicates integration with traditional hospitality.
Bhagyura Airbnb Room Capacity Analysis (2026): Bedroom Distribution
Distribution of Listings by Number of Bedrooms
Room Capacity Insights for Bhagyura
- The dominant room capacity in Bhagyura is 2 bedrooms listings, making up 42.1% of the market. This suggests a strong demand for properties suitable for couples or solo travelers.
- Together, 2 bedrooms and 1 bedroom properties represent 63.2% of the active Airbnb listings in Bhagyura, indicating a high concentration in these sizes.
- A significant 26.3% of listings offer 3+ bedrooms, catering to larger groups and families seeking more space in Bhagyura.
Bhagyura Vacation Rental Guest Capacity Trends (2026)
Distribution of Listings by Guest Capacity
Guest Capacity Insights for Bhagyura
- The most common guest capacity trend in Bhagyura vacation rentals is listings accommodating 6 guests (26.3%). This suggests the primary traveler segment is likely larger groups.
- Properties designed for 6 guests and 8+ guests dominate the Bhagyura STR market, accounting for 52.6% of listings.
- 52.6% of properties accommodate 6+ guests, serving the market segment for larger families or group travel in Bhagyura.
- On average, properties in Bhagyura are equipped to host 4.3 guests.
Bhagyura Airbnb Booking Patterns (2026): Available vs. Booked Days
Available Days Distribution
Booked Days Distribution
Booking Pattern Insights for Bhagyura
- The most common availability pattern in Bhagyura falls within the 271-366 days range, representing 100% of listings. This suggests many properties have significant open periods on their calendars.
- Approximately 100.0% of listings show high availability (181+ days open annually), indicating potential for increased bookings or specific owner usage patterns.
- For booked days, the 1-30 days range is most frequent in Bhagyura (57.9%), reflecting common guest stay durations or potential owner blocking patterns.
Bhagyura Airbnb Minimum Stay Requirements Analysis
Distribution of Listings by Minimum Night Requirement
1 Night
18 listings
94.7% of total
30+ Nights
1 listings
5.3% of total
Key Insights
- The most prevalent minimum stay requirement in Bhagyura is 1 Night, adopted by 94.7% of listings. This highlights the market's preference for shorter, flexible bookings.
- A strong majority (94.7%) of the Bhagyura Airbnb data shows acceptance of very short stays (1-2 nights), indicating a dynamic, high-turnover market.
Recommendations
- Align with the market by considering a 1 Night minimum stay, as 94.7% of Bhagyura hosts use this setting.
- Explore offering discounts for stays of 30+ nights to attract the 5.3% of the market seeking extended stays.
- Adjust minimum nights based on seasonality – potentially shorter during low season and longer during peak demand periods in Bhagyura.
Bhagyura Airbnb Cancellation Policy Trends Analysis (2026)
Super Strict 30 Days
1 listings
5.3% of total
Flexible
8 listings
42.1% of total
Moderate
4 listings
21.1% of total
Firm
6 listings
31.6% of total
Cancellation Policy Insights for Bhagyura
- The prevailing Airbnb cancellation policy trend in Bhagyura is Flexible, used by 42.1% of listings.
- There's a relatively balanced mix between guest-friendly (63.2%) and stricter (31.6%) policies, offering choices for different guest needs.
Recommendations for Hosts
- Consider adopting a Flexible policy to align with the 42.1% market standard in Bhagyura.
- Regularly review your cancellation policy against competitors and market demand shifts in Bhagyura.
Bhagyura STR Booking Lead Time Analysis (2026)
Average Booking Lead Time by Month
Booking Lead Time Insights for Bhagyura
- The overall average booking lead time for vacation rentals in Bhagyura is 17 days.
- Guests book furthest in advance for stays during September (average 55 days), likely coinciding with peak travel demand or local events.
- The shortest booking windows occur for stays in November (average 3 days), indicating more last-minute travel plans during this time.
- Seasonally, Fall (23 days avg.) sees the longest lead times, while Spring (14 days avg.) has the shortest, reflecting typical travel planning cycles.
Recommendations for Hosts
- Use the overall average lead time (17 days) as a baseline for your pricing and availability strategy in Bhagyura.
- For September stays, consider implementing length-of-stay discounts or slightly higher rates for bookings made less than 55 days out to capitalize on advance planning.
- During November, focus on last-minute booking availability and promotions, as guests book with very short notice (3 days avg.).
- Target marketing efforts for the Fall season well in advance (at least 23 days) to capture early planners.
- Monitor your own booking lead times against these Bhagyura averages to identify opportunities for dynamic pricing adjustments.
Popular & Essential Airbnb Amenities in Bhagyura (2026)
Amenity Prevalence
Amenity Insights for Bhagyura
- Essential amenities in Bhagyura that guests expect include: Wifi. Lacking these (this) could significantly impact bookings.
- Popular amenities like Clothing storage, Bed linens, Ceiling fan are common but not universal. Offering these can provide a competitive edge.
Recommendations for Hosts
- Ensure your listing includes all essential amenities for Bhagyura: Wifi.
- Consider adding popular differentiators like Clothing storage or Bed linens to increase appeal.
- Highlight unique or less common amenities you offer (e.g., hot tub, dedicated workspace, EV charger) in your listing description and photos.
- Regularly check competitor amenities in Bhagyura to stay competitive.
Bhagyura Airbnb Guest Demographics & Profile Analysis (2026)
Guest Profile Summary for Bhagyura
- The typical guest profile for Airbnb in Bhagyura consists of primarily domestic travelers (92%), often arriving from nearby New Delhi, typically belonging to the Post-2000s (Gen Z/Alpha) group (50%), primarily speaking Hindi or English.
- Domestic travelers account for 91.7% of guests.
- Key international markets include India (91.7%) and Canada (4.2%).
- Top languages spoken are Hindi (42.1%) followed by English (42.1%).
- A significant demographic segment is the Post-2000s (Gen Z/Alpha) group, representing 50% of guests.
Recommendations for Hosts
- Target domestic marketing efforts towards travelers from New Delhi and Jaipur.
- Tailor amenities and listing descriptions to appeal to the dominant Post-2000s (Gen Z/Alpha) demographic (e.g., highlight fast WiFi, smart home features, local guides).
- Highlight unique local experiences or amenities relevant to the primary guest profile.
- Consider seasonal promotions aligned with peak travel times for key origin markets.
Nearby Short-Term Rental Market Comparison
How does the Bhagyura Airbnb market stack up against its neighbors? Compare key performance metrics like average monthly revenue, ADR, and occupancy rates in surrounding areas to understand the broader regional STR landscape.
| Market | Active Properties | Monthly Revenue | Daily Rate | Avg. Occupancy |
|---|---|---|---|---|
| Dungsil Malla | 22 | $923 | $156.38 | 19% |
| barlowganj | 21 | $851 | $206.15 | 24% |
| Jabarkhet | 28 | $765 | $98.72 | 29% |
| bluchor hill | 28 | $762 | $152.00 | 21% |
| Bhimtal | 92 | $598 | $144.67 | 20% |
| Bilaspur | 12 | $591 | $130.77 | 20% |
| bhatta | 48 | $565 | $100.82 | 26% |
| Mussoorie | 187 | $551 | $116.52 | 26% |
| Rāmnagar | 23 | $543 | $140.74 | 17% |
| Jawaharna | 24 | $542 | $129.87 | 16% |