punkalgaon Airbnb Market Analysis 2026: Short Term Rental Data & Vacation Rental Statistics in Uttarakhand, India
Is Airbnb profitable in punkalgaon in 2026? Explore comprehensive Airbnb analytics for punkalgaon, Uttarakhand, India to uncover income potential. This 2026 STR market report for punkalgaon, based on AirROI data from February 2025 to January 2026, reveals key trends in the niche market of 41 active listings.
Whether you're considering an Airbnb investment in punkalgaon, optimizing your existing vacation rental, or exploring rental arbitrage opportunities, understanding the punkalgaon Airbnb data is crucial. Leveraging the low regulation environment is key to maximizing your short term rental income potential. Let's dive into the specifics.
Key punkalgaon Airbnb Performance Metrics Overview
Monthly Airbnb Revenue Variations & Income Potential in punkalgaon (2026)
Understanding the monthly revenue variations for Airbnb listings in punkalgaon is key to maximizing your short term rental income potential. Seasonality significantly impacts earnings. Our analysis, based on data from the past 12 months, shows that the peak revenue month for STRs in punkalgaon is typically December, while September often presents the lowest earnings, highlighting opportunities for strategic pricing adjustments during shoulder and low seasons. Explore the typical Airbnb income in punkalgaon across different performance tiers:
- Best-in-class properties (Top 10%) achieve $2,309+ monthly, often utilizing dynamic pricing and superior guest experiences.
- Strong performing properties (Top 25%) earn $925 or more, indicating effective management and desirable locations/amenities.
- Typical properties (Median) generate around $428 per month, representing the average market performance.
- Entry-level properties (Bottom 25%) see earnings around $177, often with potential for optimization.
Average Monthly Airbnb Earnings Trend in punkalgaon
punkalgaon Airbnb Occupancy Rate Trends (2026)
Maximize your bookings by understanding the punkalgaon STR occupancy trends. Seasonal demand shifts significantly influence how often properties are booked. Typically, Decembersees the highest demand (peak season occupancy), while July experiences the lowest (low season). Effective strategies, like adjusting minimum stays or offering promotions, can boost occupancy during slower periods. Here's how different property tiers perform in punkalgaon:
- Best-in-class properties (Top 10%) achieve 44%+ occupancy, indicating high desirability and potentially optimized availability.
- Strong performing properties (Top 25%) maintain 27% or higher occupancy, suggesting good market fit and guest satisfaction.
- Typical properties (Median) have an occupancy rate around 16%.
- Entry-level properties (Bottom 25%) average 8% occupancy, potentially facing higher vacancy.
Average Monthly Occupancy Rate Trend in punkalgaon
Average Daily Rate (ADR) Airbnb Trends in punkalgaon (2026)
Effective short term rental pricing strategy in punkalgaon involves understanding monthly ADR fluctuations. The Average Daily Rate (ADR) for Airbnb in punkalgaon typically peaks in December and dips lowest during April. Leveraging Airbnb dynamic pricing tools or strategies based on this seasonality can significantly boost revenue. Here's a look at the typical nightly rates achieved:
- Best-in-class properties (Top 10%) command rates of $215+ per night, often due to premium features or locations.
- Strong performing properties (Top 25%) achieve nightly rates of $133 or more.
- Typical properties (Median) charge around $74 per night.
- Entry-level properties (Bottom 25%) earn around $52 per night.
Average Daily Rate (ADR) Trend by Month in punkalgaon
Get Live punkalgaon Market Intelligence 👇

Explore Real-time Analytics
Airbnb Seasonality Analysis & Trends in punkalgaon (2026)
Peak Season (December, May, June)
- Revenue averages $1,122 per month
- Occupancy rates average 23.8%
- Daily rates average $109
Shoulder Season
- Revenue averages $856 per month
- Occupancy maintains around 19.6%
- Daily rates hold near $104
Low Season (August, September, November)
- Revenue drops to average $671 per month
- Occupancy decreases to average 17.3%
- Daily rates adjust to average $106
Seasonality Insights for punkalgaon
- The Airbnb seasonality in punkalgaon shows moderate seasonality with distinct peak and low periods. While the sections above show seasonal averages, it's also insightful to look at the extremes:
- During the high season, the absolute peak month showcases punkalgaon's highest earning potential, with monthly revenues capable of climbing to $1,197, occupancy reaching a high of 26.8%, and ADRs peaking at $111.
- Conversely, the slowest single month of the year, typically falling within the low season, marks the market's lowest point. In this month, revenue might dip to $636, occupancy could drop to 15.5%, and ADRs may adjust down to $100.
- Understanding both the seasonal averages and these monthly peaks and troughs in revenue, occupancy, and ADR is crucial for maximizing your Airbnb profit potential in punkalgaon.
Seasonal Strategies for Maximizing Profit
- Peak Season: Maximize revenue through premium pricing and potentially longer minimum stays. Ensure high availability.
- Low Season: Offer competitive pricing, special promotions (e.g., extended stay discounts), and flexible cancellation policies. Target off-season travelers like remote workers or budget-conscious guests.
- Shoulder Seasons: Implement dynamic pricing that balances peak and low rates. Target weekend travelers or specific events. Offer slightly more flexible terms than peak season.
- Regularly analyze your own performance against these punkalgaon seasonality benchmarks and adjust your pricing and availability strategy accordingly.
Best Areas for Airbnb Investment in punkalgaon (2026)
Exploring the top neighborhoods for short-term rentals in punkalgaon? This section highlights key areas, outlining why they are attractive for hosts and guests, along with notable local attractions. Consider these locations based on your target guest profile and investment strategy.
| Neighborhood / Area | Why Host Here? (Target Guests & Appeal) | Key Attractions & Landmarks |
|---|---|---|
| Mussorie | Known as the 'Queen of the Hills', Mussorie attracts tourists with its scenic views and colonial architecture. It's a popular destination for families and couples looking for relaxation and adventure. | Kempty Falls, Gun Hill, Lal Tibba, Camel's Back Road, Mussoorie Lake, Jharipani Falls |
| Nainital | Famous for its picturesque lake and surrounding hills, Nainital offers a tranquil experience and is a favored spot for honeymooners and nature lovers. | Naini Lake, Naina Devi Temple, Snow View Point, Tiffin Top, Nainital Zoo, The Mall Road |
| Rishikesh | Known as the 'Yoga Capital of the World', Rishikesh attracts spiritual seekers and adventure enthusiasts, offering a unique blend of serenity and thrill with river rafting and yoga retreats. | Ganga Aarti at Parmarth Niketan, Triveni Ghat, Laxman Jhula, Bungee Jumping, Yoga Ashrams, Rajaji National Park |
| Haridwar | A sacred city on the Ganges River, Haridwar is a hotspot for spiritual tourism with its ghats and temples, attracting pilgrims and tourists alike. | Har Ki Pauri, Chandi Devi Temple, Mansa Devi Temple, Ganga Aarti, Shantikunj, Rajaji National Park |
| Auli | A skiing destination in the Himalayas, Auli draws adventure seekers and snow sports enthusiasts during winter, offering stunning views of the Himalayan peaks. | Skiing, Auli Artificial Lake, Gurso Bugyal, Chenab Lake, Nanda Devi National Park, viewpoints |
| Almora | Known for its rich culture and heritage, Almora offers a peaceful retreat with beautiful landscapes, appealing to tourists looking for tranquility and exploration. | Kasar Devi Temple, Almora Fort, Binsar Wildlife Sanctuary, Bright End Corner, Martola, Chitai Golu Devta Temple |
| Mukteshwar | A charming hill station offering stunning views of the Himalayas, Mukteshwar is ideal for nature lovers and adventure seekers, known for rock climbing and hiking. | Mukteshwar Temple, Bhalu Gaad Waterfall, Chauli Ki Jali, Mukteshwar Inspection Bungalow, Nathuakhan, Kumaon Mandal Vikas Nigam |
| Kausani | With breathtaking views of the Himalayas, Kausani is famous for its scenic beauty and tea gardens, attracting visitors looking for a peaceful retreat amidst nature. | Anasakti Ashram, Baijnath Temple, Kausani tea estate, Viewpoint on Trisul, Kausani Planetarium, Pindari Glacier Trek |
Understanding Airbnb License Requirements & STR Laws in punkalgaon (2026)
While punkalgaon, Uttarakhand, India currently shows low STR regulations, specific Airbnb license requirements might still exist or change. Always verify the latest short term rental regulations and Airbnb license requirements directly with local government authorities for punkalgaon to ensure full compliance before hosting.
(Source: AirROI data, 2026, finding no licensed listings among those analyzed)
Top Performing Airbnb Properties in punkalgaon (2026)
Benchmark your potential! Explore examples of top-performing Airbnb properties in punkalgaonbased on Trailing Twelve Month (TTM) revenue. Analyze their characteristics, revenue, occupancy rate, and ADR to understand what drives success in this market.
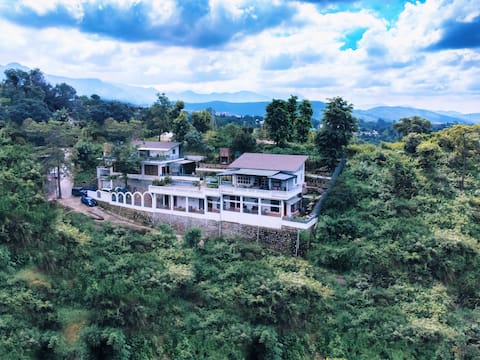
The Bluedoor Dehradun - A Riverside Luxe Villa
Entire Place • 5 bedrooms
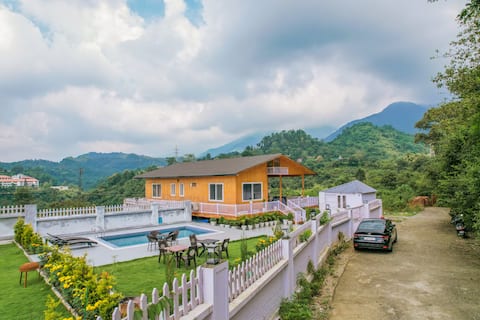
Scenic Hilltop Haven | Pet-Friendly Stay W/ Pool
Entire Place • 3 bedrooms
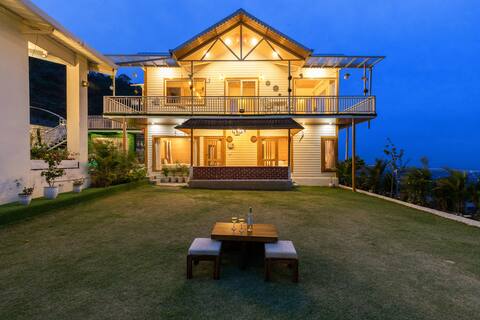
Ramante where luxury blends with nature
Entire Place • 4 bedrooms
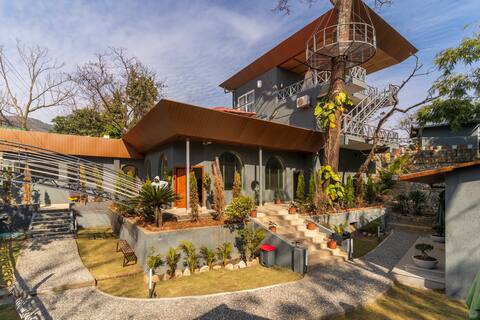
Nadora House - A beautiful getaway experience.
Entire Place • 5 bedrooms
The Sage Villa - Luxury Homestay in Dehradun
Entire Place • 4 bedrooms
Sunny Stays
Entire Place • 2 bedrooms
Note: Performance varies based on location, size, amenities, seasonality, and management quality. Data reflects the past 12 months.
Top Performing Airbnb Hosts in punkalgaon (2026)
Learn from the best! This table showcases top-performing Airbnb hosts in punkalgaon based on the number of properties managed and estimated total revenue over the past year. Analyze their scale and performance metrics.
| Host Name | Properties | Grossing Revenue | Stay Reviews | Avg Rating |
|---|---|---|---|---|
| Kavita | 1 | $59,941 | 9 | 4.78/5.0 |
| Rashmi | 5 | $43,184 | 69 | 4.73/5.0 |
| Akanksha | 3 | $31,736 | 6 | 5.00/5.0 |
| Jagdeep | 1 | $31,381 | 33 | 4.82/5.0 |
| Jasmine | 1 | $14,264 | 9 | 4.89/5.0 |
| Prateek | 1 | $10,390 | 49 | 4.98/5.0 |
| Rupeela | 2 | $10,197 | 81 | 4.99/5.0 |
| Kenneth Rolland Shipley | 2 | $9,843 | 179 | 4.63/5.0 |
| Pushpinder | 2 | $8,358 | 104 | 4.80/5.0 |
| Manav | 1 | $7,984 | 6 | 5.00/5.0 |
Analyzing the strategies of top hosts, such as their property selection, pricing, and guest communication, can offer valuable lessons for optimizing your own Airbnb operations in punkalgaon.
Dive Deeper: Advanced punkalgaon STR Market Data (2026)
Ready to unlock more insights? AirROI provides access to advanced metrics and comprehensive Airbnb data for punkalgaon. Explore detailed analytics beyond this report to refine your investment strategy, optimize pricing, and maximize your vacation rental profits.
Explore Advanced Metricspunkalgaon Short-Term Rental Market Composition (2026): Property & Room Types
Room Type Distribution
Property Type Distribution
Market Composition Insights for punkalgaon
- The punkalgaon Airbnb market composition is heavily skewed towards Entire Home/Apt listings, which make up 58.5% of the 41 active rentals. This indicates strong guest preference for privacy and space.
- However, a notable 41.5% share for Private Rooms suggests opportunities for budget-conscious travelers or hosts renting out spare rooms.
- Looking at the property type distribution in punkalgaon, House properties are the most common (61%), reflecting the local real estate landscape.
- Houses represent a significant 61% portion, catering likely to families or larger groups.
- The presence of 14.6% Hotel/Boutique listings indicates integration with traditional hospitality.
- Smaller segments like others (combined 2.4%) offer potential for unique stay experiences.
punkalgaon Airbnb Room Capacity Analysis (2026): Bedroom Distribution
Distribution of Listings by Number of Bedrooms
Room Capacity Insights for punkalgaon
- The dominant room capacity in punkalgaon is 1 bedroom listings, making up 19.5% of the market. This suggests a strong demand for properties suitable for couples or solo travelers.
- Together, 1 bedroom and 3 bedrooms properties represent 36.6% of the active Airbnb listings in punkalgaon, indicating a high concentration in these sizes.
- A significant 36.6% of listings offer 3+ bedrooms, catering to larger groups and families seeking more space in punkalgaon.
punkalgaon Vacation Rental Guest Capacity Trends (2026)
Distribution of Listings by Guest Capacity
Guest Capacity Insights for punkalgaon
- The most common guest capacity trend in punkalgaon vacation rentals is listings accommodating 8+ guests (34.1%). This suggests the primary traveler segment is likely larger groups.
- Properties designed for 8+ guests and 2 guests dominate the punkalgaon STR market, accounting for 43.9% of listings.
- 43.9% of properties accommodate 6+ guests, serving the market segment for larger families or group travel in punkalgaon.
- On average, properties in punkalgaon are equipped to host 3.9 guests.
punkalgaon Airbnb Booking Patterns (2026): Available vs. Booked Days
Available Days Distribution
Booked Days Distribution
Booking Pattern Insights for punkalgaon
- The most common availability pattern in punkalgaon falls within the 271-366 days range, representing 85.4% of listings. This suggests many properties have significant open periods on their calendars.
- Approximately 100.0% of listings show high availability (181+ days open annually), indicating potential for increased bookings or specific owner usage patterns.
- For booked days, the 1-30 days range is most frequent in punkalgaon (51.2%), reflecting common guest stay durations or potential owner blocking patterns.
punkalgaon Airbnb Minimum Stay Requirements Analysis
Distribution of Listings by Minimum Night Requirement
1 Night
39 listings
95.1% of total
2 Nights
1 listings
2.4% of total
30+ Nights
1 listings
2.4% of total
Key Insights
- The most prevalent minimum stay requirement in punkalgaon is 1 Night, adopted by 95.1% of listings. This highlights the market's preference for shorter, flexible bookings.
- A strong majority (97.5%) of the punkalgaon Airbnb data shows acceptance of very short stays (1-2 nights), indicating a dynamic, high-turnover market.
- Dedicated monthly rentals (30+ nights) represent a small niche (2.4%), possibly an untapped area for hosts.
Recommendations
- Align with the market by considering a 1 Night minimum stay, as 95.1% of punkalgaon hosts use this setting.
- Adjust minimum nights based on seasonality – potentially shorter during low season and longer during peak demand periods in punkalgaon.
punkalgaon Airbnb Cancellation Policy Trends Analysis (2026)
Super Strict 30 Days
1 listings
2.4% of total
Flexible
11 listings
26.8% of total
Moderate
15 listings
36.6% of total
Firm
12 listings
29.3% of total
Strict
2 listings
4.9% of total
Cancellation Policy Insights for punkalgaon
- The prevailing Airbnb cancellation policy trend in punkalgaon is Moderate, used by 36.6% of listings.
- There's a relatively balanced mix between guest-friendly (63.4%) and stricter (34.2%) policies, offering choices for different guest needs.
- Strict cancellation policies are quite rare (4.9%), potentially making listings with this policy less competitive unless justified by high demand or property type.
Recommendations for Hosts
- Consider adopting a Moderate policy to align with the 36.6% market standard in punkalgaon.
- Using a Strict policy might deter some guests, as only 4.9% of listings use it. Evaluate if potential revenue protection outweighs possible lower booking rates.
- Regularly review your cancellation policy against competitors and market demand shifts in punkalgaon.
punkalgaon STR Booking Lead Time Analysis (2026)
Average Booking Lead Time by Month
Booking Lead Time Insights for punkalgaon
- The overall average booking lead time for vacation rentals in punkalgaon is 13 days.
- Guests book furthest in advance for stays during December (average 28 days), likely coinciding with peak travel demand or local events.
- The shortest booking windows occur for stays in February (average 10 days), indicating more last-minute travel plans during this time.
- Seasonally, Winter (20 days avg.) sees the longest lead times, while Summer (13 days avg.) has the shortest, reflecting typical travel planning cycles.
Recommendations for Hosts
- Use the overall average lead time (13 days) as a baseline for your pricing and availability strategy in punkalgaon.
- For December stays, consider implementing length-of-stay discounts or slightly higher rates for bookings made less than 28 days out to capitalize on advance planning.
- Target marketing efforts for the Winter season well in advance (at least 20 days) to capture early planners.
- Monitor your own booking lead times against these punkalgaon averages to identify opportunities for dynamic pricing adjustments.
Popular & Essential Airbnb Amenities in punkalgaon (2026)
Amenity Prevalence
Amenity Insights for punkalgaon
- Essential amenities in punkalgaon that guests expect include: Wifi, Free parking on premises, Air conditioning. Lacking these (any) could significantly impact bookings.
- Popular amenities like TV, First aid kit, Extra pillows and blankets are common but not universal. Offering these can provide a competitive edge.
Recommendations for Hosts
- Ensure your listing includes all essential amenities for punkalgaon: Wifi, Free parking on premises, Air conditioning.
- Prioritize adding missing essentials: Free parking on premises, Air conditioning.
- Consider adding popular differentiators like TV or First aid kit to increase appeal.
- Highlight unique or less common amenities you offer (e.g., hot tub, dedicated workspace, EV charger) in your listing description and photos.
- Regularly check competitor amenities in punkalgaon to stay competitive.
punkalgaon Airbnb Guest Demographics & Profile Analysis (2026)
Guest Profile Summary for punkalgaon
- The typical guest profile for Airbnb in punkalgaon consists of primarily domestic travelers (91%), often arriving from nearby New Delhi, typically belonging to the Post-2000s (Gen Z/Alpha) group (50%), primarily speaking English or Hindi.
- Domestic travelers account for 90.9% of guests.
- Key international markets include India (90.9%) and United States (5.5%).
- Top languages spoken are English (42.5%) followed by Hindi (39.7%).
- A significant demographic segment is the Post-2000s (Gen Z/Alpha) group, representing 50% of guests.
Recommendations for Hosts
- Target domestic marketing efforts towards travelers from New Delhi and Gurugram.
- Tailor amenities and listing descriptions to appeal to the dominant Post-2000s (Gen Z/Alpha) demographic (e.g., highlight fast WiFi, smart home features, local guides).
- Highlight unique local experiences or amenities relevant to the primary guest profile.
- Consider seasonal promotions aligned with peak travel times for key origin markets.
Nearby Short-Term Rental Market Comparison
How does the punkalgaon Airbnb market stack up against its neighbors? Compare key performance metrics like average monthly revenue, ADR, and occupancy rates in surrounding areas to understand the broader regional STR landscape.
| Market | Active Properties | Monthly Revenue | Daily Rate | Avg. Occupancy |
|---|---|---|---|---|
| Dungsil Malla | 22 | $923 | $156.38 | 19% |
| barlowganj | 21 | $851 | $206.15 | 24% |
| Jabarkhet | 28 | $765 | $98.72 | 29% |
| bluchor hill | 28 | $762 | $152.00 | 21% |
| Mashobra | 10 | $739 | $247.62 | 16% |
| Bhimtal | 92 | $598 | $144.67 | 20% |
| Narkanda | 17 | $592 | $128.48 | 16% |
| Bilaspur | 12 | $591 | $130.77 | 20% |
| Dharampur | 94 | $581 | $139.92 | 17% |
| bhatta | 48 | $565 | $100.82 | 26% |