Douglas Airbnb Market Analysis 2026: Short Term Rental Data & Vacation Rental Statistics in Middle, Isle of Man
Is Airbnb profitable in Douglas in 2026? Explore comprehensive Airbnb analytics for Douglas, Middle, Isle of Man to uncover income potential. This 2026 STR market report for Douglas, based on AirROI data from February 2025 to January 2026, reveals key trends in the niche market of 84 active listings.
Whether you're considering an Airbnb investment in Douglas, optimizing your existing vacation rental, or exploring rental arbitrage opportunities, understanding the Douglas Airbnb data is crucial. Navigating the high regulation landscape is key to maximizing your short term rental income potential. Let's dive into the specifics.
Key Douglas Airbnb Performance Metrics Overview
Monthly Airbnb Revenue Variations & Income Potential in Douglas (2026)
Understanding the monthly revenue variations for Airbnb listings in Douglas is key to maximizing your short term rental income potential. Seasonality significantly impacts earnings. Our analysis, based on data from the past 12 months, shows that the peak revenue month for STRs in Douglas is typically August, while January often presents the lowest earnings, highlighting opportunities for strategic pricing adjustments during shoulder and low seasons. Explore the typical Airbnb income in Douglas across different performance tiers:
- Best-in-class properties (Top 10%) achieve $4,957+ monthly, often utilizing dynamic pricing and superior guest experiences.
- Strong performing properties (Top 25%) earn $3,067 or more, indicating effective management and desirable locations/amenities.
- Typical properties (Median) generate around $1,638 per month, representing the average market performance.
- Entry-level properties (Bottom 25%) see earnings around $772, often with potential for optimization.
Average Monthly Airbnb Earnings Trend in Douglas
Douglas Airbnb Occupancy Rate Trends (2026)
Maximize your bookings by understanding the Douglas STR occupancy trends. Seasonal demand shifts significantly influence how often properties are booked. Typically, Julysees the highest demand (peak season occupancy), while January experiences the lowest (low season). Effective strategies, like adjusting minimum stays or offering promotions, can boost occupancy during slower periods. Here's how different property tiers perform in Douglas:
- Best-in-class properties (Top 10%) achieve 77%+ occupancy, indicating high desirability and potentially optimized availability.
- Strong performing properties (Top 25%) maintain 59% or higher occupancy, suggesting good market fit and guest satisfaction.
- Typical properties (Median) have an occupancy rate around 33%.
- Entry-level properties (Bottom 25%) average 18% occupancy, potentially facing higher vacancy.
Average Monthly Occupancy Rate Trend in Douglas
Average Daily Rate (ADR) Airbnb Trends in Douglas (2026)
Effective short term rental pricing strategy in Douglas involves understanding monthly ADR fluctuations. The Average Daily Rate (ADR) for Airbnb in Douglas typically peaks in September and dips lowest during February. Leveraging Airbnb dynamic pricing tools or strategies based on this seasonality can significantly boost revenue. Here's a look at the typical nightly rates achieved:
- Best-in-class properties (Top 10%) command rates of $396+ per night, often due to premium features or locations.
- Strong performing properties (Top 25%) achieve nightly rates of $256 or more.
- Typical properties (Median) charge around $154 per night.
- Entry-level properties (Bottom 25%) earn around $101 per night.
Average Daily Rate (ADR) Trend by Month in Douglas
Get Live Douglas Market Intelligence 👇

Explore Real-time Analytics
Airbnb Seasonality Analysis & Trends in Douglas (2026)
Peak Season (August, July, June)
- Revenue averages $3,083 per month
- Occupancy rates average 49.6%
- Daily rates average $202
Shoulder Season
- Revenue averages $2,306 per month
- Occupancy maintains around 39.2%
- Daily rates hold near $207
Low Season (January, February, December)
- Revenue drops to average $1,511 per month
- Occupancy decreases to average 29.4%
- Daily rates adjust to average $205
Seasonality Insights for Douglas
- The Airbnb seasonality in Douglas shows highly seasonal trends requiring careful strategy. While the sections above show seasonal averages, it's also insightful to look at the extremes:
- During the high season, the absolute peak month showcases Douglas's highest earning potential, with monthly revenues capable of climbing to $3,203, occupancy reaching a high of 52.3%, and ADRs peaking at $224.
- Conversely, the slowest single month of the year, typically falling within the low season, marks the market's lowest point. In this month, revenue might dip to $1,003, occupancy could drop to 22.5%, and ADRs may adjust down to $181.
- Understanding both the seasonal averages and these monthly peaks and troughs in revenue, occupancy, and ADR is crucial for maximizing your Airbnb profit potential in Douglas.
Seasonal Strategies for Maximizing Profit
- Peak Season: Maximize revenue through premium pricing and potentially longer minimum stays. Ensure high availability.
- Low Season: Offer competitive pricing, special promotions (e.g., extended stay discounts), and flexible cancellation policies. Target off-season travelers like remote workers or budget-conscious guests.
- Shoulder Seasons: Implement dynamic pricing that balances peak and low rates. Target weekend travelers or specific events. Offer slightly more flexible terms than peak season.
- Regularly analyze your own performance against these Douglas seasonality benchmarks and adjust your pricing and availability strategy accordingly.
Best Areas for Airbnb Investment in Douglas (2026)
Exploring the top neighborhoods for short-term rentals in Douglas? This section highlights key areas, outlining why they are attractive for hosts and guests, along with notable local attractions. Consider these locations based on your target guest profile and investment strategy.
| Neighborhood / Area | Why Host Here? (Target Guests & Appeal) | Key Attractions & Landmarks |
|---|---|---|
| Douglas Promenade | The iconic seafront promenade is a major attraction for visitors, offering scenic views, restaurants, and entertainment. It draws tourists looking for a lively atmosphere and accessibility to local attractions. | Manx Museum, Gaiety Theatre, Douglas Beach, Horse Tramway, Laxey Wheel |
| Crediton Street | Located in the heart of Douglas, this area is close to local shops and restaurants, making it convenient for visitors exploring the town. It appeals to those seeking a local experience in a vibrant community. | Central Promenade, Douglas Market, Local eateries, Shopping streets, Theatre Royal |
| Onchan | A suburban area just outside Douglas, offering a quieter experience while still close to the main attractions. Ideal for families and those looking for a more relaxed stay with access to parks and outdoor activities. | Onchan Park, Tynwald Hill, Douglas Bay, Local hiking trails, The Sound |
| Laxey | Famous for its historic waterwheel and scenic village charm. A great spot for tourists interested in history and nature, with access to beautiful rural walks and coastal views. | Laxey Wheel, Great Laxey Mines, Laxey Beach, Walking trails, Laxey Glen Gardens |
| Castletown | A historic town that attracts visitors interested in heritage, with attractions like the Old Town and Castle. Perfect for guests who enjoy exploring the Isle of Man's rich history and architecture. | Castle Rushen, Oldgrammar School, The Nautical Museum, Castletown Mill, Castletown Harbour |
| Peel | Known for its beautiful beaches and historic sites, Peel is a charming coastal town that appeals to tourists looking for seaside relaxation and local culture, especially its famous seafood. | Peel Castle, Knockaloe Beg Farm, Peel Beach, The House of Manannan, Local markets |
| Port Erin | A picturesque seaside village known for its family-friendly beaches and scenic railway. Great for those looking for a peaceful retreat with access to nature and local attractions. | Port Erin Beach, The Railway Station, Bradda Head, Port Erin Golf Course, Local cafes |
| Santon | This area offers a serene countryside experience while being close to Douglas. Attractive for guests seeking tranquility and access to outdoor activities in a natural setting. | Santon Abbey, Local paths and walks, The River Santon, Historic farmhouses, Nature Observation |
Understanding Airbnb License Requirements & STR Laws in Douglas (2026)
Yes, Douglas, Middle, Isle of Man enforces high STR regulations. Obtaining a license and ensuring compliance is almost certainly required according to current 2026 STR laws. Always verify the latest short term rental regulations and Airbnb license requirements directly with local government authorities for Douglas to ensure full compliance before hosting.
(Source: AirROI data, 2026, based on 36% licensed listings)
Top Performing Airbnb Properties in Douglas (2026)
Benchmark your potential! Explore examples of top-performing Airbnb properties in Douglasbased on Trailing Twelve Month (TTM) revenue. Analyze their characteristics, revenue, occupancy rate, and ADR to understand what drives success in this market.

Spacious period townhouse in upper Douglas
Entire Place • 4 bedrooms
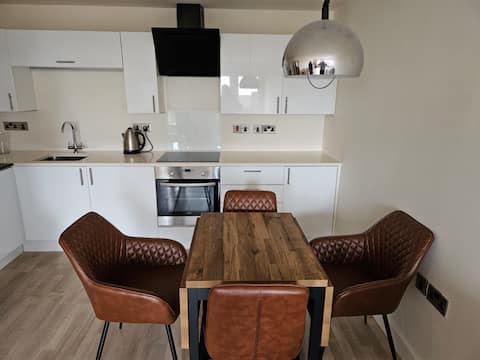
Beautiful apartment with private garden
Entire Place • 2 bedrooms

Kent Apartments No 2 - Tourist Registered 652006
Entire Place • 2 bedrooms
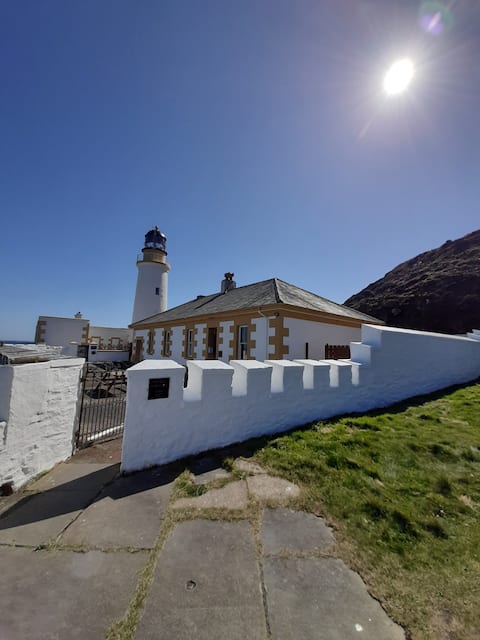
Foghorn cottage with stunning views.
Entire Place • 3 bedrooms

No 1, Douglas, Isle of Man
Entire Place • 3 bedrooms

Lighthouse keepers cottage
Entire Place • 4 bedrooms
Note: Performance varies based on location, size, amenities, seasonality, and management quality. Data reflects the past 12 months.
Top Performing Airbnb Hosts in Douglas (2026)
Learn from the best! This table showcases top-performing Airbnb hosts in Douglas based on the number of properties managed and estimated total revenue over the past year. Analyze their scale and performance metrics.
| Host Name | Properties | Grossing Revenue | Stay Reviews | Avg Rating |
|---|---|---|---|---|
| Gosia | 2 | $102,802 | 184 | 4.93/5.0 |
| Island Escapes | 5 | $90,464 | 69 | 4.68/5.0 |
| Mark | 4 | $84,210 | 55 | 4.86/5.0 |
| Wai Man | 1 | $80,750 | 70 | 4.97/5.0 |
| Andrew | 2 | $69,243 | 152 | 4.80/5.0 |
| Elaine | 1 | $60,071 | 5 | 5.00/5.0 |
| Robin | 2 | $56,601 | 41 | 4.97/5.0 |
| John | 1 | $54,591 | 123 | 4.87/5.0 |
| Heather | 1 | $52,141 | 113 | 4.72/5.0 |
| Sharon | 2 | $50,499 | 21 | 4.37/5.0 |
Analyzing the strategies of top hosts, such as their property selection, pricing, and guest communication, can offer valuable lessons for optimizing your own Airbnb operations in Douglas.
Dive Deeper: Advanced Douglas STR Market Data (2026)
Ready to unlock more insights? AirROI provides access to advanced metrics and comprehensive Airbnb data for Douglas. Explore detailed analytics beyond this report to refine your investment strategy, optimize pricing, and maximize your vacation rental profits.
Explore Advanced MetricsDouglas Short-Term Rental Market Composition (2026): Property & Room Types
Room Type Distribution
Property Type Distribution
Market Composition Insights for Douglas
- The Douglas Airbnb market composition is heavily skewed towards Entire Home/Apt listings, which make up 70.2% of the 84 active rentals. This indicates strong guest preference for privacy and space.
- Looking at the property type distribution in Douglas, Apartment/Condo properties are the most common (44%), reflecting the local real estate landscape.
- Houses represent a significant 38.1% portion, catering likely to families or larger groups.
- The presence of 13.1% Hotel/Boutique listings indicates integration with traditional hospitality.
- Smaller segments like others, unique stays (combined 4.8%) offer potential for unique stay experiences.
Douglas Airbnb Room Capacity Analysis (2026): Bedroom Distribution
Distribution of Listings by Number of Bedrooms
Room Capacity Insights for Douglas
- The dominant room capacity in Douglas is 1 bedroom listings, making up 29.8% of the market. This suggests a strong demand for properties suitable for couples or solo travelers.
- Together, 1 bedroom and 2 bedrooms properties represent 57.2% of the active Airbnb listings in Douglas, indicating a high concentration in these sizes.
- A significant 21.4% of listings offer 3+ bedrooms, catering to larger groups and families seeking more space in Douglas.
Douglas Vacation Rental Guest Capacity Trends (2026)
Distribution of Listings by Guest Capacity
Guest Capacity Insights for Douglas
- The most common guest capacity trend in Douglas vacation rentals is listings accommodating 4 guests (23.8%). This suggests the primary traveler segment is likely small families or groups.
- Properties designed for 4 guests and 2 guests dominate the Douglas STR market, accounting for 41.7% of listings.
- 21.5% of properties accommodate 6+ guests, serving the market segment for larger families or group travel in Douglas.
- On average, properties in Douglas are equipped to host 3.2 guests.
Douglas Airbnb Booking Patterns (2026): Available vs. Booked Days
Available Days Distribution
Booked Days Distribution
Booking Pattern Insights for Douglas
- The most common availability pattern in Douglas falls within the 271-366 days range, representing 54.8% of listings. This suggests many properties have significant open periods on their calendars.
- Approximately 82.2% of listings show high availability (181+ days open annually), indicating potential for increased bookings or specific owner usage patterns.
- For booked days, the 31-90 days range is most frequent in Douglas (34.5%), reflecting common guest stay durations or potential owner blocking patterns.
- A notable 19.1% of properties secure long booking periods (181+ days booked per year), highlighting successful long-term rental strategies or significant owner usage.
Douglas Airbnb Minimum Stay Requirements Analysis
Distribution of Listings by Minimum Night Requirement
1 Night
10 listings
11.9% of total
2 Nights
21 listings
25% of total
3 Nights
6 listings
7.1% of total
4-6 Nights
5 listings
6% of total
7-29 Nights
5 listings
6% of total
30+ Nights
37 listings
44% of total
Key Insights
- The most prevalent minimum stay requirement in Douglas is 30+ Nights, adopted by 44% of listings. This highlights the market's preference for longer commitments.
- A significant segment (44%) caters to monthly stays (30+ nights) in Douglas, pointing to opportunities in the extended-stay market.
Recommendations
- Align with the market by considering a 30+ Nights minimum stay, as 44% of Douglas hosts use this setting.
- If feasible, allowing 1-night stays, especially midweek or during low season, could capture last-minute bookings, as only 11.9% currently do.
- Explore offering discounts for stays of 30+ nights to attract the 44% of the market seeking extended stays.
- Adjust minimum nights based on seasonality – potentially shorter during low season and longer during peak demand periods in Douglas.
Douglas Airbnb Cancellation Policy Trends Analysis (2026)
Super Strict 60 Days
5 listings
6% of total
Flexible
11 listings
13.1% of total
Moderate
15 listings
17.9% of total
Firm
29 listings
34.5% of total
Strict
24 listings
28.6% of total
Cancellation Policy Insights for Douglas
- The prevailing Airbnb cancellation policy trend in Douglas is Firm, used by 34.5% of listings.
- A majority (63.1%) of hosts in Douglas utilize Firm or Strict policies, indicating a market where hosts prioritize booking security.
Recommendations for Hosts
- Consider adopting a Firm policy to align with the 34.5% market standard in Douglas.
- Regularly review your cancellation policy against competitors and market demand shifts in Douglas.
Douglas STR Booking Lead Time Analysis (2026)
Average Booking Lead Time by Month
Booking Lead Time Insights for Douglas
- The overall average booking lead time for vacation rentals in Douglas is 98 days.
- Guests book furthest in advance for stays during May (average 186 days), likely coinciding with peak travel demand or local events.
- The shortest booking windows occur for stays in November (average 13 days), indicating more last-minute travel plans during this time.
- Seasonally, Summer (108 days avg.) sees the longest lead times, while Winter (39 days avg.) has the shortest, reflecting typical travel planning cycles.
Recommendations for Hosts
- Use the overall average lead time (98 days) as a baseline for your pricing and availability strategy in Douglas.
- For May stays, consider implementing length-of-stay discounts or slightly higher rates for bookings made less than 186 days out to capitalize on advance planning.
- During November, focus on last-minute booking availability and promotions, as guests book with very short notice (13 days avg.).
- Target marketing efforts for the Summer season well in advance (at least 108 days) to capture early planners.
- Monitor your own booking lead times against these Douglas averages to identify opportunities for dynamic pricing adjustments.
Popular & Essential Airbnb Amenities in Douglas (2026)
Amenity Prevalence
Amenity Insights for Douglas
- Essential amenities in Douglas that guests expect include: Wifi. Lacking these (this) could significantly impact bookings.
- Popular amenities like Smoke alarm, TV, Heating are common but not universal. Offering these can provide a competitive edge.
Recommendations for Hosts
- Ensure your listing includes all essential amenities for Douglas: Wifi.
- Prioritize adding missing essentials: Wifi.
- Consider adding popular differentiators like Smoke alarm or TV to increase appeal.
- Highlight unique or less common amenities you offer (e.g., hot tub, dedicated workspace, EV charger) in your listing description and photos.
- Regularly check competitor amenities in Douglas to stay competitive.
Douglas Airbnb Guest Demographics & Profile Analysis (2026)
Guest Profile Summary for Douglas
- The typical guest profile for Airbnb in Douglas consists of predominantly international visitors (99%), with top international origins including United States, typically belonging to the Post-2000s (Gen Z/Alpha) group (50%), primarily speaking English or French.
- Domestic travelers account for 1.0% of guests.
- Key international markets include United Kingdom (69.4%) and United States (12.3%).
- Top languages spoken are English (61.6%) followed by French (10.4%).
- A significant demographic segment is the Post-2000s (Gen Z/Alpha) group, representing 50% of guests.
Recommendations for Hosts
- Focus marketing internationally, particularly towards travelers from United States.
- Tailor amenities and listing descriptions to appeal to the dominant Post-2000s (Gen Z/Alpha) demographic (e.g., highlight fast WiFi, smart home features, local guides).
- Highlight unique local experiences or amenities relevant to the primary guest profile.
- Consider seasonal promotions aligned with peak travel times for key origin markets.
Nearby Short-Term Rental Market Comparison
How does the Douglas Airbnb market stack up against its neighbors? Compare key performance metrics like average monthly revenue, ADR, and occupancy rates in surrounding areas to understand the broader regional STR landscape.
| Market | Active Properties | Monthly Revenue | Daily Rate | Avg. Occupancy |
|---|---|---|---|---|
| Dalkeith | 10 | $5,775 | $478.16 | 55% |
| Buttermere | 14 | $4,802 | $415.13 | 49% |
| Llanbedr Dyffryn Clwyd | 10 | $4,746 | $463.17 | 38% |
| City of Edinburgh | 4,083 | $4,617 | $289.88 | 60% |
| Langbank | 11 | $4,447 | $385.29 | 53% |
| Rowen | 26 | $4,220 | $376.11 | 46% |
| Llanarmon yn Iâl | 10 | $4,118 | $232.55 | 54% |
| Valley | 18 | $4,101 | $295.91 | 45% |
| Kilchattan Bay | 10 | $4,080 | $328.91 | 54% |
| Cardross | 11 | $4,049 | $378.91 | 44% |