Be’er-Sheva Airbnb Market Analysis 2026: Short Term Rental Data & Vacation Rental Statistics in Beersheba Subdistrict, Israel
Is Airbnb profitable in Be’er-Sheva in 2026? Explore comprehensive Airbnb analytics for Be’er-Sheva, Beersheba Subdistrict, Israel to uncover income potential. This 2026 STR market report for Be’er-Sheva, based on AirROI data from February 2025 to January 2026, reveals key trends in the niche market of 64 active listings.
Whether you're considering an Airbnb investment in Be’er-Sheva, optimizing your existing vacation rental, or exploring rental arbitrage opportunities, understanding the Be’er-Sheva Airbnb data is crucial. Leveraging the low regulation environment is key to maximizing your short term rental income potential. Let's dive into the specifics.
Key Be’er-Sheva Airbnb Performance Metrics Overview
Monthly Airbnb Revenue Variations & Income Potential in Be’er-Sheva (2026)
Understanding the monthly revenue variations for Airbnb listings in Be’er-Sheva is key to maximizing your short term rental income potential. Seasonality significantly impacts earnings. Our analysis, based on data from the past 12 months, shows that the peak revenue month for STRs in Be’er-Sheva is typically March, while February often presents the lowest earnings, highlighting opportunities for strategic pricing adjustments during shoulder and low seasons. Explore the typical Airbnb income in Be’er-Sheva across different performance tiers:
- Best-in-class properties (Top 10%) achieve $2,793+ monthly, often utilizing dynamic pricing and superior guest experiences.
- Strong performing properties (Top 25%) earn $1,441 or more, indicating effective management and desirable locations/amenities.
- Typical properties (Median) generate around $727 per month, representing the average market performance.
- Entry-level properties (Bottom 25%) see earnings around $308, often with potential for optimization.
Average Monthly Airbnb Earnings Trend in Be’er-Sheva
Be’er-Sheva Airbnb Occupancy Rate Trends (2026)
Maximize your bookings by understanding the Be’er-Sheva STR occupancy trends. Seasonal demand shifts significantly influence how often properties are booked. Typically, Marchsees the highest demand (peak season occupancy), while October experiences the lowest (low season). Effective strategies, like adjusting minimum stays or offering promotions, can boost occupancy during slower periods. Here's how different property tiers perform in Be’er-Sheva:
- Best-in-class properties (Top 10%) achieve 68%+ occupancy, indicating high desirability and potentially optimized availability.
- Strong performing properties (Top 25%) maintain 49% or higher occupancy, suggesting good market fit and guest satisfaction.
- Typical properties (Median) have an occupancy rate around 26%.
- Entry-level properties (Bottom 25%) average 12% occupancy, potentially facing higher vacancy.
Average Monthly Occupancy Rate Trend in Be’er-Sheva
Average Daily Rate (ADR) Airbnb Trends in Be’er-Sheva (2026)
Effective short term rental pricing strategy in Be’er-Sheva involves understanding monthly ADR fluctuations. The Average Daily Rate (ADR) for Airbnb in Be’er-Sheva typically peaks in October and dips lowest during February. Leveraging Airbnb dynamic pricing tools or strategies based on this seasonality can significantly boost revenue. Here's a look at the typical nightly rates achieved:
- Best-in-class properties (Top 10%) command rates of $186+ per night, often due to premium features or locations.
- Strong performing properties (Top 25%) achieve nightly rates of $131 or more.
- Typical properties (Median) charge around $81 per night.
- Entry-level properties (Bottom 25%) earn around $67 per night.
Average Daily Rate (ADR) Trend by Month in Be’er-Sheva
Get Live Be’er-Sheva Market Intelligence 👇

Explore Real-time Analytics
Airbnb Seasonality Analysis & Trends in Be’er-Sheva (2026)
Peak Season (March, August, July)
- Revenue averages $1,381 per month
- Occupancy rates average 35.2%
- Daily rates average $106
Shoulder Season
- Revenue averages $1,181 per month
- Occupancy maintains around 33.6%
- Daily rates hold near $110
Low Season (January, February, October)
- Revenue drops to average $941 per month
- Occupancy decreases to average 28.2%
- Daily rates adjust to average $111
Seasonality Insights for Be’er-Sheva
- The Airbnb seasonality in Be’er-Sheva shows moderate seasonality with distinct peak and low periods. While the sections above show seasonal averages, it's also insightful to look at the extremes:
- During the high season, the absolute peak month showcases Be’er-Sheva's highest earning potential, with monthly revenues capable of climbing to $1,423, occupancy reaching a high of 44.4%, and ADRs peaking at $120.
- Conversely, the slowest single month of the year, typically falling within the low season, marks the market's lowest point. In this month, revenue might dip to $883, occupancy could drop to 24.7%, and ADRs may adjust down to $98.
- Understanding both the seasonal averages and these monthly peaks and troughs in revenue, occupancy, and ADR is crucial for maximizing your Airbnb profit potential in Be’er-Sheva.
Seasonal Strategies for Maximizing Profit
- Peak Season: Maximize revenue through premium pricing and potentially longer minimum stays. Ensure high availability.
- Low Season: Offer competitive pricing, special promotions (e.g., extended stay discounts), and flexible cancellation policies. Target off-season travelers like remote workers or budget-conscious guests.
- Shoulder Seasons: Implement dynamic pricing that balances peak and low rates. Target weekend travelers or specific events. Offer slightly more flexible terms than peak season.
- Regularly analyze your own performance against these Be’er-Sheva seasonality benchmarks and adjust your pricing and availability strategy accordingly.
Best Areas for Airbnb Investment in Be’er-Sheva (2026)
Exploring the top neighborhoods for short-term rentals in Be’er-Sheva? This section highlights key areas, outlining why they are attractive for hosts and guests, along with notable local attractions. Consider these locations based on your target guest profile and investment strategy.
| Neighborhood / Area | Why Host Here? (Target Guests & Appeal) | Key Attractions & Landmarks |
|---|---|---|
| Old City of Be'er Sheva | Rich in history and culture, the Old City offers a unique glimpse into the heritage of Be'er Sheva, attracting tourists interested in historical experiences. | Be'er Sheva Fortress, Bedouin Market, Carasso Science Park, Negev Museum of Art, Turquoise Lake |
| Negev Highlands | A natural wonder with breathtaking landscapes and outdoor activities, perfect for travelers seeking adventure and tranquility away from city life. | Makhtesh Ramon, Avdat National Park, Nahal Zin, Timna Park, Ein Ovdat |
| Ramat Be'er Sheva | A residential area close to the city center, attractive to families and business professionals due to its convenience and amenities. | Local parks, Shopping centers, Be'er Sheva Central Bus Station, Nearby universities |
| University District | Home to Ben-Gurion University, this area is popular among students and academic visitors, providing affordable lodging options. | Ben-Gurion University, Student gardens, Cafes and eateries, Cultural events |
| New Be'er Sheva | A growing neighborhood with modern developments, appealing to young professionals and families wanting a newer environment. | Modern malls, Parks, Community centers |
| Be'er Sheva Industrial Zone | A hub for business and startups, attracting business travelers looking for convenient accommodations near their work. | Industrial parks, Startup incubators, Technology centers |
| Bedouin Areas | Experiences in authentic Bedouin culture attract tourists looking for unique cultural interactions and agritourism. | Bedouin hospitality, Cultural experiences, Desert activities, Camel rides |
| City Center | Vibrant area with restaurants, shops, and nightlife, making it ideal for tourists looking for a lively atmosphere and easy access to amenities. | Shopping malls, Dining options, Cafes and bars, Cultural venues |
Understanding Airbnb License Requirements & STR Laws in Be’er-Sheva (2026)
While Be’er-Sheva, Beersheba Subdistrict, Israel currently shows low STR regulations, specific Airbnb license requirements might still exist or change. Always verify the latest short term rental regulations and Airbnb license requirements directly with local government authorities for Be’er-Sheva to ensure full compliance before hosting.
(Source: AirROI data, 2026, finding no licensed listings among those analyzed)
Top Performing Airbnb Properties in Be’er-Sheva (2026)
Benchmark your potential! Explore examples of top-performing Airbnb properties in Be’er-Shevabased on Trailing Twelve Month (TTM) revenue. Analyze their characteristics, revenue, occupancy rate, and ADR to understand what drives success in this market.
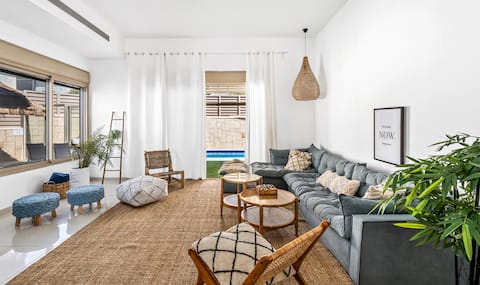
Perfect Villa Heated Pool, 9 Rooms 480 Meters
Entire Place • 9 bedrooms

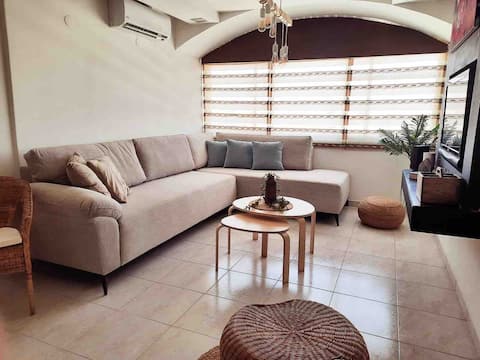
The Shinning Star - A beautiful 3 bedroom apt
Entire Place • 3 bedrooms

Comfort 3 bedroom Apt. by Soroka Medical Center
Entire Place • 3 bedrooms

Lovely New Central Apartment
Entire Place • 2 bedrooms

David tower apartment Beer Sheva
Entire Place • 2 bedrooms
Huge - Full 3 bedroom duplex
Entire Place • 3 bedrooms
Note: Performance varies based on location, size, amenities, seasonality, and management quality. Data reflects the past 12 months.
Top Performing Airbnb Hosts in Be’er-Sheva (2026)
Learn from the best! This table showcases top-performing Airbnb hosts in Be’er-Sheva based on the number of properties managed and estimated total revenue over the past year. Analyze their scale and performance metrics.
| Host Name | Properties | Grossing Revenue | Stay Reviews | Avg Rating |
|---|---|---|---|---|
| Lior | 1 | $57,092 | 62 | 4.79/5.0 |
| Alexandra | 7 | $55,539 | 573 | 4.58/5.0 |
| רבקה | 1 | $46,963 | 63 | 4.97/5.0 |
| Mor | 5 | $42,865 | 171 | 4.49/5.0 |
| Ann | 3 | $41,217 | 73 | 4.26/5.0 |
| Ruth | 1 | $31,094 | 30 | 4.90/5.0 |
| Gilad | 1 | $29,363 | 163 | 4.98/5.0 |
| David | 1 | $26,026 | 18 | 5.00/5.0 |
| ישראל | 3 | $24,630 | 20 | 4.30/5.0 |
| Yael | 1 | $21,201 | 39 | 4.82/5.0 |
Analyzing the strategies of top hosts, such as their property selection, pricing, and guest communication, can offer valuable lessons for optimizing your own Airbnb operations in Be’er-Sheva.
Dive Deeper: Advanced Be’er-Sheva STR Market Data (2026)
Ready to unlock more insights? AirROI provides access to advanced metrics and comprehensive Airbnb data for Be’er-Sheva. Explore detailed analytics beyond this report to refine your investment strategy, optimize pricing, and maximize your vacation rental profits.
Explore Advanced MetricsBe’er-Sheva Short-Term Rental Market Composition (2026): Property & Room Types
Room Type Distribution
Property Type Distribution
Market Composition Insights for Be’er-Sheva
- The Be’er-Sheva Airbnb market composition is heavily skewed towards Entire Home/Apt listings, which make up 90.6% of the 64 active rentals. This indicates strong guest preference for privacy and space.
- Looking at the property type distribution in Be’er-Sheva, Apartment/Condo properties are the most common (68.8%), reflecting the local real estate landscape.
- Houses represent a significant 18.8% portion, catering likely to families or larger groups.
- The presence of 7.8% Hotel/Boutique listings indicates integration with traditional hospitality.
- Smaller segments like others (combined 4.7%) offer potential for unique stay experiences.
Be’er-Sheva Airbnb Room Capacity Analysis (2026): Bedroom Distribution
Distribution of Listings by Number of Bedrooms
Room Capacity Insights for Be’er-Sheva
- The dominant room capacity in Be’er-Sheva is 1 bedroom listings, making up 60.9% of the market. This suggests a strong demand for properties suitable for couples or solo travelers.
- Together, 1 bedroom and 2 bedrooms properties represent 78.1% of the active Airbnb listings in Be’er-Sheva, indicating a high concentration in these sizes.
- With over half the market (60.9%) consisting of studios or 1-bedroom units, Be’er-Sheva is particularly well-suited for individuals or couples.
Be’er-Sheva Vacation Rental Guest Capacity Trends (2026)
Distribution of Listings by Guest Capacity
Guest Capacity Insights for Be’er-Sheva
- The most common guest capacity trend in Be’er-Sheva vacation rentals is listings accommodating 2 guests (28.1%). This suggests the primary traveler segment is likely couples or solo travelers.
- Properties designed for 2 guests and 4 guests dominate the Be’er-Sheva STR market, accounting for 54.7% of listings.
- 18.8% of properties accommodate 6+ guests, serving the market segment for larger families or group travel in Be’er-Sheva.
- On average, properties in Be’er-Sheva are equipped to host 3.4 guests.
Be’er-Sheva Airbnb Booking Patterns (2026): Available vs. Booked Days
Available Days Distribution
Booked Days Distribution
Booking Pattern Insights for Be’er-Sheva
- The most common availability pattern in Be’er-Sheva falls within the 271-366 days range, representing 56.3% of listings. This suggests many properties have significant open periods on their calendars.
- Approximately 95.4% of listings show high availability (181+ days open annually), indicating potential for increased bookings or specific owner usage patterns.
- For booked days, the 91-180 days range is most frequent in Be’er-Sheva (40.6%), reflecting common guest stay durations or potential owner blocking patterns.
- A notable 4.7% of properties secure long booking periods (181+ days booked per year), highlighting successful long-term rental strategies or significant owner usage.
Be’er-Sheva Airbnb Minimum Stay Requirements Analysis
Distribution of Listings by Minimum Night Requirement
1 Night
34 listings
53.1% of total
2 Nights
6 listings
9.4% of total
3 Nights
5 listings
7.8% of total
4-6 Nights
3 listings
4.7% of total
7-29 Nights
9 listings
14.1% of total
30+ Nights
7 listings
10.9% of total
Key Insights
- The most prevalent minimum stay requirement in Be’er-Sheva is 1 Night, adopted by 53.1% of listings. This highlights the market's preference for shorter, flexible bookings.
- A strong majority (62.5%) of the Be’er-Sheva Airbnb data shows acceptance of very short stays (1-2 nights), indicating a dynamic, high-turnover market.
- A significant segment (10.9%) caters to monthly stays (30+ nights) in Be’er-Sheva, pointing to opportunities in the extended-stay market.
Recommendations
- Align with the market by considering a 1 Night minimum stay, as 53.1% of Be’er-Sheva hosts use this setting.
- Explore offering discounts for stays of 30+ nights to attract the 10.9% of the market seeking extended stays.
- Adjust minimum nights based on seasonality – potentially shorter during low season and longer during peak demand periods in Be’er-Sheva.
Be’er-Sheva Airbnb Cancellation Policy Trends Analysis (2026)
Flexible
32 listings
50.8% of total
Moderate
19 listings
30.2% of total
Firm
12 listings
19% of total
Cancellation Policy Insights for Be’er-Sheva
- The prevailing Airbnb cancellation policy trend in Be’er-Sheva is Flexible, used by 50.8% of listings.
- The market strongly favors guest-friendly terms, with 81.0% of listings offering Flexible or Moderate policies. This suggests guests in Be’er-Sheva may expect booking flexibility.
Recommendations for Hosts
- Consider adopting a Flexible policy to align with the 50.8% market standard in Be’er-Sheva.
- Given the high prevalence of Flexible policies (50.8%), offering this can enhance booking appeal, especially during shoulder seasons.
- Regularly review your cancellation policy against competitors and market demand shifts in Be’er-Sheva.
Be’er-Sheva STR Booking Lead Time Analysis (2026)
Average Booking Lead Time by Month
Booking Lead Time Insights for Be’er-Sheva
- The overall average booking lead time for vacation rentals in Be’er-Sheva is 19 days.
- Guests book furthest in advance for stays during October (average 30 days), likely coinciding with peak travel demand or local events.
- The shortest booking windows occur for stays in July (average 13 days), indicating more last-minute travel plans during this time.
- Seasonally, Spring (22 days avg.) sees the longest lead times, while Winter (19 days avg.) has the shortest, reflecting typical travel planning cycles.
Recommendations for Hosts
- Use the overall average lead time (19 days) as a baseline for your pricing and availability strategy in Be’er-Sheva.
- For October stays, consider implementing length-of-stay discounts or slightly higher rates for bookings made less than 30 days out to capitalize on advance planning.
- Target marketing efforts for the Spring season well in advance (at least 22 days) to capture early planners.
- Monitor your own booking lead times against these Be’er-Sheva averages to identify opportunities for dynamic pricing adjustments.
Popular & Essential Airbnb Amenities in Be’er-Sheva (2026)
Amenity Prevalence
Amenity Insights for Be’er-Sheva
- Essential amenities in Be’er-Sheva that guests expect include: Air conditioning, Kitchen. Lacking these (any) could significantly impact bookings.
- Popular amenities like Washer, Wifi, TV are common but not universal. Offering these can provide a competitive edge.
- Warning: Wifi is not universally provided but is considered essential globally. Ensure reliable Wifi is offered.
Recommendations for Hosts
- Ensure your listing includes all essential amenities for Be’er-Sheva: Air conditioning, Kitchen.
- Prioritize adding missing essentials: Kitchen.
- Consider adding popular differentiators like Washer or Wifi to increase appeal.
- Highlight unique or less common amenities you offer (e.g., hot tub, dedicated workspace, EV charger) in your listing description and photos.
- Regularly check competitor amenities in Be’er-Sheva to stay competitive.
Be’er-Sheva Airbnb Guest Demographics & Profile Analysis (2026)
Guest Profile Summary for Be’er-Sheva
- The typical guest profile for Airbnb in Be’er-Sheva consists of a mix of domestic (54%) and international guests, often arriving from nearby Tel Aviv-Yafo, typically belonging to the Post-2000s (Gen Z/Alpha) group (50%), primarily speaking English or Hebrew.
- Domestic travelers account for 53.8% of guests.
- Key international markets include Israel (53.8%) and United States (28%).
- Top languages spoken are English (42.1%) followed by Hebrew (29.7%).
- A significant demographic segment is the Post-2000s (Gen Z/Alpha) group, representing 50% of guests.
Recommendations for Hosts
- Balance marketing efforts between domestic and international channels based on the guest mix.
- Tailor amenities and listing descriptions to appeal to the dominant Post-2000s (Gen Z/Alpha) demographic (e.g., highlight fast WiFi, smart home features, local guides).
- Highlight unique local experiences or amenities relevant to the primary guest profile.
- Consider seasonal promotions aligned with peak travel times for key origin markets.
Nearby Short-Term Rental Market Comparison
How does the Be’er-Sheva Airbnb market stack up against its neighbors? Compare key performance metrics like average monthly revenue, ADR, and occupancy rates in surrounding areas to understand the broader regional STR landscape.
| Market | Active Properties | Monthly Revenue | Daily Rate | Avg. Occupancy |
|---|---|---|---|---|
| Gilboa Regional Council | 81 | $4,225 | $551.37 | 31% |
| Emek HaMaayanot Regional Council | 75 | $3,365 | $489.11 | 31% |
| Hof HaCarmel Regional Council | 147 | $3,299 | $544.98 | 28% |
| Daliyat al-Karmel | 17 | $3,088 | $542.63 | 26% |
| Migdal | 86 | $2,967 | $556.42 | 28% |
| Kfar Tavor | 12 | $2,919 | $490.34 | 30% |
| Yavneel | 27 | $2,875 | $445.67 | 27% |
| Galil Tachton Regional Council | 83 | $2,858 | $420.47 | 30% |
| Arava Tichona Regional Council | 42 | $2,392 | $309.88 | 30% |
| Merom HaGalil Regional Council | 104 | $2,381 | $465.30 | 26% |