Farindola Airbnb Market Analysis 2025: Short Term Rental Data & Vacation Rental Statistics in Abruzzo, Italy
Is Airbnb profitable in Farindola in 2025? Explore comprehensive Airbnb analytics for Farindola, Abruzzo, Italy to uncover income potential. This 2025 STR market report for Farindola, based on AirROI data from August 2024 to July 2025, reveals key trends in the niche market of 18 active listings.
Whether you're considering an Airbnb investment in Farindola, optimizing your existing vacation rental, or exploring rental arbitrage opportunities, understanding the Farindola Airbnb data is crucial. Leveraging the low regulation environment is key to maximizing your short term rental income potential. Let's dive into the specifics.
Key Farindola Airbnb Performance Metrics Overview
Monthly Airbnb Revenue Variations & Income Potential in Farindola (2025)
Understanding the monthly revenue variations for Airbnb listings in Farindola is key to maximizing your short term rental income potential. Seasonality significantly impacts earnings. Our analysis, based on data from the past 12 months, shows that the peak revenue month for STRs in Farindola is typically August, while February often presents the lowest earnings, highlighting opportunities for strategic pricing adjustments during shoulder and low seasons. Explore the typical Airbnb income in Farindola across different performance tiers:
- Best-in-class properties (Top 10%) achieve $1,843+ monthly, often utilizing dynamic pricing and superior guest experiences.
- Strong performing properties (Top 25%) earn $1,188 or more, indicating effective management and desirable locations/amenities.
- Typical properties (Median) generate around $568 per month, representing the average market performance.
- Entry-level properties (Bottom 25%) see earnings around $258, often with potential for optimization.
Average Monthly Airbnb Earnings Trend in Farindola
Farindola Airbnb Occupancy Rate Trends (2025)
Maximize your bookings by understanding the Farindola STR occupancy trends. Seasonal demand shifts significantly influence how often properties are booked. Typically, Augustsees the highest demand (peak season occupancy), while February experiences the lowest (low season). Effective strategies, like adjusting minimum stays or offering promotions, can boost occupancy during slower periods. Here's how different property tiers perform in Farindola:
- Best-in-class properties (Top 10%) achieve 56%+ occupancy, indicating high desirability and potentially optimized availability.
- Strong performing properties (Top 25%) maintain 34% or higher occupancy, suggesting good market fit and guest satisfaction.
- Typical properties (Median) have an occupancy rate around 19%.
- Entry-level properties (Bottom 25%) average 11% occupancy, potentially facing higher vacancy.
Average Monthly Occupancy Rate Trend in Farindola
Average Daily Rate (ADR) Airbnb Trends in Farindola (2025)
Effective short term rental pricing strategy in Farindola involves understanding monthly ADR fluctuations. The Average Daily Rate (ADR) for Airbnb in Farindola typically peaks in July and dips lowest during February. Leveraging Airbnb dynamic pricing tools or strategies based on this seasonality can significantly boost revenue. Here's a look at the typical nightly rates achieved:
- Best-in-class properties (Top 10%) command rates of $218+ per night, often due to premium features or locations.
- Strong performing properties (Top 25%) achieve nightly rates of $123 or more.
- Typical properties (Median) charge around $86 per night.
- Entry-level properties (Bottom 25%) earn around $62 per night.
Average Daily Rate (ADR) Trend by Month in Farindola
Get Live Farindola Market Intelligence 👇

Explore Real-time Analytics
Airbnb Seasonality Analysis & Trends in Farindola (2025)
Peak Season (August, October, September)
- Revenue averages $1,496 per month
- Occupancy rates average 43.7%
- Daily rates average $107
Shoulder Season
- Revenue averages $698 per month
- Occupancy maintains around 23.2%
- Daily rates hold near $111
Low Season (January, February, December)
- Revenue drops to average $478 per month
- Occupancy decreases to average 16.3%
- Daily rates adjust to average $103
Seasonality Insights for Farindola
- The Airbnb seasonality in Farindola shows highly seasonal trends requiring careful strategy. While the sections above show seasonal averages, it's also insightful to look at the extremes:
- During the high season, the absolute peak month showcases Farindola's highest earning potential, with monthly revenues capable of climbing to $2,610, occupancy reaching a high of 71.0%, and ADRs peaking at $121.
- Conversely, the slowest single month of the year, typically falling within the low season, marks the market's lowest point. In this month, revenue might dip to $402, occupancy could drop to 8.9%, and ADRs may adjust down to $102.
- Understanding both the seasonal averages and these monthly peaks and troughs in revenue, occupancy, and ADR is crucial for maximizing your Airbnb profit potential in Farindola.
Seasonal Strategies for Maximizing Profit
- Peak Season: Maximize revenue through premium pricing and potentially longer minimum stays. Ensure high availability.
- Low Season: Offer competitive pricing, special promotions (e.g., extended stay discounts), and flexible cancellation policies. Target off-season travelers like remote workers or budget-conscious guests.
- Shoulder Seasons: Implement dynamic pricing that balances peak and low rates. Target weekend travelers or specific events. Offer slightly more flexible terms than peak season.
- Regularly analyze your own performance against these Farindola seasonality benchmarks and adjust your pricing and availability strategy accordingly.
Best Areas for Airbnb Investment in Farindola (2025)
Exploring the top neighborhoods for short-term rentals in Farindola? This section highlights key areas, outlining why they are attractive for hosts and guests, along with notable local attractions. Consider these locations based on your target guest profile and investment strategy.
| Neighborhood / Area | Why Host Here? (Target Guests & Appeal) | Key Attractions & Landmarks |
|---|---|---|
| Penne | Charming medieval town with beautiful architecture and historical significance. Popular for its proximity to the Gran Sasso National Park, making it ideal for nature lovers and outdoor activities. | Penne Cathedral, Museum of Sacred Art, Piazza G. B. Vico, Gran Sasso National Park, Chiesa di Santa Maria a Vico |
| Silvi Marina | Beach resort town known for its sandy beaches and vibrant summer tourism. Ideal for hosts looking to attract beachgoers and families during the summer months. | Silvi Marina Beach, Torre di Cerrano, Costa dei Parchi, Parco Naturale Regionale, Lido Santo Spirito |
| Montesilvano | Popular seaside destination offering a mix of beach, shopping, and local culture. Great potential for short-term rentals appealing to both tourists and business travelers. | Montesilvano Beach, Shopping Center Porto Allegro, Nature Reserve Pineta Dannunziana, Cultural events and festivals |
| Città Sant'Angelo | Historic town known for its beautiful hillside views and quaint streets. Attracts tourists looking for a more authentic Italian experience away from the coastal hustle. | Città Sant'Angelo Village, Chiesa di Santa Maria del Lago, Historic town center, Scenic views of the Abruzzo countryside |
| Castel di Sangro | Known for its proximity to skiing resorts and the Abruzzo National Park. A perfect spot for winter rentals and outdoor enthusiasts throughout the year. | Roccaraso Ski Resort, Castel di Sangro Cathedral, Abruzzo National Park, Alto Sangro |
| Atri | Rich in history and art, Atri has beautiful medieval architecture and is located close to the Adriatic coast. An attractive destination for culture seekers. | Atri Cathedral, Museo Archeologico, Basilica di San Bernardino, Cultural festivals |
| Roseto degli Abruzzi | Popular coastal town with beautiful beaches and a lively summer atmosphere. Excellent for beach rentals and family holidays. | Roseto Beach, Borgo di Cologna Spiaggia, Pineta della Libertà |
| Teramo | City with rich historical sites and a vibrant local culture. Offers opportunities for attracting both tourists and business travelers. | Teramo Cathedral, Roman Theatre, Piazza Martiri, Sanctuary of Madonna delle Grazie |
Understanding Airbnb License Requirements & STR Laws in Farindola (2025)
While Farindola, Abruzzo, Italy currently shows low STR regulations, specific Airbnb license requirements might still exist or change. Always verify the latest short term rental regulations and Airbnb license requirements directly with local government authorities for Farindola to ensure full compliance before hosting.
(Source: AirROI data, 2025, finding no licensed listings among those analyzed)
Top Performing Airbnb Properties in Farindola (2025)
Benchmark your potential! Explore examples of top-performing Airbnb properties in Farindolabased on Trailing Twelve Month (TTM) revenue. Analyze their characteristics, revenue, occupancy rate, and ADR to understand what drives success in this market.
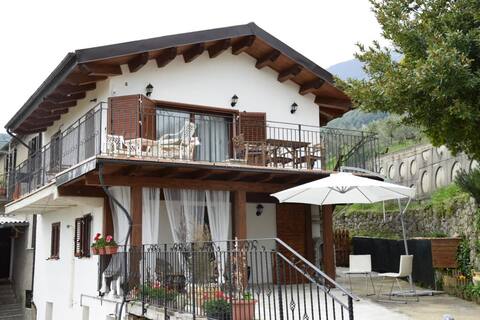
La Loggia Cabin
Entire Place • 2 bedrooms

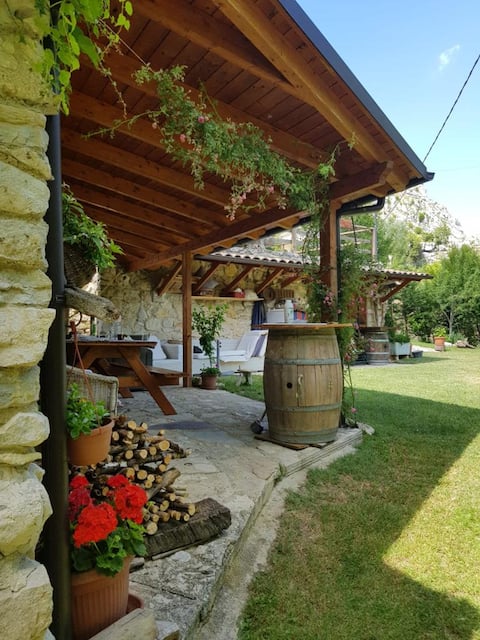
Villa Barricello
Entire Place • 3 bedrooms
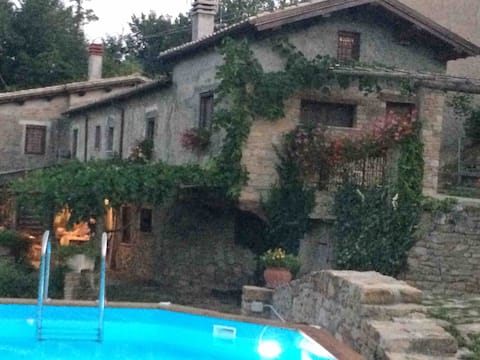
Chalet La Massaria
Entire Place • 1 bedroom
casa Giusy
Entire Place • 3 bedrooms

B&B Marinella entire place
Private Room • 5 bedrooms
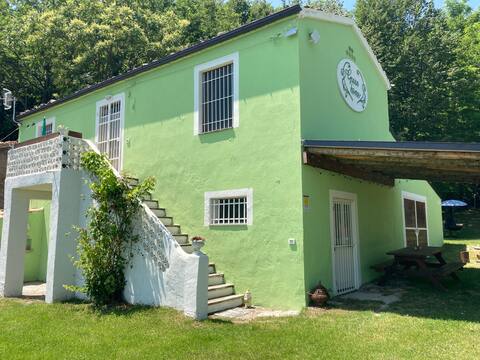
Green Home
Entire Place • 2 bedrooms
Note: Performance varies based on location, size, amenities, seasonality, and management quality. Data reflects the past 12 months.
Top Performing Airbnb Hosts in Farindola (2025)
Learn from the best! This table showcases top-performing Airbnb hosts in Farindola based on the number of properties managed and estimated total revenue over the past year. Analyze their scale and performance metrics.
| Host Name | Properties | Grossing Revenue | Stay Reviews | Avg Rating |
|---|---|---|---|---|
| Valentina | 3 | $17,272 | 5 | Not Rated |
| Gió | 1 | $14,077 | 60 | 4.98/5.0 |
| James Stephen | 1 | $13,801 | 29 | 4.97/5.0 |
| Francesco | 1 | $13,675 | 10 | 4.90/5.0 |
| Valeriano | 1 | $11,815 | 36 | 4.97/5.0 |
| Gabriella | 1 | $6,768 | 22 | 4.68/5.0 |
| Lorenzo | 2 | $6,114 | 12 | 4.82/5.0 |
| Ramon | 1 | $5,432 | 10 | 4.30/5.0 |
| Fabrizio | 1 | $4,763 | 19 | 4.89/5.0 |
| Tina | 1 | $4,681 | 28 | 4.82/5.0 |
Analyzing the strategies of top hosts, such as their property selection, pricing, and guest communication, can offer valuable lessons for optimizing your own Airbnb operations in Farindola.
Dive Deeper: Advanced Farindola STR Market Data (2025)
Ready to unlock more insights? AirROI provides access to advanced metrics and comprehensive Airbnb data for Farindola. Explore detailed analytics beyond this report to refine your investment strategy, optimize pricing, and maximize your vacation rental profits.
Explore Advanced MetricsFarindola Short-Term Rental Market Composition (2025): Property & Room Types
Room Type Distribution
Property Type Distribution
Market Composition Insights for Farindola
- The Farindola Airbnb market composition is heavily skewed towards Entire Home/Apt listings, which make up 77.8% of the 18 active rentals. This indicates strong guest preference for privacy and space.
- Looking at the property type distribution in Farindola, House properties are the most common (55.6%), reflecting the local real estate landscape.
- Houses represent a significant 55.6% portion, catering likely to families or larger groups.
- The presence of 16.7% Hotel/Boutique listings indicates integration with traditional hospitality.
Farindola Airbnb Room Capacity Analysis (2025): Bedroom Distribution
Distribution of Listings by Number of Bedrooms
Room Capacity Insights for Farindola
- The dominant room capacity in Farindola is 2 bedrooms listings, making up 50% of the market. This suggests a strong demand for properties suitable for couples or solo travelers.
- Together, 2 bedrooms and 1 bedroom properties represent 72.2% of the active Airbnb listings in Farindola, indicating a high concentration in these sizes.
- A significant 27.8% of listings offer 3+ bedrooms, catering to larger groups and families seeking more space in Farindola.
Farindola Vacation Rental Guest Capacity Trends (2025)
Distribution of Listings by Guest Capacity
Guest Capacity Insights for Farindola
- The most common guest capacity trend in Farindola vacation rentals is listings accommodating 4 guests (27.8%). This suggests the primary traveler segment is likely small families or groups.
- Properties designed for 4 guests and 5 guests dominate the Farindola STR market, accounting for 50.0% of listings.
- 22.3% of properties accommodate 6+ guests, serving the market segment for larger families or group travel in Farindola.
- On average, properties in Farindola are equipped to host 4.3 guests.
Farindola Airbnb Booking Patterns (2025): Available vs. Booked Days
Available Days Distribution
Booked Days Distribution
Booking Pattern Insights for Farindola
- The most common availability pattern in Farindola falls within the 271-366 days range, representing 88.9% of listings. This suggests many properties have significant open periods on their calendars.
- Approximately 100.0% of listings show high availability (181+ days open annually), indicating potential for increased bookings or specific owner usage patterns.
- For booked days, the 31-90 days range is most frequent in Farindola (55.6%), reflecting common guest stay durations or potential owner blocking patterns.
Farindola Airbnb Minimum Stay Requirements Analysis
Distribution of Listings by Minimum Night Requirement
1 Night
2 listings
11.1% of total
2 Nights
6 listings
33.3% of total
3 Nights
6 listings
33.3% of total
4-6 Nights
1 listings
5.6% of total
30+ Nights
3 listings
16.7% of total
Key Insights
- The most prevalent minimum stay requirement in Farindola is 2 Nights, adopted by 33.3% of listings. This highlights the market's preference for shorter, flexible bookings.
- A significant segment (16.7%) caters to monthly stays (30+ nights) in Farindola, pointing to opportunities in the extended-stay market.
Recommendations
- Align with the market by considering a 2 Nights minimum stay, as 33.3% of Farindola hosts use this setting.
- If feasible, allowing 1-night stays, especially midweek or during low season, could capture last-minute bookings, as only 11.1% currently do.
- A 2-night minimum appears standard (33.3%). Consider this for weekends or peak periods.
- Explore offering discounts for stays of 30+ nights to attract the 16.7% of the market seeking extended stays.
- Adjust minimum nights based on seasonality – potentially shorter during low season and longer during peak demand periods in Farindola.
Farindola Airbnb Cancellation Policy Trends Analysis (2025)
Flexible
6 listings
33.3% of total
Moderate
11 listings
61.1% of total
Strict
1 listings
5.6% of total
Cancellation Policy Insights for Farindola
- The prevailing Airbnb cancellation policy trend in Farindola is Moderate, used by 61.1% of listings.
- The market strongly favors guest-friendly terms, with 94.4% of listings offering Flexible or Moderate policies. This suggests guests in Farindola may expect booking flexibility.
- Strict cancellation policies are quite rare (5.6%), potentially making listings with this policy less competitive unless justified by high demand or property type.
Recommendations for Hosts
- Consider adopting a Moderate policy to align with the 61.1% market standard in Farindola.
- Using a Strict policy might deter some guests, as only 5.6% of listings use it. Evaluate if potential revenue protection outweighs possible lower booking rates.
- Regularly review your cancellation policy against competitors and market demand shifts in Farindola.
Farindola STR Booking Lead Time Analysis (2025)
Average Booking Lead Time by Month
Booking Lead Time Insights for Farindola
- The overall average booking lead time for vacation rentals in Farindola is 35 days.
- Guests book furthest in advance for stays during June (average 49 days), likely coinciding with peak travel demand or local events.
- The shortest booking windows occur for stays in November (average 11 days), indicating more last-minute travel plans during this time.
- Seasonally, Summer (47 days avg.) sees the longest lead times, while Fall (21 days avg.) has the shortest, reflecting typical travel planning cycles.
Recommendations for Hosts
- Use the overall average lead time (35 days) as a baseline for your pricing and availability strategy in Farindola.
- For June stays, consider implementing length-of-stay discounts or slightly higher rates for bookings made less than 49 days out to capitalize on advance planning.
- During November, focus on last-minute booking availability and promotions, as guests book with very short notice (11 days avg.).
- Target marketing efforts for the Summer season well in advance (at least 47 days) to capture early planners.
- Monitor your own booking lead times against these Farindola averages to identify opportunities for dynamic pricing adjustments.
Popular & Essential Airbnb Amenities in Farindola (2025)
Amenity Prevalence
Amenity Insights for Farindola
- Essential amenities in Farindola that guests expect include: Kitchen. Lacking these (this) could significantly impact bookings.
- Popular amenities like Heating, Refrigerator, Hair dryer are common but not universal. Offering these can provide a competitive edge.
Recommendations for Hosts
- Ensure your listing includes all essential amenities for Farindola: Kitchen.
- Consider adding popular differentiators like Heating or Refrigerator to increase appeal.
- Highlight unique or less common amenities you offer (e.g., hot tub, dedicated workspace, EV charger) in your listing description and photos.
- Regularly check competitor amenities in Farindola to stay competitive.
Farindola Airbnb Guest Demographics & Profile Analysis (2025)
Guest Profile Summary for Farindola
- The typical guest profile for Airbnb in Farindola consists of a mix of domestic (58%) and international guests, often arriving from nearby Rome, typically belonging to the Post-2000s (Gen Z/Alpha) group (50%), primarily speaking English or Italian.
- Domestic travelers account for 57.8% of guests.
- Key international markets include Italy (57.8%) and Germany (6.7%).
- Top languages spoken are English (34.1%) followed by Italian (29.3%).
- A significant demographic segment is the Post-2000s (Gen Z/Alpha) group, representing 50% of guests.
Recommendations for Hosts
- Balance marketing efforts between domestic and international channels based on the guest mix.
- Tailor amenities and listing descriptions to appeal to the dominant Post-2000s (Gen Z/Alpha) demographic (e.g., highlight fast WiFi, smart home features, local guides).
- Highlight unique local experiences or amenities relevant to the primary guest profile.
- Consider seasonal promotions aligned with peak travel times for key origin markets.
Nearby Short-Term Rental Market Comparison
How does the Farindola Airbnb market stack up against its neighbors? Compare key performance metrics like average monthly revenue, ADR, and occupancy rates in surrounding areas to understand the broader regional STR landscape.
| Market | Active Properties | Monthly Revenue | Daily Rate | Avg. Occupancy |
|---|---|---|---|---|
| Celleno | 15 | $2,706 | $545.33 | 24% |
| Rome | 26,089 | $2,680 | $210.58 | 50% |
| Parrano | 18 | $2,471 | $336.16 | 32% |
| Collazzone | 29 | $2,386 | $347.70 | 33% |
| Collevecchio | 15 | $2,349 | $292.62 | 38% |
| Guardea | 15 | $2,342 | $379.61 | 32% |
| Monteleone d'Orvieto | 35 | $2,142 | $322.92 | 31% |
| San Leo | 23 | $1,966 | $243.60 | 32% |
| Monte Castello di Vibio | 20 | $1,965 | $438.56 | 36% |
| Sant'Angelo in Pontano | 10 | $1,952 | $233.36 | 35% |