Roisan Airbnb Market Analysis 2026: Short Term Rental Data & Vacation Rental Statistics in Aosta Valley, Italy
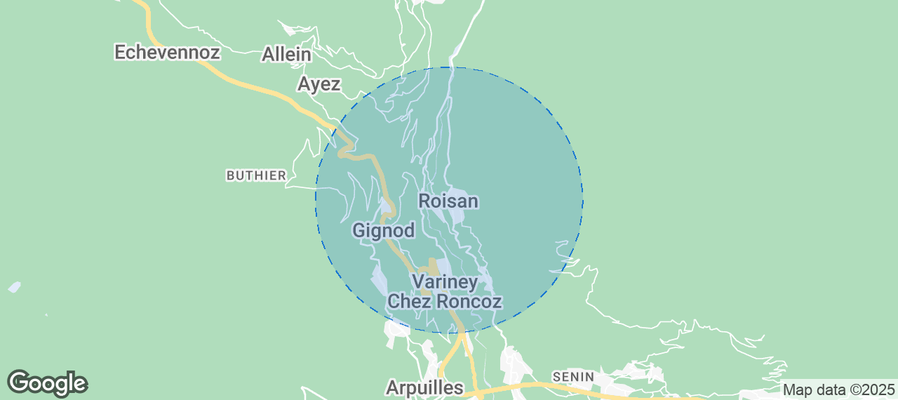
Is Airbnb profitable in Roisan in 2026? Explore comprehensive Airbnb analytics for Roisan, Aosta Valley, Italy to uncover income potential. This 2026 STR market report for Roisan, based on AirROI data from February 2025 to January 2026, reveals key trends in the niche market of 19 active listings.
Whether you're considering an Airbnb investment in Roisan, optimizing your existing vacation rental, or exploring rental arbitrage opportunities, understanding the Roisan Airbnb data is crucial. Navigating the high regulation landscape is key to maximizing your short term rental income potential. Let's dive into the specifics.
Key Roisan Airbnb Performance Metrics Overview
Monthly Airbnb Revenue Variations & Income Potential in Roisan (2026)
Understanding the monthly revenue variations for Airbnb listings in Roisan is key to maximizing your short term rental income potential. Seasonality significantly impacts earnings. Our analysis, based on data from the past 12 months, shows that the peak revenue month for STRs in Roisan is typically August, while November often presents the lowest earnings, highlighting opportunities for strategic pricing adjustments during shoulder and low seasons. Explore the typical Airbnb income in Roisan across different performance tiers:
- Best-in-class properties (Top 10%) achieve $2,927+ monthly, often utilizing dynamic pricing and superior guest experiences.
- Strong performing properties (Top 25%) earn $1,888 or more, indicating effective management and desirable locations/amenities.
- Typical properties (Median) generate around $1,282 per month, representing the average market performance.
- Entry-level properties (Bottom 25%) see earnings around $731, often with potential for optimization.
Average Monthly Airbnb Earnings Trend in Roisan
Roisan Airbnb Occupancy Rate Trends (2026)
Maximize your bookings by understanding the Roisan STR occupancy trends. Seasonal demand shifts significantly influence how often properties are booked. Typically, Augustsees the highest demand (peak season occupancy), while November experiences the lowest (low season). Effective strategies, like adjusting minimum stays or offering promotions, can boost occupancy during slower periods. Here's how different property tiers perform in Roisan:
- Best-in-class properties (Top 10%) achieve 67%+ occupancy, indicating high desirability and potentially optimized availability.
- Strong performing properties (Top 25%) maintain 51% or higher occupancy, suggesting good market fit and guest satisfaction.
- Typical properties (Median) have an occupancy rate around 38%.
- Entry-level properties (Bottom 25%) average 19% occupancy, potentially facing higher vacancy.
Average Monthly Occupancy Rate Trend in Roisan
Average Daily Rate (ADR) Airbnb Trends in Roisan (2026)
Effective short term rental pricing strategy in Roisan involves understanding monthly ADR fluctuations. The Average Daily Rate (ADR) for Airbnb in Roisan typically peaks in December and dips lowest during March. Leveraging Airbnb dynamic pricing tools or strategies based on this seasonality can significantly boost revenue. Here's a look at the typical nightly rates achieved:
- Best-in-class properties (Top 10%) command rates of $159+ per night, often due to premium features or locations.
- Strong performing properties (Top 25%) achieve nightly rates of $129 or more.
- Typical properties (Median) charge around $113 per night.
- Entry-level properties (Bottom 25%) earn around $93 per night.
Average Daily Rate (ADR) Trend by Month in Roisan
Get Live Roisan Market Intelligence 👇
Explore Real-time Analytics
Airbnb Seasonality Analysis & Trends in Roisan (2026)
Peak Season (August, July, June)
- Revenue averages $2,215 per month
- Occupancy rates average 52.8%
- Daily rates average $130
Shoulder Season
- Revenue averages $1,383 per month
- Occupancy maintains around 37.1%
- Daily rates hold near $118
Low Season (January, October, November)
- Revenue drops to average $877 per month
- Occupancy decreases to average 24.0%
- Daily rates adjust to average $143
Seasonality Insights for Roisan
- The Airbnb seasonality in Roisan shows highly seasonal trends requiring careful strategy. While the sections above show seasonal averages, it's also insightful to look at the extremes:
- During the high season, the absolute peak month showcases Roisan's highest earning potential, with monthly revenues capable of climbing to $2,586, occupancy reaching a high of 62.8%, and ADRs peaking at $153.
- Conversely, the slowest single month of the year, typically falling within the low season, marks the market's lowest point. In this month, revenue might dip to $696, occupancy could drop to 20.0%, and ADRs may adjust down to $105.
- Understanding both the seasonal averages and these monthly peaks and troughs in revenue, occupancy, and ADR is crucial for maximizing your Airbnb profit potential in Roisan.
Seasonal Strategies for Maximizing Profit
- Peak Season: Maximize revenue through premium pricing and potentially longer minimum stays. Ensure high availability.
- Low Season: Offer competitive pricing, special promotions (e.g., extended stay discounts), and flexible cancellation policies. Target off-season travelers like remote workers or budget-conscious guests.
- Shoulder Seasons: Implement dynamic pricing that balances peak and low rates. Target weekend travelers or specific events. Offer slightly more flexible terms than peak season.
- Regularly analyze your own performance against these Roisan seasonality benchmarks and adjust your pricing and availability strategy accordingly.
Best Areas for Airbnb Investment in Roisan (2026)
Exploring the top neighborhoods for short-term rentals in Roisan? This section highlights key areas, outlining why they are attractive for hosts and guests, along with notable local attractions. Consider these locations based on your target guest profile and investment strategy.
| Neighborhood / Area | Why Host Here? (Target Guests & Appeal) | Key Attractions & Landmarks |
|---|---|---|
| Aosta | The capital city of Aosta Valley, rich in history and culture. It's a central point for exploring the region, making it a prime location for tourists. | Roman Theatre of Aosta, Aosta Cathedral, The Arch of Augustus, Pila Ski Resort, Castle of Fenis, Valley of Aosta |
| Courmayeur | A famous Alpine resort known for its skiing and stunning views of Mont Blanc. Attracts winter sports enthusiasts and luxury travelers year-round. | Mont Blanc, Courmayeur Ski Resort, Val Ferret, Skyway Monte Bianco, Parco Nazionale del Gran Paradiso, Thermes de Pré-Saint-Didier |
| La Thuile | Another popular ski resort that attracts both winter and summer activity lovers. Known for its picturesque landscapes and hiking trails. | La Thuile Ski Resort, Tour du Mont Blanc, Les Suches, Colle del Piccolo San Bernardo, Hiking trails, Lago di Piagnon |
| Gressoney-Saint-Jean | Known for its hiking and ski opportunities, it offers a charming mountain town experience surrounded by nature. | Punta Jolanda, Monte Rosa, Gressoney Ski Resort, Castle of Wurtz, Hiking trails, Natural parks |
| Valpelline | A lesser-known gem in Aosta Valley, ideal for those looking for tranquility and nature-based activities. Perfect for outdoor enthusiasts. | Lake of Place Moulin, Hiking trails, Chapel of Saint Ilario, Valpelline Nature Park, Traditional festivals |
| Cogne | A beautiful valley that serves as a gateway to Gran Paradiso National Park, attracting nature lovers and hikers. | Gran Paradiso National Park, Valnontey, Cogne Nature Reserve, Hiking trails, Ice climbing in winter, Wildlife views |
| Saint-Vincent | Famous for its thermal baths and casino, it's an appealing destination for wellness travelers and those looking for leisure activities. | Saint-Vincent Thermal Spa, Casino de la Vallée, Saint-Vincent village, Hiking in the surrounding hills, Cultural events |
| Champoluc | A popular ski resort with access to Monterosa Ski, attracting winter sports lovers and summer hikers alike. | Monterosa Ski Area, Champoluc Ski Resort, Hiking resorts, Cascate di Mascognaz, Local alpine cuisine |
Understanding Airbnb License Requirements & STR Laws in Roisan (2026)
Yes, Roisan, Aosta Valley, Italy enforces high STR regulations. Obtaining a license and ensuring compliance is almost certainly required according to current 2026 STR laws. Always verify the latest short term rental regulations and Airbnb license requirements directly with local government authorities for Roisan to ensure full compliance before hosting.
(Source: AirROI data, 2026, based on 95% licensed listings)
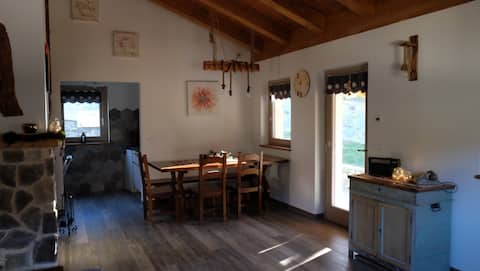
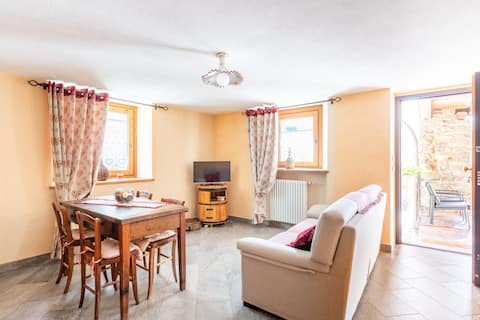
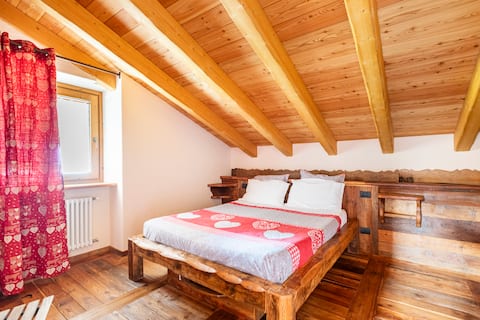
Top Performing Airbnb Properties in Roisan (2026)
Benchmark your potential! Explore examples of top-performing Airbnb properties in Roisanbased on Trailing Twelve Month (TTM) revenue. Analyze their characteristics, revenue, occupancy rate, and ADR to understand what drives success in this market.
La Casetta
Entire Place • 1 bedroom

Alp House - 10’ from Aosta with Private Garden
Entire Place • 1 bedroom
SOUVENIR DE TSANELI - SPA - 2 BEDROOMS FIRST FLOOR
Entire Place • 2 bedrooms
SOUVENIR DE TSANELI- ZONA SPA -2 CAMERE - MANSARDA
Entire Place • 2 bedrooms
Residence soleluna - Loft Sirio
Entire Place • 2 bedrooms

La Baita del nonno "Cien" - Aosta
Entire Place • 1 bedroom
Note: Performance varies based on location, size, amenities, seasonality, and management quality. Data reflects the past 12 months.
Top Performing Airbnb Hosts in Roisan (2026)
Learn from the best! This table showcases top-performing Airbnb hosts in Roisan based on the number of properties managed and estimated total revenue over the past year. Analyze their scale and performance metrics.
| Host Name | Properties | Grossing Revenue | Stay Reviews | Avg Rating |
|---|---|---|---|---|
| Ottavio | 3 | $58,912 | 253 | 4.89/5.0 |
| Valeria | 1 | $26,799 | 56 | 4.96/5.0 |
| Matteo - Alpan Experience | 1 | $25,537 | 25 | 4.96/5.0 |
| Alessio | 3 | $21,305 | 63 | 4.93/5.0 |
| Holidu | 1 | $20,410 | 5 | 4.80/5.0 |
| Luisa | 1 | $17,010 | 105 | 4.97/5.0 |
| Federico | 1 | $13,814 | 20 | 5.00/5.0 |
| Soleluna | 1 | $13,144 | 19 | 4.95/5.0 |
| Mautino Properties Srls | 1 | $12,358 | 4 | 4.00/5.0 |
| Francy | 1 | $11,663 | 107 | 4.95/5.0 |
Analyzing the strategies of top hosts, such as their property selection, pricing, and guest communication, can offer valuable lessons for optimizing your own Airbnb operations in Roisan.
Dive Deeper: Advanced Roisan STR Market Data (2026)
Ready to unlock more insights? AirROI provides access to advanced metrics and comprehensive Airbnb data for Roisan. Explore detailed analytics beyond this report to refine your investment strategy, optimize pricing, and maximize your vacation rental profits.
Explore Advanced MetricsRoisan Short-Term Rental Market Composition (2026): Property & Room Types
Room Type Distribution
Property Type Distribution
Market Composition Insights for Roisan
- The Roisan Airbnb market composition is heavily skewed towards Entire Home/Apt listings, which make up 100% of the 19 active rentals. This indicates strong guest preference for privacy and space.
- Looking at the property type distribution in Roisan, Apartment/Condo properties are the most common (63.2%), reflecting the local real estate landscape.
- Houses represent a significant 21.1% portion, catering likely to families or larger groups.
Roisan Airbnb Room Capacity Analysis (2026): Bedroom Distribution
Distribution of Listings by Number of Bedrooms
Room Capacity Insights for Roisan
- The dominant room capacity in Roisan is 1 bedroom listings, making up 52.6% of the market. This suggests a strong demand for properties suitable for couples or solo travelers.
- Together, 1 bedroom and 2 bedrooms properties represent 89.4% of the active Airbnb listings in Roisan, indicating a high concentration in these sizes.
- With over half the market (52.6%) consisting of studios or 1-bedroom units, Roisan is particularly well-suited for individuals or couples.
Roisan Vacation Rental Guest Capacity Trends (2026)
Distribution of Listings by Guest Capacity
Guest Capacity Insights for Roisan
- The most common guest capacity trend in Roisan vacation rentals is listings accommodating 4 guests (63.2%). This suggests the primary traveler segment is likely small families or groups.
- Properties designed for 4 guests and 2 guests dominate the Roisan STR market, accounting for 89.5% of listings.
- On average, properties in Roisan are equipped to host 3.6 guests.
Roisan Airbnb Booking Patterns (2026): Available vs. Booked Days
Available Days Distribution
Booked Days Distribution
Booking Pattern Insights for Roisan
- The most common availability pattern in Roisan falls within the 181-270 days range, representing 47.4% of listings. This suggests many properties have significant open periods on their calendars.
- Approximately 84.2% of listings show high availability (181+ days open annually), indicating potential for increased bookings or specific owner usage patterns.
- For booked days, the 91-180 days range is most frequent in Roisan (42.1%), reflecting common guest stay durations or potential owner blocking patterns.
- A notable 21.1% of properties secure long booking periods (181+ days booked per year), highlighting successful long-term rental strategies or significant owner usage.
Roisan Airbnb Minimum Stay Requirements Analysis
Distribution of Listings by Minimum Night Requirement
1 Night
3 listings
15.8% of total
2 Nights
5 listings
26.3% of total
3 Nights
2 listings
10.5% of total
30+ Nights
9 listings
47.4% of total
Key Insights
- The most prevalent minimum stay requirement in Roisan is 30+ Nights, adopted by 47.4% of listings. This highlights the market's preference for longer commitments.
- A significant segment (47.4%) caters to monthly stays (30+ nights) in Roisan, pointing to opportunities in the extended-stay market.
Recommendations
- Align with the market by considering a 30+ Nights minimum stay, as 47.4% of Roisan hosts use this setting.
- If feasible, allowing 1-night stays, especially midweek or during low season, could capture last-minute bookings, as only 15.8% currently do.
- Explore offering discounts for stays of 30+ nights to attract the 47.4% of the market seeking extended stays.
- Adjust minimum nights based on seasonality – potentially shorter during low season and longer during peak demand periods in Roisan.
Roisan Airbnb Cancellation Policy Trends Analysis (2026)
Flexible
7 listings
36.8% of total
Moderate
9 listings
47.4% of total
Firm
3 listings
15.8% of total
Cancellation Policy Insights for Roisan
- The prevailing Airbnb cancellation policy trend in Roisan is Moderate, used by 47.4% of listings.
- The market strongly favors guest-friendly terms, with 84.2% of listings offering Flexible or Moderate policies. This suggests guests in Roisan may expect booking flexibility.
Recommendations for Hosts
- Consider adopting a Moderate policy to align with the 47.4% market standard in Roisan.
- Regularly review your cancellation policy against competitors and market demand shifts in Roisan.
Roisan STR Booking Lead Time Analysis (2026)
Average Booking Lead Time by Month
Booking Lead Time Insights for Roisan
- The overall average booking lead time for vacation rentals in Roisan is 61 days.
- Guests book furthest in advance for stays during August (average 119 days), likely coinciding with peak travel demand or local events.
- The shortest booking windows occur for stays in February (average 16 days), indicating more last-minute travel plans during this time.
- Seasonally, Summer (96 days avg.) sees the longest lead times, while Fall (27 days avg.) has the shortest, reflecting typical travel planning cycles.
Recommendations for Hosts
- Use the overall average lead time (61 days) as a baseline for your pricing and availability strategy in Roisan.
- For August stays, consider implementing length-of-stay discounts or slightly higher rates for bookings made less than 119 days out to capitalize on advance planning.
- Target marketing efforts for the Summer season well in advance (at least 96 days) to capture early planners.
- Monitor your own booking lead times against these Roisan averages to identify opportunities for dynamic pricing adjustments.
Popular & Essential Airbnb Amenities in Roisan (2026)
Amenity Prevalence
Amenity Insights for Roisan
- Essential amenities in Roisan that guests expect include: Heating, Hair dryer, Dishes and silverware, Refrigerator. Lacking these (any) could significantly impact bookings.
- Popular amenities like Hot water, TV, Kitchen are common but not universal. Offering these can provide a competitive edge.
- Warning: Wifi is not universally provided but is considered essential globally. Ensure reliable Wifi is offered.
Recommendations for Hosts
- Ensure your listing includes all essential amenities for Roisan: Heating, Hair dryer, Dishes and silverware, Refrigerator.
- Consider adding popular differentiators like Hot water or TV to increase appeal.
- Highlight unique or less common amenities you offer (e.g., hot tub, dedicated workspace, EV charger) in your listing description and photos.
- Regularly check competitor amenities in Roisan to stay competitive.
Roisan Airbnb Guest Demographics & Profile Analysis (2026)
Guest Profile Summary for Roisan
- The typical guest profile for Airbnb in Roisan consists of a mix of domestic (38%) and international guests, with top international origins including France, typically belonging to the Post-2000s (Gen Z/Alpha) group (50%), primarily speaking English or French.
- Domestic travelers account for 38.3% of guests.
- Key international markets include Italy (38.3%) and France (24.5%).
- Top languages spoken are English (37.9%) followed by French (20.7%).
- A significant demographic segment is the Post-2000s (Gen Z/Alpha) group, representing 50% of guests.
Recommendations for Hosts
- Focus marketing internationally, particularly towards travelers from France.
- Tailor amenities and listing descriptions to appeal to the dominant Post-2000s (Gen Z/Alpha) demographic (e.g., highlight fast WiFi, smart home features, local guides).
- Highlight unique local experiences or amenities relevant to the primary guest profile.
- Consider seasonal promotions aligned with peak travel times for key origin markets.
Nearby Short-Term Rental Market Comparison
How does the Roisan Airbnb market stack up against its neighbors? Compare key performance metrics like average monthly revenue, ADR, and occupancy rates in surrounding areas to understand the broader regional STR landscape.
| Market | Active Properties | Monthly Revenue | Daily Rate | Avg. Occupancy |
|---|---|---|---|---|
| Brienzwiler | 11 | $7,335 | $514.27 | 60% |
| Niederried bei Interlaken | 19 | $6,267 | $552.03 | 44% |
| Lauterbrunnen | 552 | $6,108 | $487.83 | 51% |
| Ranco | 12 | $5,691 | $536.46 | 42% |
| Matten bei Interlaken | 64 | $5,607 | $336.51 | 59% |
| Grindelwald | 513 | $5,587 | $396.62 | 56% |
| Les Clefs | 34 | $5,585 | $314.08 | 47% |
| Monteu Roero | 12 | $5,184 | $403.07 | 41% |
| Wengen | 12 | $5,115 | $595.38 | 46% |
| Oberhofen am Thunersee | 25 | $5,051 | $329.28 | 51% |