Torgnon Airbnb Market Analysis 2026: Short Term Rental Data & Vacation Rental Statistics in Aosta Valley, Italy
Is Airbnb profitable in Torgnon in 2026? Explore comprehensive Airbnb analytics for Torgnon, Aosta Valley, Italy to uncover income potential. This 2026 STR market report for Torgnon, based on AirROI data from February 2025 to January 2026, reveals key trends in the niche market of 40 active listings.
Whether you're considering an Airbnb investment in Torgnon, optimizing your existing vacation rental, or exploring rental arbitrage opportunities, understanding the Torgnon Airbnb data is crucial. Navigating the high regulation landscape is key to maximizing your short term rental income potential. Let's dive into the specifics.
Key Torgnon Airbnb Performance Metrics Overview
Monthly Airbnb Revenue Variations & Income Potential in Torgnon (2026)
Understanding the monthly revenue variations for Airbnb listings in Torgnon is key to maximizing your short term rental income potential. Seasonality significantly impacts earnings. Our analysis, based on data from the past 12 months, shows that the peak revenue month for STRs in Torgnon is typically August, while September often presents the lowest earnings, highlighting opportunities for strategic pricing adjustments during shoulder and low seasons. Explore the typical Airbnb income in Torgnon across different performance tiers:
- Best-in-class properties (Top 10%) achieve $4,310+ monthly, often utilizing dynamic pricing and superior guest experiences.
- Strong performing properties (Top 25%) earn $2,961 or more, indicating effective management and desirable locations/amenities.
- Typical properties (Median) generate around $1,666 per month, representing the average market performance.
- Entry-level properties (Bottom 25%) see earnings around $823, often with potential for optimization.
Average Monthly Airbnb Earnings Trend in Torgnon
Torgnon Airbnb Occupancy Rate Trends (2026)
Maximize your bookings by understanding the Torgnon STR occupancy trends. Seasonal demand shifts significantly influence how often properties are booked. Typically, Februarysees the highest demand (peak season occupancy), while September experiences the lowest (low season). Effective strategies, like adjusting minimum stays or offering promotions, can boost occupancy during slower periods. Here's how different property tiers perform in Torgnon:
- Best-in-class properties (Top 10%) achieve 63%+ occupancy, indicating high desirability and potentially optimized availability.
- Strong performing properties (Top 25%) maintain 49% or higher occupancy, suggesting good market fit and guest satisfaction.
- Typical properties (Median) have an occupancy rate around 30%.
- Entry-level properties (Bottom 25%) average 16% occupancy, potentially facing higher vacancy.
Average Monthly Occupancy Rate Trend in Torgnon
Average Daily Rate (ADR) Airbnb Trends in Torgnon (2026)
Effective short term rental pricing strategy in Torgnon involves understanding monthly ADR fluctuations. The Average Daily Rate (ADR) for Airbnb in Torgnon typically peaks in December and dips lowest during May. Leveraging Airbnb dynamic pricing tools or strategies based on this seasonality can significantly boost revenue. Here's a look at the typical nightly rates achieved:
- Best-in-class properties (Top 10%) command rates of $289+ per night, often due to premium features or locations.
- Strong performing properties (Top 25%) achieve nightly rates of $210 or more.
- Typical properties (Median) charge around $152 per night.
- Entry-level properties (Bottom 25%) earn around $102 per night.
Average Daily Rate (ADR) Trend by Month in Torgnon
Get Live Torgnon Market Intelligence 👇

Explore Real-time Analytics
Airbnb Seasonality Analysis & Trends in Torgnon (2026)
Peak Season (August, February, December)
- Revenue averages $3,112 per month
- Occupancy rates average 47.2%
- Daily rates average $181
Shoulder Season
- Revenue averages $2,039 per month
- Occupancy maintains around 31.7%
- Daily rates hold near $174
Low Season (April, May, September)
- Revenue drops to average $1,293 per month
- Occupancy decreases to average 23.4%
- Daily rates adjust to average $161
Seasonality Insights for Torgnon
- The Airbnb seasonality in Torgnon shows highly seasonal trends requiring careful strategy. While the sections above show seasonal averages, it's also insightful to look at the extremes:
- During the high season, the absolute peak month showcases Torgnon's highest earning potential, with monthly revenues capable of climbing to $3,458, occupancy reaching a high of 57.1%, and ADRs peaking at $202.
- Conversely, the slowest single month of the year, typically falling within the low season, marks the market's lowest point. In this month, revenue might dip to $1,227, occupancy could drop to 19.7%, and ADRs may adjust down to $155.
- Understanding both the seasonal averages and these monthly peaks and troughs in revenue, occupancy, and ADR is crucial for maximizing your Airbnb profit potential in Torgnon.
Seasonal Strategies for Maximizing Profit
- Peak Season: Maximize revenue through premium pricing and potentially longer minimum stays. Ensure high availability.
- Low Season: Offer competitive pricing, special promotions (e.g., extended stay discounts), and flexible cancellation policies. Target off-season travelers like remote workers or budget-conscious guests.
- Shoulder Seasons: Implement dynamic pricing that balances peak and low rates. Target weekend travelers or specific events. Offer slightly more flexible terms than peak season.
- Regularly analyze your own performance against these Torgnon seasonality benchmarks and adjust your pricing and availability strategy accordingly.
Best Areas for Airbnb Investment in Torgnon (2026)
Exploring the top neighborhoods for short-term rentals in Torgnon? This section highlights key areas, outlining why they are attractive for hosts and guests, along with notable local attractions. Consider these locations based on your target guest profile and investment strategy.
| Neighborhood / Area | Why Host Here? (Target Guests & Appeal) | Key Attractions & Landmarks |
|---|---|---|
| Torgnon Town Center | The heart of Torgnon, offering a charming village atmosphere with easy access to shops and restaurants. It’s a great base for exploring the Aosta Valley and attracts visitors looking for a cozy alpine experience. | Church of San Giovanni Battista, Torgnon ski area, Local restaurants, Panoramic viewpoints, Hiking trails |
| Borgo di Torgnon | A picturesque neighborhood surrounded by nature, perfect for those looking for tranquility. The area features traditional architecture and scenic landscapes, appealing to nature lovers and families. | Hiking paths, Local farms, Views of the Alps, Cultural heritage sites, Natural parks |
| Planning Mont | Located near popular ski lifts, this area is highly attractive to winter sports enthusiasts looking for easy access to skiing. Ideal for both winter and summer outdoor activities. | Bucaneve ski area, Ski schools, Mountain restaurants, Mountain biking trails, Torgnon lake |
| Nus | Just a short drive from Torgnon, Nus offers a mix of historical sites and natural beauty. It draws visitors interested in cultural experiences as well as outdoor activities. | Nus Castle, Wine tasting tours, Hiking trails, Local festivals, Panoramic viewpoints |
| Chambave | Known for its vineyards and wine production, Chambave is perfect for foodies and those interested in local cuisine. This area offers a unique cultural experience distinct from typical alpine themes. | Vineyards tours, Wine tasting, Local cuisine, Nature walks, Cultural events |
| Valtournenche | Close to the famous Cervinia ski area, Valtournenche attracts ski and snowboarding enthusiasts. It’s also a fantastic area for summer hiking and mountaineering. | Cervinia ski area, Matterhorn views, Summer hiking trails, Mountain guides, Alpine lakes |
| Breuil-Cervinia | Renowned for its high altitude skiing and stunning views, this area attracts serious skiers and outdoor adventurers year-round. It features luxurious accommmodations and vibrant après-ski culture. | Cervinia ski slopes, Matterhorn Glacier, Golf course, Shopping, Restaurants |
| Antey-Saint-André | A charming village that provides a quieter alternative to the more touristy areas, Antey-Saint-André is ideal for travelers looking for a peaceful retreat amid stunning alpine scenery. | Alpine trails, Local festivals, Scenic viewpoints, Nature parks, Historical buildings |
Understanding Airbnb License Requirements & STR Laws in Torgnon (2026)
Yes, Torgnon, Aosta Valley, Italy enforces high STR regulations. Obtaining a license and ensuring compliance is almost certainly required according to current 2026 STR laws. Always verify the latest short term rental regulations and Airbnb license requirements directly with local government authorities for Torgnon to ensure full compliance before hosting.
(Source: AirROI data, 2026, based on 93% licensed listings)
Top Performing Airbnb Properties in Torgnon (2026)
Benchmark your potential! Explore examples of top-performing Airbnb properties in Torgnonbased on Trailing Twelve Month (TTM) revenue. Analyze their characteristics, revenue, occupancy rate, and ADR to understand what drives success in this market.
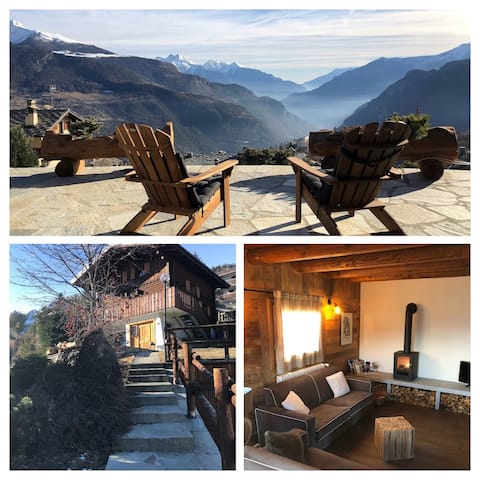
Beautiful chalet close to ski slopes
Entire Place • 5 bedrooms

Alpine Vista Villa Hardaker: 4 bedrooms Torgnon
Entire Place • 4 bedrooms

Le Refuge - Detached house on the ski slopes
Entire Place • 2 bedrooms
Large three-room apartment facing the ski lifts
Entire Place • 2 bedrooms
Chalet Gorret
Entire Place • 2 bedrooms
Skiing, walking, and nature just 5 mins walk away
Entire Place • 1 bedroom
Note: Performance varies based on location, size, amenities, seasonality, and management quality. Data reflects the past 12 months.
Top Performing Airbnb Hosts in Torgnon (2026)
Learn from the best! This table showcases top-performing Airbnb hosts in Torgnon based on the number of properties managed and estimated total revenue over the past year. Analyze their scale and performance metrics.
| Host Name | Properties | Grossing Revenue | Stay Reviews | Avg Rating |
|---|---|---|---|---|
| Maicol | 6 | $146,896 | 43 | 4.85/5.0 |
| Thierry | 1 | $77,472 | 51 | 4.92/5.0 |
| Adriana | 2 | $64,755 | 96 | 4.91/5.0 |
| Julian | 1 | $48,411 | 16 | 4.63/5.0 |
| Chiara | 1 | $38,989 | 40 | 4.80/5.0 |
| Emanuela | 1 | $35,598 | 12 | 4.75/5.0 |
| Paola E Enzo | 1 | $34,635 | 13 | 4.92/5.0 |
| Veronica | 1 | $31,874 | 18 | 5.00/5.0 |
| Alessandra Deborah | 1 | $28,435 | 11 | 4.91/5.0 |
| Camilla | 1 | $24,326 | 8 | 5.00/5.0 |
Analyzing the strategies of top hosts, such as their property selection, pricing, and guest communication, can offer valuable lessons for optimizing your own Airbnb operations in Torgnon.
Dive Deeper: Advanced Torgnon STR Market Data (2026)
Ready to unlock more insights? AirROI provides access to advanced metrics and comprehensive Airbnb data for Torgnon. Explore detailed analytics beyond this report to refine your investment strategy, optimize pricing, and maximize your vacation rental profits.
Explore Advanced MetricsTorgnon Short-Term Rental Market Composition (2026): Property & Room Types
Room Type Distribution
Property Type Distribution
Market Composition Insights for Torgnon
- The Torgnon Airbnb market composition is heavily skewed towards Entire Home/Apt listings, which make up 95% of the 40 active rentals. This indicates strong guest preference for privacy and space.
- Looking at the property type distribution in Torgnon, Apartment/Condo properties are the most common (72.5%), reflecting the local real estate landscape.
- Houses represent a significant 20% portion, catering likely to families or larger groups.
- Smaller segments like hotel/boutique (combined 2.5%) offer potential for unique stay experiences.
Torgnon Airbnb Room Capacity Analysis (2026): Bedroom Distribution
Distribution of Listings by Number of Bedrooms
Room Capacity Insights for Torgnon
- The dominant room capacity in Torgnon is 1 bedroom listings, making up 45% of the market. This suggests a strong demand for properties suitable for couples or solo travelers.
- Together, 1 bedroom and 2 bedrooms properties represent 87.5% of the active Airbnb listings in Torgnon, indicating a high concentration in these sizes.
- Listings with 3+ bedrooms (7.5%) represent a smaller niche, potentially indicating an underserved market for larger group accommodations in Torgnon.
Torgnon Vacation Rental Guest Capacity Trends (2026)
Distribution of Listings by Guest Capacity
Guest Capacity Insights for Torgnon
- The most common guest capacity trend in Torgnon vacation rentals is listings accommodating 4 guests (37.5%). This suggests the primary traveler segment is likely small families or groups.
- Properties designed for 4 guests and 6 guests dominate the Torgnon STR market, accounting for 57.5% of listings.
- 27.5% of properties accommodate 6+ guests, serving the market segment for larger families or group travel in Torgnon.
- On average, properties in Torgnon are equipped to host 4.3 guests.
Torgnon Airbnb Booking Patterns (2026): Available vs. Booked Days
Available Days Distribution
Booked Days Distribution
Booking Pattern Insights for Torgnon
- The most common availability pattern in Torgnon falls within the 271-366 days range, representing 57.5% of listings. This suggests many properties have significant open periods on their calendars.
- Approximately 100.0% of listings show high availability (181+ days open annually), indicating potential for increased bookings or specific owner usage patterns.
- For booked days, the 91-180 days range is most frequent in Torgnon (45%), reflecting common guest stay durations or potential owner blocking patterns.
Torgnon Airbnb Minimum Stay Requirements Analysis
Distribution of Listings by Minimum Night Requirement
1 Night
2 listings
5% of total
2 Nights
7 listings
17.5% of total
3 Nights
6 listings
15% of total
4-6 Nights
4 listings
10% of total
7-29 Nights
3 listings
7.5% of total
30+ Nights
18 listings
45% of total
Key Insights
- The most prevalent minimum stay requirement in Torgnon is 30+ Nights, adopted by 45% of listings. This highlights the market's preference for longer commitments.
- A significant segment (45%) caters to monthly stays (30+ nights) in Torgnon, pointing to opportunities in the extended-stay market.
Recommendations
- Align with the market by considering a 30+ Nights minimum stay, as 45% of Torgnon hosts use this setting.
- If feasible, allowing 1-night stays, especially midweek or during low season, could capture last-minute bookings, as only 5% currently do.
- Explore offering discounts for stays of 30+ nights to attract the 45% of the market seeking extended stays.
- Adjust minimum nights based on seasonality – potentially shorter during low season and longer during peak demand periods in Torgnon.
Torgnon Airbnb Cancellation Policy Trends Analysis (2026)
Limited
1 listings
2.5% of total
Flexible
9 listings
22.5% of total
Moderate
24 listings
60% of total
Firm
5 listings
12.5% of total
Strict
1 listings
2.5% of total
Cancellation Policy Insights for Torgnon
- The prevailing Airbnb cancellation policy trend in Torgnon is Moderate, used by 60% of listings.
- The market strongly favors guest-friendly terms, with 82.5% of listings offering Flexible or Moderate policies. This suggests guests in Torgnon may expect booking flexibility.
- Strict cancellation policies are quite rare (2.5%), potentially making listings with this policy less competitive unless justified by high demand or property type.
Recommendations for Hosts
- Consider adopting a Moderate policy to align with the 60% market standard in Torgnon.
- Using a Strict policy might deter some guests, as only 2.5% of listings use it. Evaluate if potential revenue protection outweighs possible lower booking rates.
- Regularly review your cancellation policy against competitors and market demand shifts in Torgnon.
Torgnon STR Booking Lead Time Analysis (2026)
Average Booking Lead Time by Month
Booking Lead Time Insights for Torgnon
- The overall average booking lead time for vacation rentals in Torgnon is 52 days.
- Guests book furthest in advance for stays during August (average 94 days), likely coinciding with peak travel demand or local events.
- The shortest booking windows occur for stays in November (average 8 days), indicating more last-minute travel plans during this time.
- Seasonally, Winter (69 days avg.) sees the longest lead times, while Fall (17 days avg.) has the shortest, reflecting typical travel planning cycles.
Recommendations for Hosts
- Use the overall average lead time (52 days) as a baseline for your pricing and availability strategy in Torgnon.
- For August stays, consider implementing length-of-stay discounts or slightly higher rates for bookings made less than 94 days out to capitalize on advance planning.
- During November, focus on last-minute booking availability and promotions, as guests book with very short notice (8 days avg.).
- Target marketing efforts for the Winter season well in advance (at least 69 days) to capture early planners.
- Monitor your own booking lead times against these Torgnon averages to identify opportunities for dynamic pricing adjustments.
Popular & Essential Airbnb Amenities in Torgnon (2026)
Amenity Prevalence
Amenity Insights for Torgnon
- Essential amenities in Torgnon that guests expect include: Kitchen. Lacking these (this) could significantly impact bookings.
- Popular amenities like TV, Hair dryer, Refrigerator are common but not universal. Offering these can provide a competitive edge.
Recommendations for Hosts
- Ensure your listing includes all essential amenities for Torgnon: Kitchen.
- Prioritize adding missing essentials: Kitchen.
- Consider adding popular differentiators like TV or Hair dryer to increase appeal.
- Highlight unique or less common amenities you offer (e.g., hot tub, dedicated workspace, EV charger) in your listing description and photos.
- Regularly check competitor amenities in Torgnon to stay competitive.
Torgnon Airbnb Guest Demographics & Profile Analysis (2026)
Guest Profile Summary for Torgnon
- The typical guest profile for Airbnb in Torgnon consists of primarily domestic travelers (67%), often arriving from nearby Milan, typically belonging to the Post-2000s (Gen Z/Alpha) group (50%), primarily speaking English or Italian.
- Domestic travelers account for 67.3% of guests.
- Key international markets include Italy (67.3%) and France (10.2%).
- Top languages spoken are English (32.1%) followed by Italian (31.1%).
- A significant demographic segment is the Post-2000s (Gen Z/Alpha) group, representing 50% of guests.
Recommendations for Hosts
- Target domestic marketing efforts towards travelers from Milan and Genoa.
- Tailor amenities and listing descriptions to appeal to the dominant Post-2000s (Gen Z/Alpha) demographic (e.g., highlight fast WiFi, smart home features, local guides).
- Highlight unique local experiences or amenities relevant to the primary guest profile.
- Consider seasonal promotions aligned with peak travel times for key origin markets.
Nearby Short-Term Rental Market Comparison
How does the Torgnon Airbnb market stack up against its neighbors? Compare key performance metrics like average monthly revenue, ADR, and occupancy rates in surrounding areas to understand the broader regional STR landscape.
| Market | Active Properties | Monthly Revenue | Daily Rate | Avg. Occupancy |
|---|---|---|---|---|
| Brienzwiler | 11 | $7,335 | $514.27 | 60% |
| Niederried bei Interlaken | 19 | $6,267 | $552.03 | 44% |
| Lauterbrunnen | 552 | $6,108 | $487.83 | 51% |
| Ranco | 12 | $5,691 | $536.46 | 42% |
| Matten bei Interlaken | 64 | $5,607 | $336.51 | 59% |
| Grindelwald | 513 | $5,587 | $396.62 | 56% |
| Les Clefs | 34 | $5,585 | $314.08 | 47% |
| Monteu Roero | 12 | $5,184 | $403.07 | 41% |
| Wengen | 12 | $5,115 | $595.38 | 46% |
| Oberhofen am Thunersee | 25 | $5,051 | $329.28 | 51% |